New Year's Thought on AUD/USD Potential Intervention by RBA
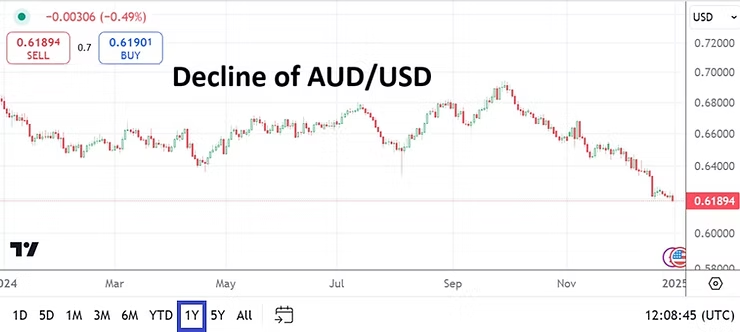
AUD/USD One Year Chart as of 1st January 2025
1 year chart of AUDUSD showing decline and lows as rumors swirl about the Reserve Bank of Australia contemplating intervention due to weak Australian Dollar.
AUD/USD and AMT thoughts: Australia’s govt is led by the Labor party which is socialist based, so it would be no surprise if they and the Reserve Bank of Australia believe (wrongly) they can intervene to help the strength of the AUD, when actually they should work on improving the fundamentals of their economy with solid fiscal policy. But being socialists they don’t know how to do that. Labor is going to lose big in the next Australian federal government election.
Forex: Shifting Winds and Potential Optimism for Speculators
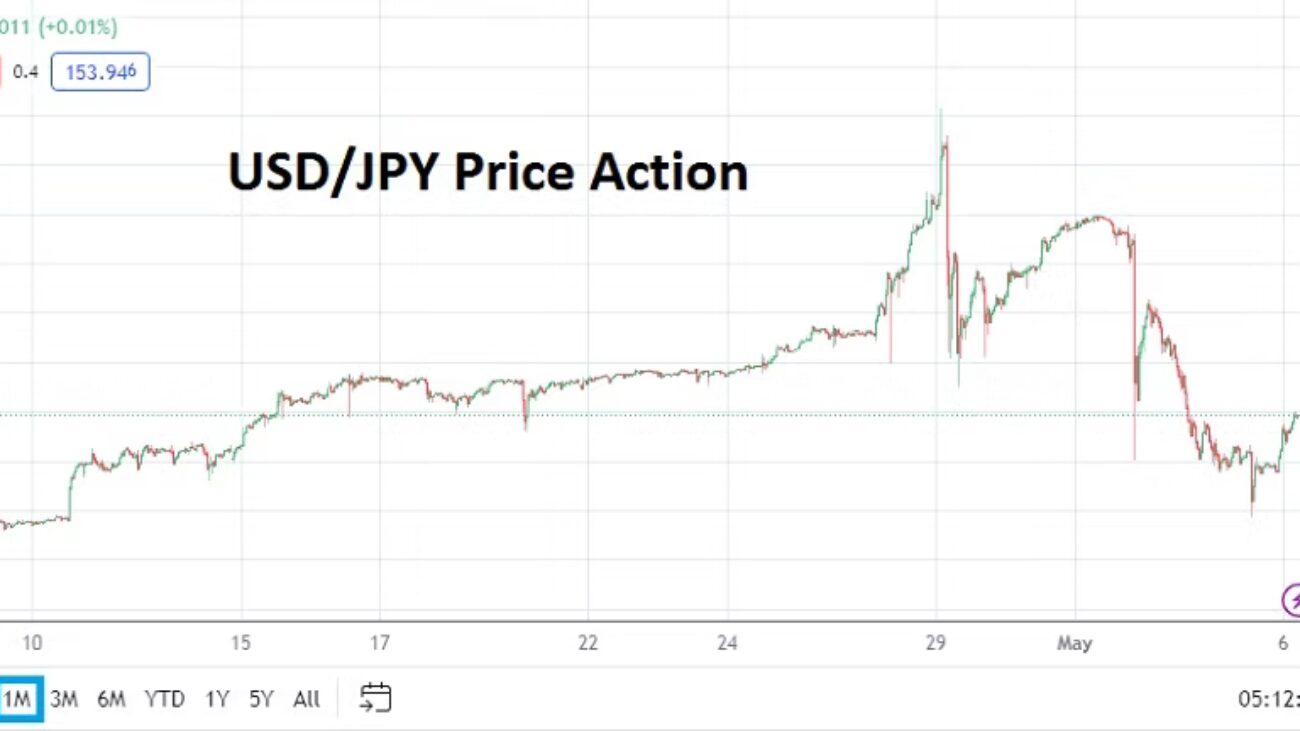
The BoJ intervened in Forex and propelled two fast selloffs of the USD/JPY last week. The actions by the Bank of Japan did not come as a surprise as the central bank seeks to maintain a dovish interest rate policy, a relatively weak Japanese Yen – but also a philosophy of not letting the JPY to suffer too much. Speculators and financial institutions got caught up in the price action which ensued as a clash developed between large traders and the BoJ as equilibrium was sought.
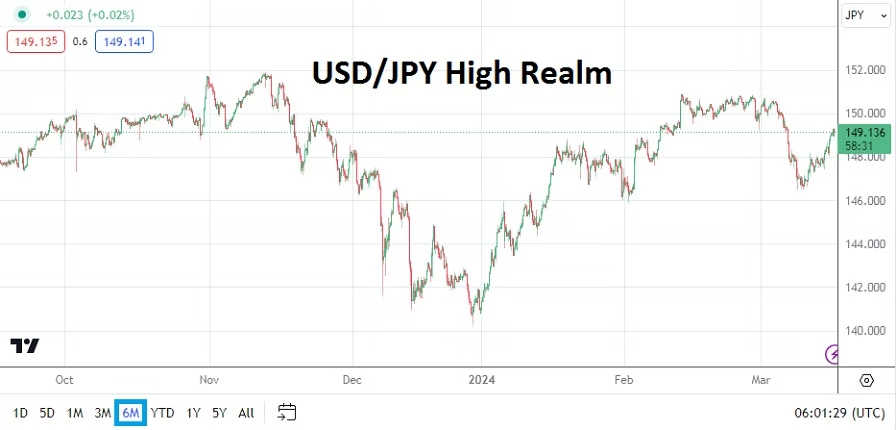
The BoJ clearly wants to keep the USD/JPY within the weaker realms of its long-term values to spur on the Japanese export sector with solid business results. However, domestically the Japanese government doesn’t want inflation within Japan to inflict too much pain for its citizens. BoJ interventions were carried out twice last week, once during a holiday in Japan, and the second when most global financial institutions were shuttered. At the time of this writing the USD/JPY is trading near the 153.720 mark.
Day traders always need to understand just how small they are within the larger speculative world. They need to judge economic intelligence and forecasts to get an understanding where behavioral sentiment could affect tides.
USD/JPY One Month Chart on 6th of May 2024
In the U.S, inflation and growth data caused investors to react nervously a week and a a half ago, additionally more anxious moments were fueled by the Federal Reserve’s FOMC Statement this past Wednesday when the Fed said it was uncertain about the timetable that inflation would return to their stated goal of two percent. Forex trading has been volatile the entire calendar year of 2024 for speculators.
Nearly ten days ago while inflation continued to prove it was stubborn via the U.S GDP Price Index on the 25th of April, Advance GDP data was much weaker than expected showing that economic growth was slowing. And last Friday’s Non-Farm Employment results were not only weaker regarding hiring, but also showed a slight drop in Average Hourly Earnings. This might have been enough to begin causing a shift in financial institution outlooks. This week of trading will prove interesting regarding risk appetite versus risk averse sentiment, particularly if large players believe economic data is finally catching up to the Fed’s rhetoric.
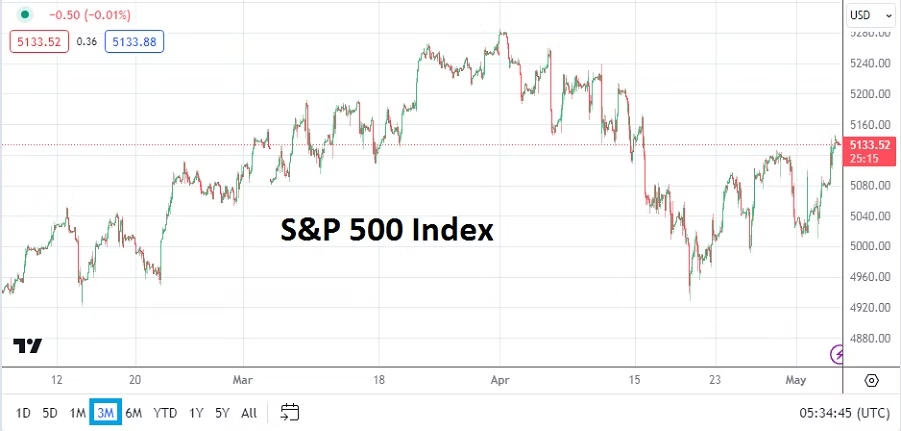
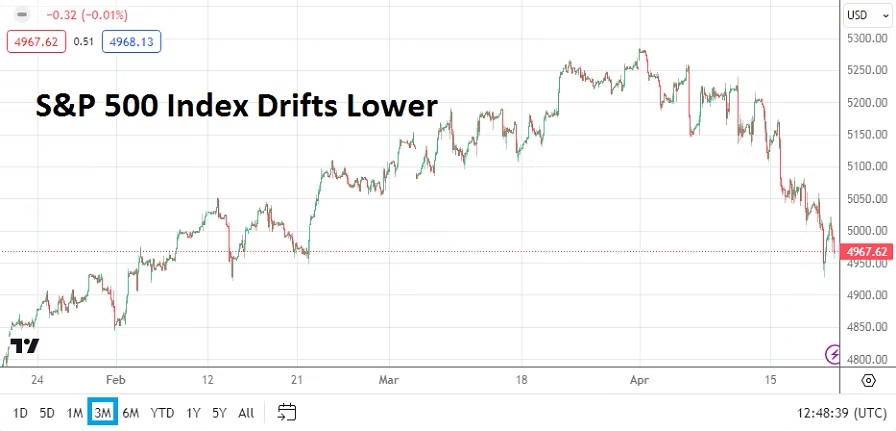
U.S equity indices which started last week with selling and battled lower depths in the middle of the week, began to see buying develop on Thursday, and finished Friday’s trading within their highs via weekly technical charts. While it is easy to report the past, it is the future speculators want to know. The ability of the U.S jobs numbers to produce results which were seen in a favorable light regarding the Fed’s ability to potentially cut the Federal Funds Rate certainly was an optimistic sign for financial institutions. If inflation can remain under control it would help the global economic picture. On that note, WTI Crude Oil is trading below 80.00 USD and should be monitored.
S&P 500 Index Three Month Chart on 6th of May 2024.
Monday, 6th of May, European Union Final Services PMI – Italy, France and Germany among other will present Purchasing Managers Index data. The broad numbers are mostly expected to replicate the previous month’s outcomes. Traders should note the U.K is observing a banking holiday today, which means lighter than normal Forex volumes will be seen.
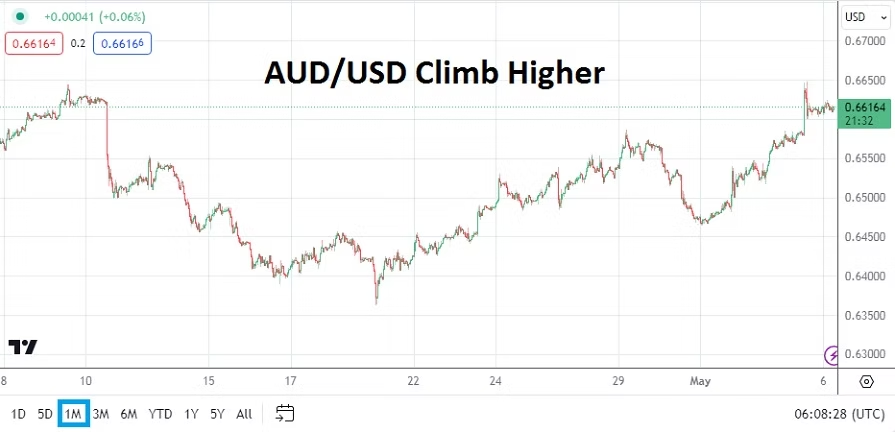
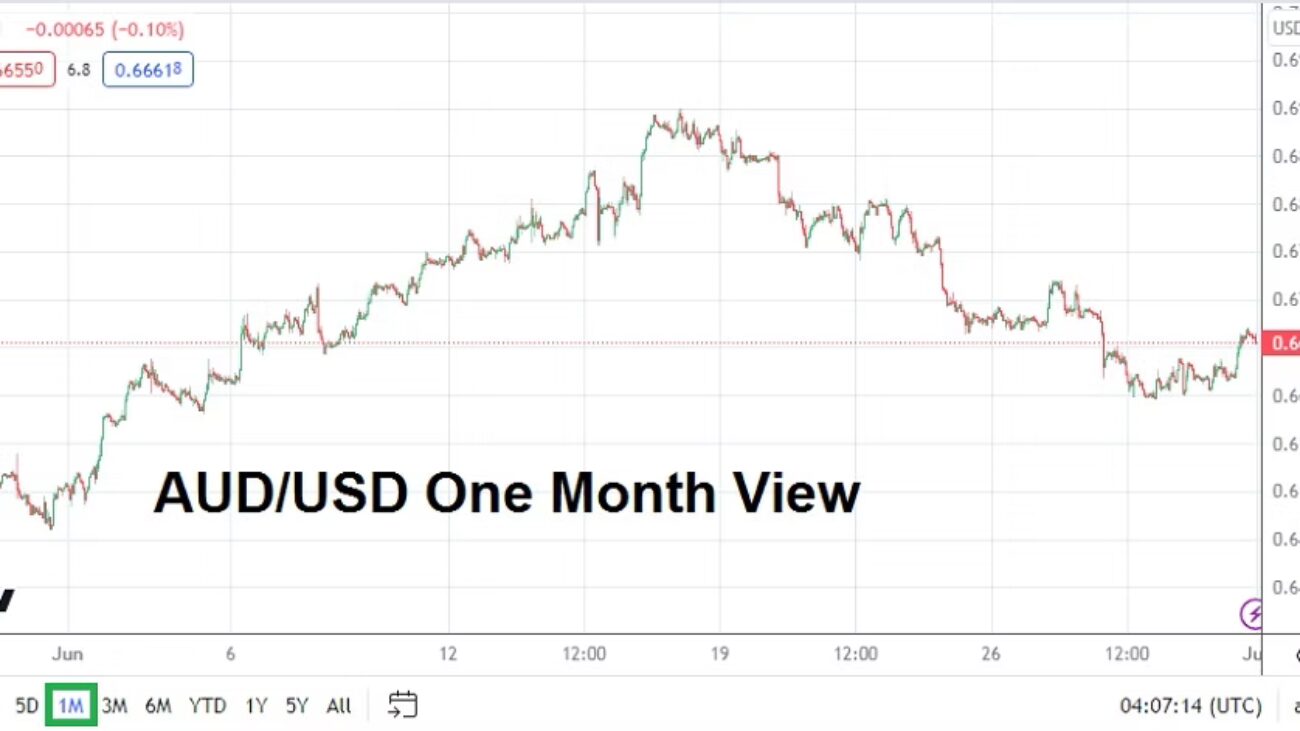
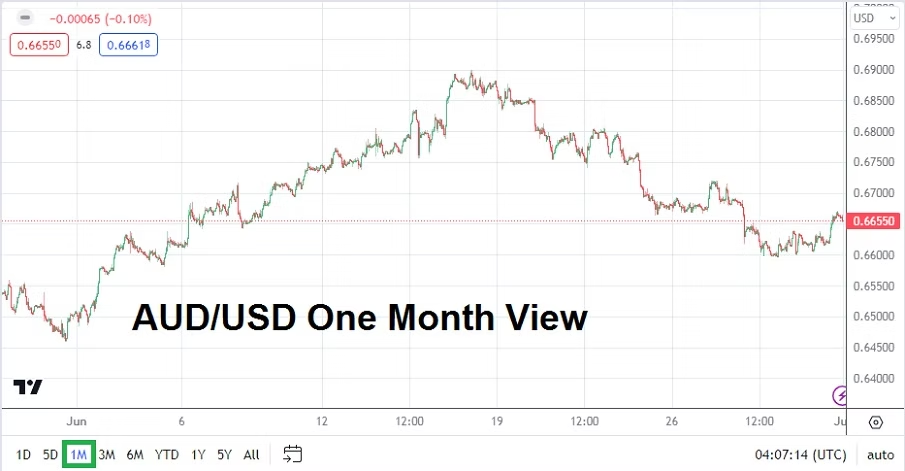
Tuesday, 7th of May, Reserve Bank of Australia Monetary Policy Statement – the central bank is not expected to change its interest rate. The AUD/USD has provided some upwards momentum the past week. The RBA is not expected to step out of line regarding global central bank policies. Expect talk about an optimistically cautious outlook by the RBA as they preach patience regarding an interest rate cut.
AUD/USD One Month Chart on 6th of May 2024
Wednesday, 8th of May, Bond Sales from Japan, the U.K and the U.S – while many European nations observe a holiday, Japan, Great Britain and the U.S will sell government debt. U.S Treasury yields should be watched and equity indices should have an eye kept on them. If behavioral sentiment remains optimistic as this day comes to a close it could set the table for more bullishness, particularly if the USD remains relatively tame or weaker.
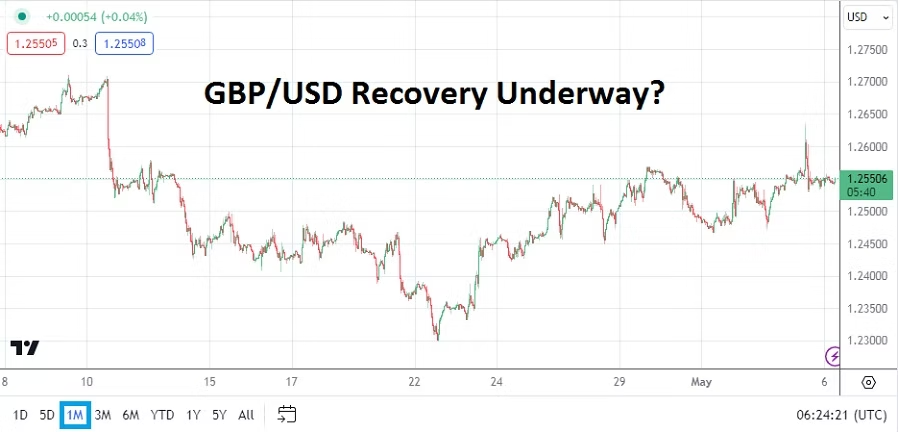
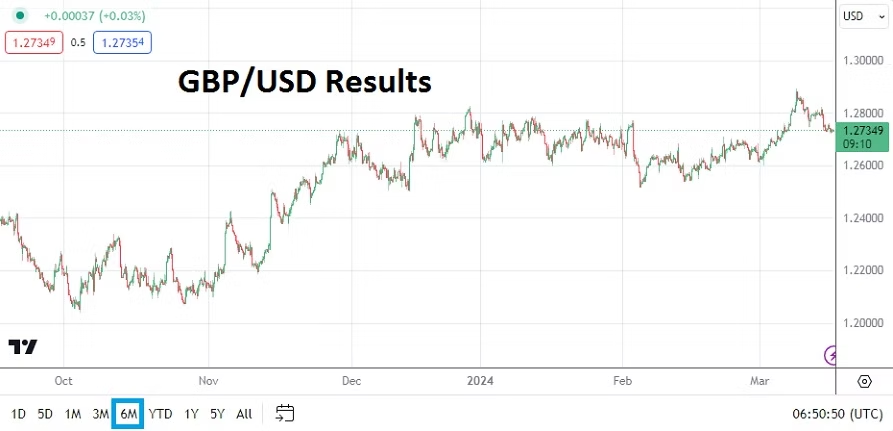
Thursday, 9th of May, Bank of England Monetary Policy Summary – the BoE is likely to mirror other central banks and keep its interest rate policy in place. No changes are expected to the Official Bank Rate. However, it would not be surprising to hear the BoE try to pose upbeat expectations, and if this occurs perhaps the GBP/USD will continue to find some momentum upwards.
GBP/USD One Month Chart on 6th of May 2024
Thursday, 9th of May, U.S Weekly Unemployment Claims – investors will keep their eyes on the jobs report. If the numbers come in around expectations this would allow risk appetite to remain strong in the near-term.
Friday, 10th of May, U.K Gross Domestic Product – an expected gain of 0.1% is forecast. GBP/USD traders who have bullish sentiment will be looking for the number to match expectations or beat the anticipated result. If the number is weaker, this could cause a reversal lower in the GBP/USD and an attempt to push back against gains made in the currency pair recently.
Friday, 10th of May, U.S Consumer Sentiment and Inflation Expectations via the University of Michigan – these readings will be watched by investors to see if consumers continue to show decreasing confidence in the U.S economy. While it sounds counter intuitive to want eroding sentiment regarding the ability to spend money, this would create more ammunition for the Federal Reserve to consider an interest rate cut. The Inflation Expectations could be the catalyst for traders going into the weekend regarding the USD.
Impact: Powell's White Flag, Inflation Data, and the BoJ
Federal Reserve Chairman Jerome Powell’s waving of the ‘white flag’ last Tuesday, when he admitted that inflation was producing stronger than anticipated data had been essentially wagered on since the second week of March by financial institutions. Powell’s speech acknowledging the Fed will find it difficult to cut the Federal Funds Rate in the mid-term (and probably at best not until late this summer) simply verified Forex positions which had already been taken by large players who could afford to make mid-term wagers.
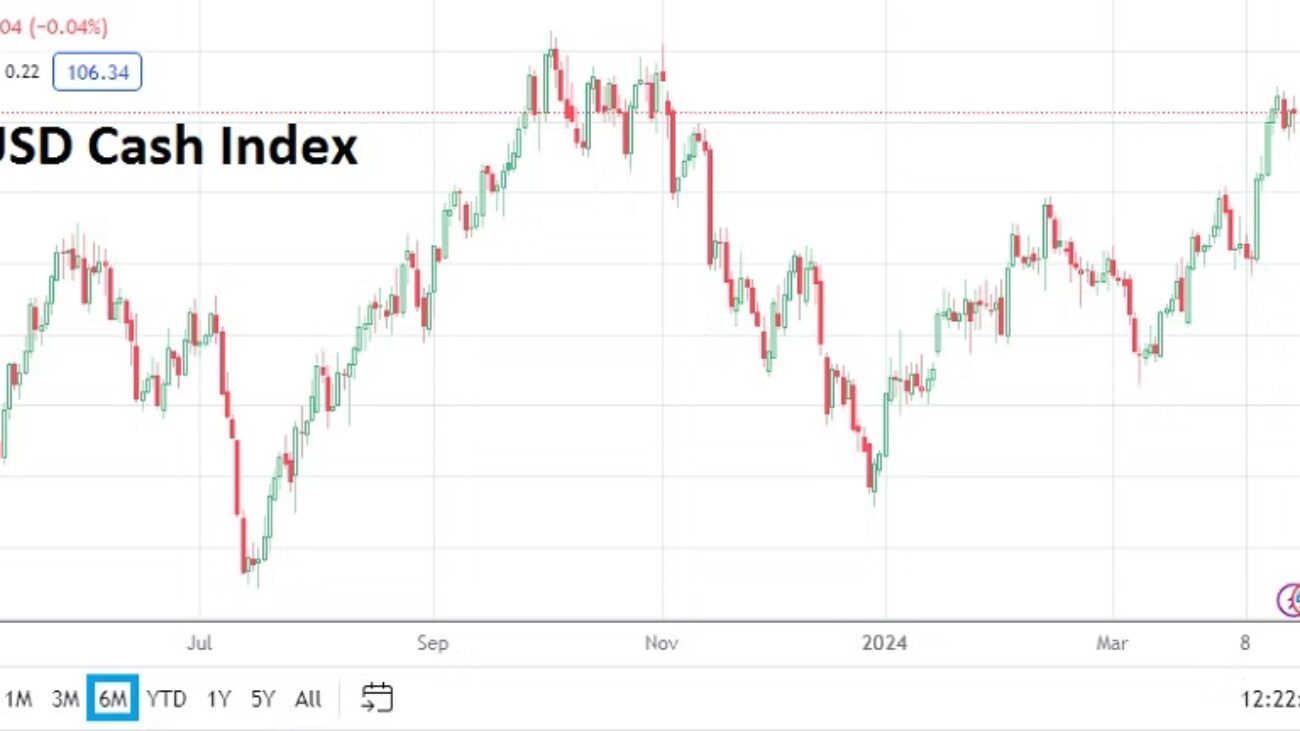
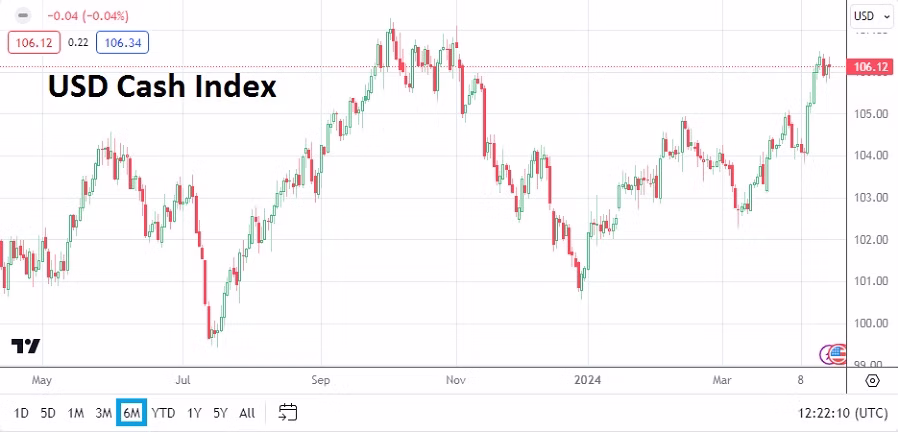
The USD Index has returned to early November 2023 values, and appears able to challenge late September and October prices if inflation data this week causes more volatility, which should put traders of major currencies like the GBP, EUR, JPY and others on full alert. After the USD spiked higher from the 10th to the 12th of April, Forex speculators have seen dynamic action incrementally flirting with stronger USD results the past week and a half.
USD Cash Index Six Month Chart as of 21st April 2024
Nervous trading continues to be seen in U.S equity indices. The Dow 30 and the Nasdaq 100 are fighting near ratios they touched in the last week of January. And the S&P 500 is traversing ground from the first week of February.
S&P 500 Three Month Chart as of 21st April 2024
Content
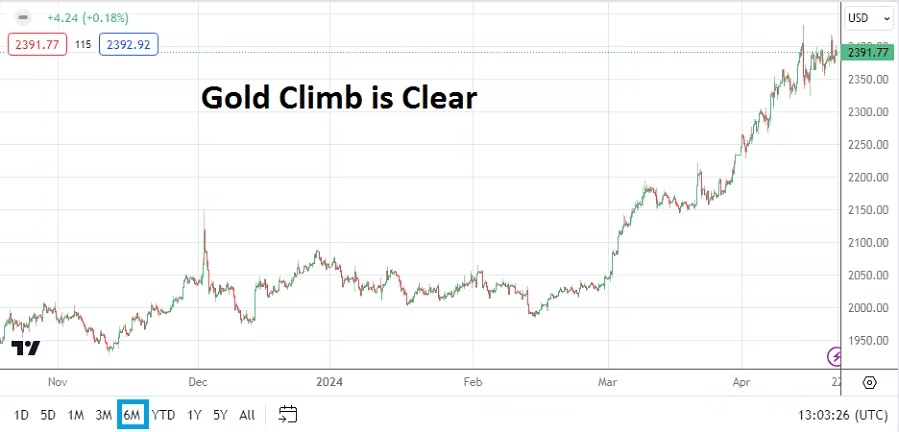
Gold Six Month Chart as of 21st April 2024
Gold remains speculatively high as its hovers near 2,400.00 USD per ounce. The price of the precious metal has not given back its gains made since the start of March and this is intriguing because of the ‘known’ USD inverse correlation, which had proven to work well with the precious metal over the past couple of years but has been stopped in its tracks for the moment. Technically Gold may look overbought, but geopolitical concerns and the prospect that some central banks may be strong buyers could be fueling the rather incremental gains. Retail traders of Gold need to be careful because price action is likely to produce more surprises.
Forex has been turbulent the past handful of months as shifting behavioral sentiment has created choppy conditions. This coming week contains large fundamental risk events via data releases traders should monitor. USD/JPY speculators will also have to contend with the Bank of Japan.
Monday, 22nd of April, China Loan Prime Rates – borrowing costs are anticipated to remain at the current benchmarks. China produced slightly better Gross Domestic Product results last week, but Industrial Production numbers were weaker. Consumers in China remain burdened by decreasing home values and concerns about the economy.
Tuesday, 23rd of April, European Union and U.K Manufacturing and Services PMI – E.U results via the PMI readings are expected to show slight improvements. However the readings from the United Kingdom are anticipated to come in flat. The EUR/USD and GBP/USD will be affected by the results, but the currency pairs will likely remain focused on U.S data later in the day.
Tuesday, 23rd of April, U.S Purchasing Managers Index – the Manufacturing and Services sectors are expected to produce slightly better readings than the previous month. These results will be interesting taking into consideration the Empire State Manufacturing Index numbers last week were bad. The PMI statistics will provide some impetus to the broad Forex market.
Wednesday, 24th of April, Australia Consumer Price Index – inflation data is anticipated to be higher than the previous month’s results. While stronger inflation is not something that will make consumers happy in Australia, stubborn price results may keep the AUD/USD slightly steadier. The currency pair is traversing values last seen in the second week of November 2023 as of this writing.
Thursday, 25th of April, U.S Advance Gross Domestic Product and Price Index – these numbers are certain to have an impact on all financial assets. A decline in growth is anticipated in the U.S compared to the previous month’s result, but the Price Index is expected to show an increase. Jerome Powell having come out last week and said inflation is causing uncertainty within the Federal Reserve, may have a bit of inside knowledge regarding this GDP inflation number and ‘tipped his hand’. If this inflation gauge is higher than anticipated it could pour fuel onto the already volatile USD. All Forex traders need to pay attention to these results and be prepared with solid risk management.
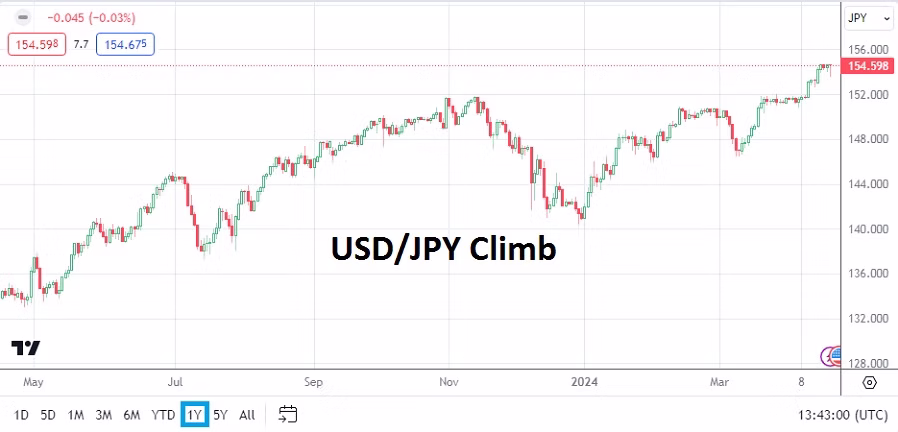
USD/JPY One Year Chart as of 21st April 2024
Friday, 26th of April, Bank of Japan – in what has already proven to be a couple of weeks filled with drama for the USD/JPY, the BoJ will step into the limelight. During their last central bank meeting the Bank of Japan increased the Policy Rate to 0.10%. It was the first time the BoJ hiked interest rates in 17 years. The USD/JPY is trading at values last seen in June of 1990. The Nikkei 225 has come off of recent record heights, but the famed Japanese stock index is also trading within territory seen in January of 1990. Business activity via the Core Machine Orders and the Tertiary Industry data last week were stronger than anticipated.
The Bank of Japan may want to maintain a weaker USD/JPY equilibrium to continue fostering domestic growth. However, many financial analysts have been calling on the BoJ to become more hawkish regarding monetary policy. The interest rate decision is certain to cause immediate volatility before and after the Policy Rate is made public. USD/JPY traders need to be prepared for fireworks. A slight raise of the interest rate seems to be needed, but after the March hike the BoJ may prove conservative again. The 34 year lows now being seen in the Japanese Yen are astonishing.
Friday, 26th of April, U.S Core PCE Price Index, and Inflation Expectations – the data from the government, and the reading from the University of Michigan will close the curtain on a big week of economic statistics for all traders. The USD will react to these outcomes. It should be noted the previous Inflation Expectations data from the University of Michigan caused a storm in Forex when it came with 3.1% gain.
Forex: Behind the Curtain as Speculative Deja Vu Strikes
Friday jobs reports came in stronger than anticipated on the surface, and this led to a roller coaster like ride for Forex traders as results were acted upon by financial institutions. However, a look behind the data shows ‘positive’ results were spurred on by part-time hiring and government influences leading to a notion that jobs numbers were not exactly a ray of sunshine regarding U.S economic health. The suspicious results cause a desire to look for ulterior motives, and to wonder if election year politics are playing a role in the U.S employment picture.
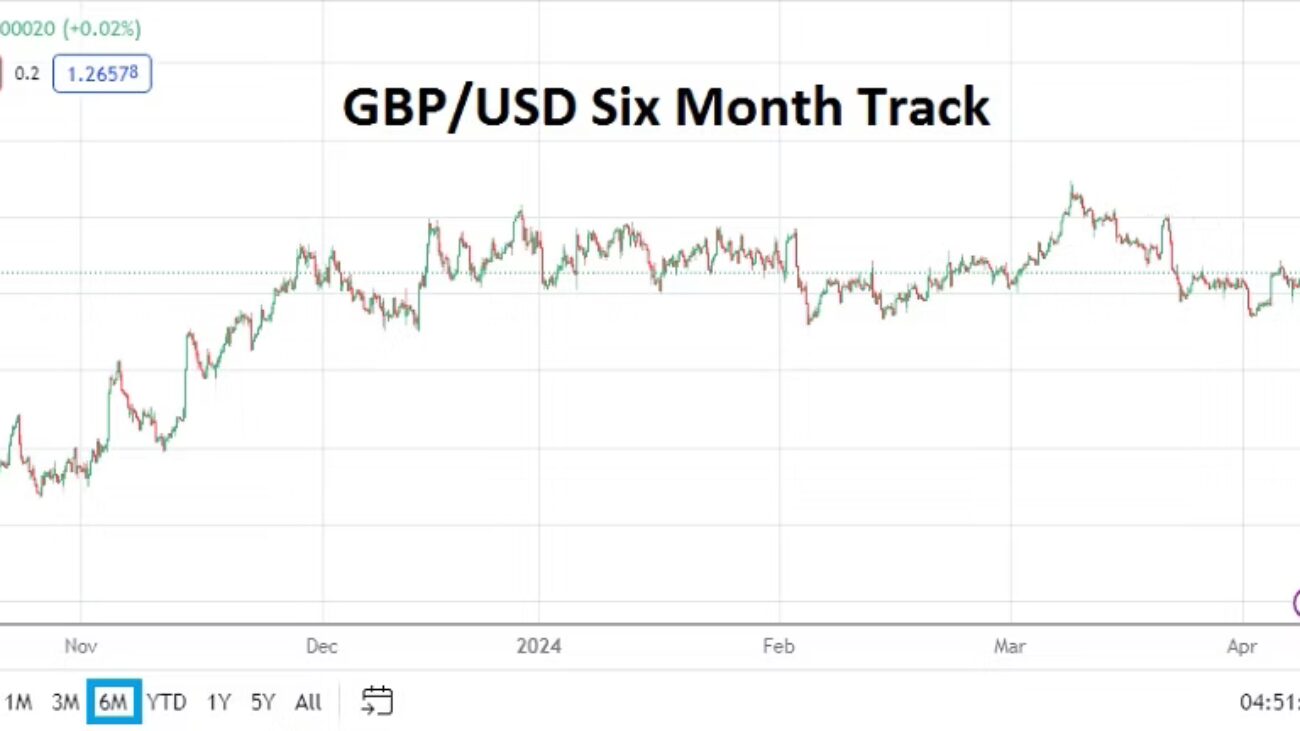
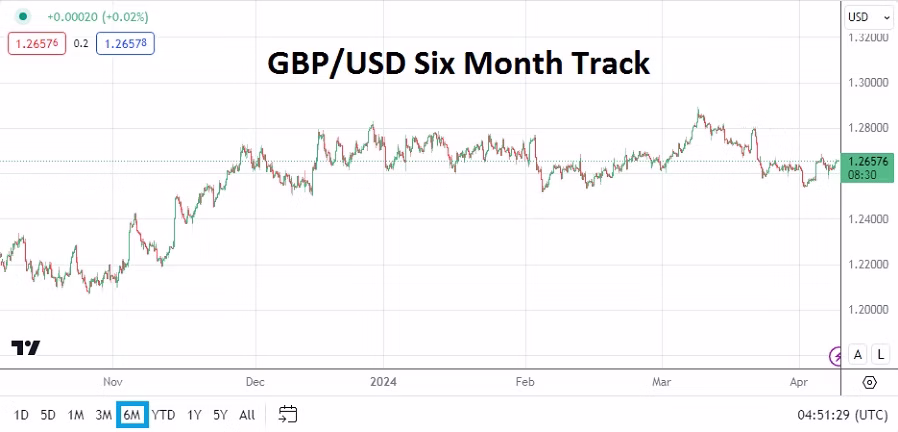
GBP/USD Six Month Chart as of 9th April 2024
The GBP/USD and EUR/USD are rather insightful for technical and fundamental traders. The currency pairs are languishing as of today’s values near pricing that was seen in the second week of December. Since the ‘announcement’ from the U.S Federal Reserve on the 13th of December that a change in monetary policy would begin to occur in 2024, in actuality nothing has really happened, except government ‘speak’ trying to sound as if everything is understood and in control, while it is clearly not.
Economic data from the U.S and Europe has continued to be soiled by mixed results, and retail speculators looking for a trend to emerge have had to deal with choppy conditions. Financial institutions remain unclear about interest rate outlooks. The Fed while trying to ‘sound’ dovish rhetoric remains locked within a Google engine keyword mantra as they mutter the phrase ‘over time’ when trying to convince people that interest rates will ‘eventually’ be cut.
Last week leading up to the Non-Farm Employment Change numbers, many FOMC members were offering cautious tones about the Federal Funds Rate and warning it should not be changed yet. The implication of the Fed’s verbiage could lead some to suspect they have all practiced statements handed to them by their overlords who are concerned this is an election year and jobs are in jeopardy.
EUR/USD Six Month Chart as of 9th April 2024
Which leads us back to Forex and all financial assets, as investors try to swim waters which have left fundamental perspectives grasping at data which is not easy to decipher. U.S government policy is practicing fiscal spending that is causing massive debts, and perhaps influencing hiring data which may be more akin to putting lipstick on a pig. Many U.S voters seemingly lean towards electing officials who promise to hand out the biggest ‘social rewards’, while ignoring there will be a price to be paid down the road.
The Federal Reserve in the meantime tries to sound optimistic about inflation eroding, but concerns due to U.S government debt being accrued, and global geopolitical affairs combined with energy policy which is making it more expensive to maintain cheap transportation, efficient agriculture and manufacturing, shadow the Fed’s hopes. WTI Crude Oil remains over 86.00 USD per barrel. Gold is trading at record high values and above 2300.00 USD. Does anyone see the dangerous connections? Equity indices should be watched as a barometer this week.
USD/JPY Six Month Chart as of 9th April 2024
Monday, 8th of April, Japan Average Cash Earnings and Economic Watchers Sentiment – yesterday’s reports matched expectations regarding wages, but workers surveyed noted their concerns about incremental inflation which is being seen in Japan. The USD/JPY is challenging November higher values and the Bank of Japan has been widely criticized for not raising interest rates more aggressively. However, it is possible the BoJ wants the Japanese Yen to remain within its weaker price range to spark a stronger Japanese economy via exports.
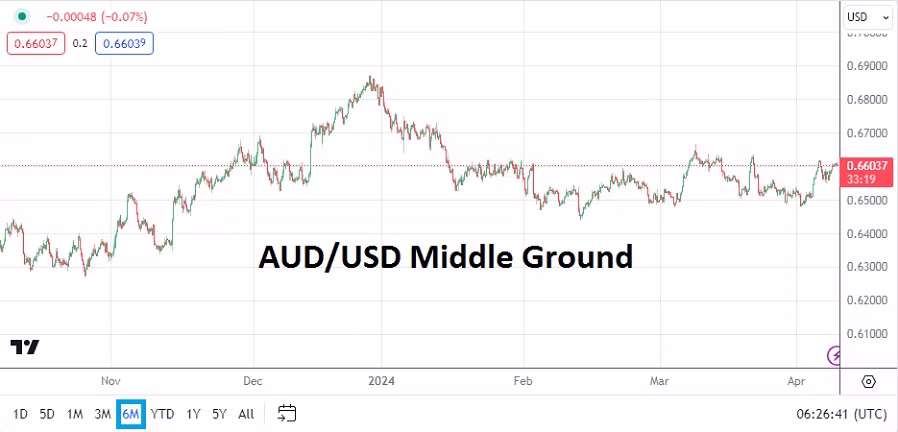
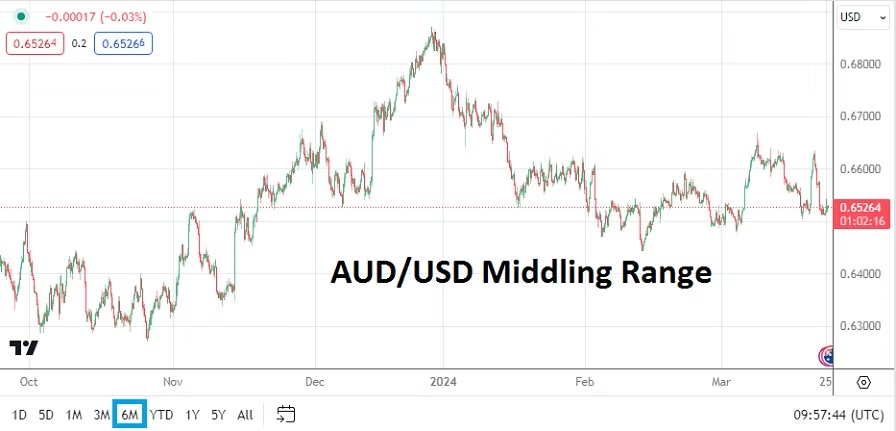
AUD/USD Six Month Chart as of 9th April 2024
Tuesday, 9th of April, Australia Westpac Consumer Sentiment – the results via the consumer reading came in negative. The AUD/USD like the GBP/USD and EUR/USD is traversing values tested in the second week of December 2023, leading to the feeling of deja vu.
Wednesday, 10th of April, U.S Consumer Price Index – you have heard this before, the inflation reports from the States are going to rattle the financial markets including Forex. The USD is certain to react. Data from the U.S has produced surprises aplenty in the past few months. The Consumer Price Index is important and day traders certainly need to pay attention.
Thursday, 11th of April, European Central Bank – the ECB is not expected to change its Main Refinancing Rate, but many analysts believe they should cut borrowing costs. However, the ECB will likely remain within the camp of choosing to ‘wait and see’. The ECB Press Conference with Christine Legarde has widely become regarded as an opportunity for political speech as much as an economic dialogue. Recent data from the European Union suggests the worst of the recessionary cycle is gone, but German Trade Balance numbers released on Monday were negative, highlighting hurdles remain. Inflation is a worry, and a cut to the interest rate might be able to help spur on economic activity while counting on lagging data to prove proactive policy should be implemented. But this likely is not going to happen and the EUR/USD will remain problematic.
Thursday, 11th of April, U.S Producer Price Index – these slew of reports should be watched carefully. If the data is stronger than expected it is likely a part of the residue caused by higher energy costs that have affected logistics and created more expensive raw materials which are needed to produce goods. It was the higher PPI reports last month that caused dramatic tidal shifts in Forex, speculators should brace for the potential of additional mayhem.
Friday, 12th of April, U.K Gross Domestic Product – last month’s GDP numbers from Great Britain came in slightly higher than expected with a 0.2% gain, this report is anticipating growth of only 0.1%. Traders should take a deeper look at the statistics upon publication and check for revisions to past months. The U.K economy has been struggling, the ‘growth’ results will affect the GBP/USD before going into the weekend.
Forex Volatility and Coming Data Attractions for this Week
Nervous trading results have hurt many day traders and likely financial institutions too, as behavioral sentiment in Forex gets blindsided by rather mixed U.S data and the Federal Reserve not giving a definitive answer regarding monetary policy. The violent trading in the USD last week was expected, but the turbulence that many Forex pairs experienced on Thursday and Friday of last week was rather vicious. For all the perceived sophistication of Forex markets via financial institutions, the trading results last week point to a definite fear of the unknown.
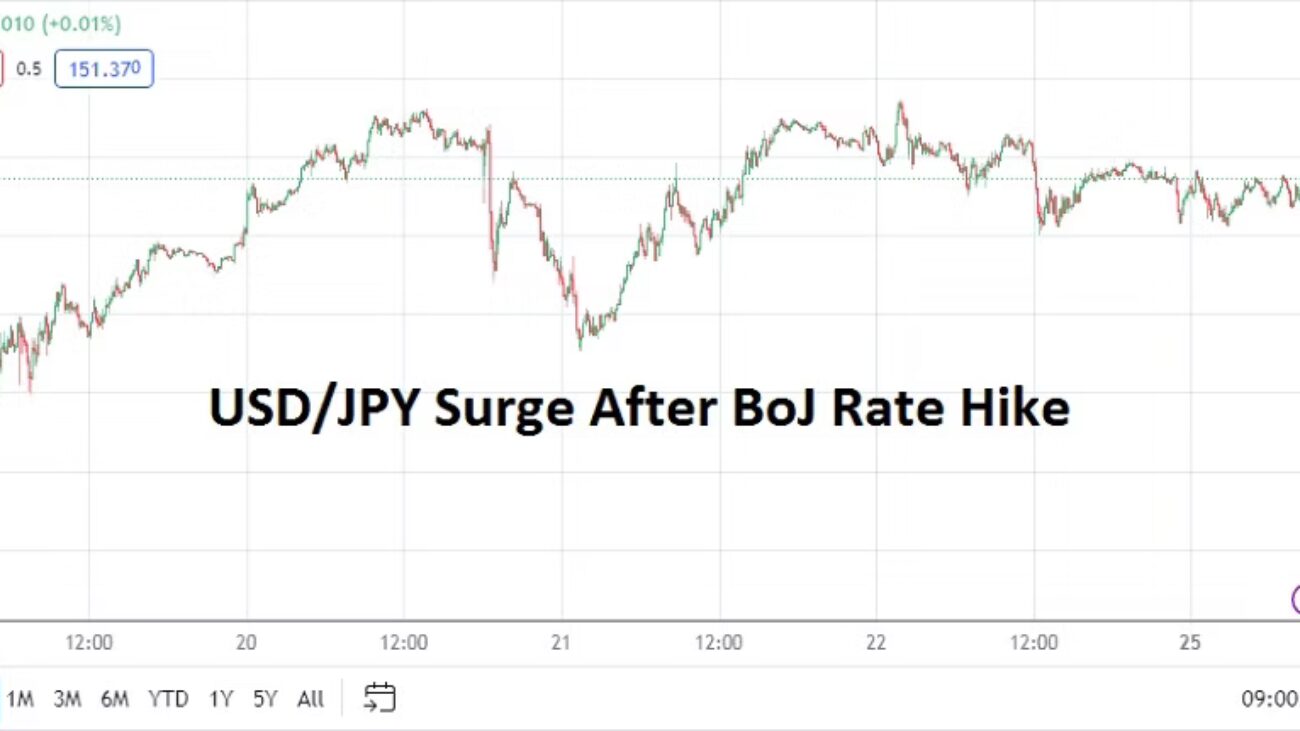
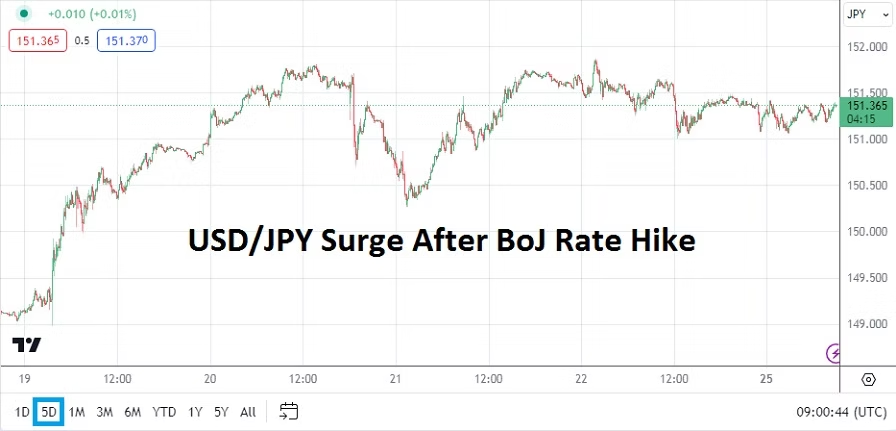
USD/JPY Five Day Chart as of 25th March 2024
While the Bank of Japan finally changed its interest rate policy and moved to a Policy Rate of 0.10% early last week, this did not create selling momentum in the USD/JPY. The Federal Reserve’s dangling of potential interest rates to come this year caused temporary weakness in the USD, but as financial institutions and their clients looked at the prospects for a more dovish Fed they apparently became unimpressed as the days passed.
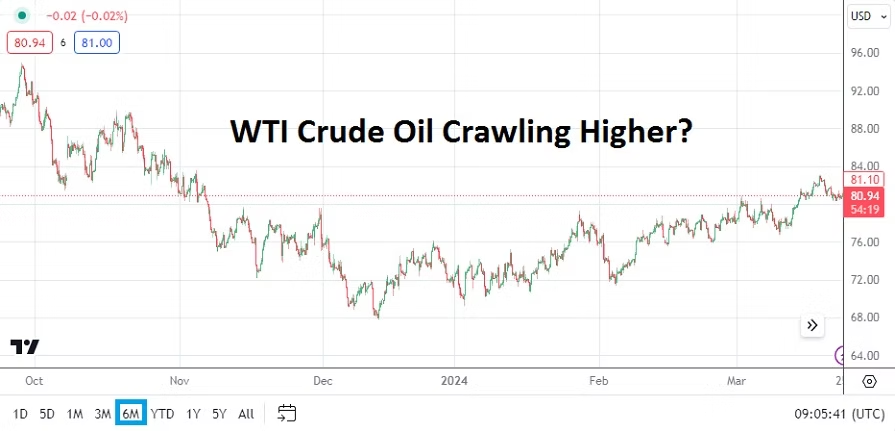
WTI Crude Oil Six Month Chart as of 25th March 2024
The Fed seems to be betting on weaker jobs numbers developing, and there has been data which points to part-time jobs increasing, and full-time jobs becoming harder to find in the States. Jerome Powell said last week that if jobs numbers start to show weakness that the Fed would be willing to begin cutting interest rates even if inflation remains sticky. Lagging economic data correlations have not eased the Fed’s problems.
The Fed has also admitted inflation in housing, transportation and food remains problematic. WTI Crude Oil spent much of last week above 80.00 USD per barrel as its price has begun to show signs of rising incrementally again; and there is little the Fed can do about more expensive energy costs should they be seen. Higher costs for logistics will not make anything cheaper. Pricier mortgages, more expensive rent and insurance rates for cars and gasoline is creating serious knock on effects.
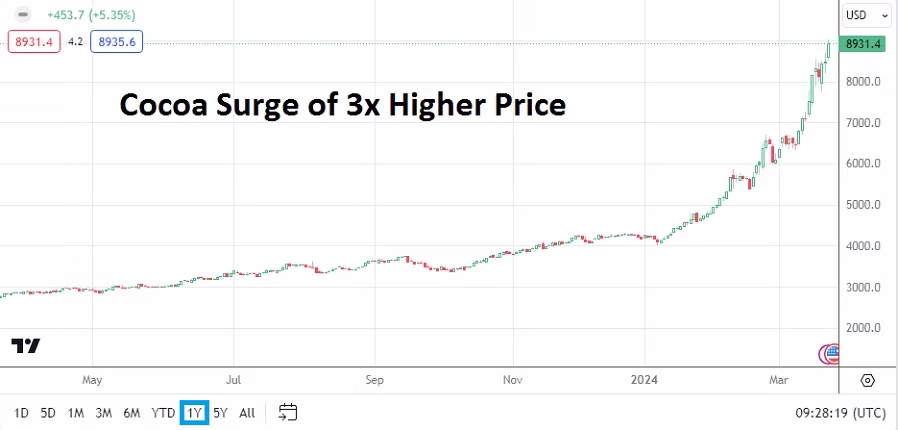
And for the sake of acknowledging the screaming prices in Cocoa, please have a look at the chart below which should explain why your chocolate products are going to be more expensive in the coming months. The price of the most delicious commodity in the world has tripled in less than a year’s time and is around 8931.0 USD per metric ton as of this writing.
Cocoa One Year Chart as of 25th March 2024
Gold turned in a violent week of trading too as it reached 2224.00 last Wednesday, only to fall back to a known value around 2165.00. Day traders are dealing with violent cycles in Forex because sustained trends have been nearly impossible to find. While U.S equity indices are fighting upwards, speculators who are afraid of heights are likely being cautious if they are betting merely on the daily results from the S&P 500, Nasdaq 100 and Dow Jones 30 instead of investing for the long-term.
This week’s coming data from the U.S is important, financial institutions are already dealing with plenty of noise, and they will have to be careful regarding their interpretations regarding the coming economic statistics. Meaning day traders who are speculating in all financial assets should use risk taking tactics that are planned significantly in advance.
Monday, 25th of March, U.S New Home Sales – a slight gain is expected, but mortgage rates continue to shadow the housing sector and cause concerns.
Tuesday, 26th of March, U.S Consumer Confidence via the Conference Board – the reading is anticipating a slight increase. Consumer numbers from the U.S have come in mixed recently. A stronger result than estimated might not be welcomed by traders with bearish sentiment regarding the USD. The Fed wants its cake and to eat it too, they would like to see weaker consumer numbers and a soft economic downturn. If U.S shoppers remain confident this could help sustain inflation. It should be noted too, that Core Durable Goods Orders data will be released one and a half hours before the Consumer Confidence numbers.
AUD/USD Six Month Chart as of 25th March 2024.
Wednesday, 27th of March, Australia Consumer Price Index – inflation numbers are expected to come in slightly higher than the previous results. Like most other central banks, except for the BoJ, the Reserve Bank of Australia would enjoy seeing inflation erode. The AUD/USD will react to the results certainly, but the price action might prove complicated because of USD centric notions.
Thursday, 28th of March, U.S GDP, Weekly Unemployment Claims, Pending Home Sales, and Revised Consumer Sentiment from the University of Michigan – put bluntly day traders will have to be well prepared for the combination of data from the States. Spectators who do not have large trading accounts and cannot take on a great amount of risk, should seriously consider sitting on the sidelines until most of the data is published. The GDP numbers will be watched carefully, while they are expected to match last month’s total, any surprises will affect the USD immediately in Forex. Weaker growth numbers might cause USD sellers to ignite positions.
However, before traders react too much to the Gross Domestic Product numbers, the Weekly Unemployment data will also impact the financial market. Financial institutions are anticipating a higher amount of unemployment claims this week. Also, at the same time as the growth and jobs numbers, the Final GDP Price Index numbers will be brought forth. The mixture from these reports could cause speculative whiplash.
The housing sector numbers and consumer numbers which come one and a half hours later will finish off a very big day for traders and institutional investors. The wide array of data could make this coming Thursday rather loud, and again rather dangerous for retail traders to participate.
Friday, 29th of March, Japan’s Tokyo Core Consumer Price Index – the inflation numbers are expecting to show a slight decrease to 2.4%. The result should certainly be watched by USD/JPY and GBP/JPY traders. If the number were to come in higher than expected, this could cause additional volatility for the Japanese Yen. Financial institutions seemed to indicate last week they would like to see the BoJ become more aggressive with their Policy Rate.
Friday, 29th of March, U.S Core Personal Consumption Expenditures Price Index – the reading is expected to be below the previous month’s total. Traders should be on the lookout for revisions to past results. Financial institutions know this inflation number is important for the Federal Reserve, but they are concerned the U.S central bank doesn’t have the ability to combat inflation which is not part of the Core number. Energy and food costs which are hurting U.S consumers are not part of this report and likely making the Federal Reserve gun shy regarding monetary policy – which has caused a large part of the USD whipsaw trading results that Forex has experienced.
Risky Outlooks: Central Banks and Inflation Colliding
Most traders and investors begin their pursuit of financial assets with an optimistic perspective. However, the markets and ability to speculate also allows those who have other outlooks to equally participate. The past week once again delivered U.S inflation data which was not anticipated. While last Tuesday’s CPI results came in slightly stronger than expected, it was Thursday’s PPI which provided surprises for many.
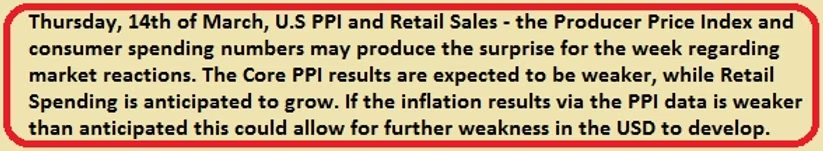
Producer Price Index Warning from AMT for the 14th of March 2024
Yet, some market participants may not have been utterly shocked by the results. Perhaps it was lucky to ‘guess’ the PPI numbers could cause volatility last Thursday, but the ability to be alert and attentive to the possibility of risk should not be ignored. Risk management is important for all traders.
This coming week will continue to be intriguing for day traders as they try to sail through speculative waters which are going to deliver shifting behavioral sentiment tides. A parade of central banks are ready to step into the limelight and they will focus on the word: inflation. Technical traders who wager on support and resistance levels in the coming days should not be scorned, because sideways and volatile trading results are likely.
U.S equity indices began to struggle the middle of last week, Gold has traded lower and Treasury yields have ticked upwards in recent market action, this as sentiment has again had to acknowledge economic outlooks remains problematic. Trading decisions this week will depend not only on what the central banks say and ‘do’, but also focus on the duration that a speculative position intends to be working.
Monday, 18th of March, China Industrial Production – a gain of 7.0% has beaten the expectation per the data already published this morning. Retail Sales numbers came in slightly below estimates, but Fixed Asset Investment numbers were better than anticipated. However, China’s data remains troublesome and the economic path ahead for the nation must overcome deflation and trust issues from international investors. A lack of confidence from the Chinese public about the value of Real Estate and the over abundance of available property is causing major headwinds economically.
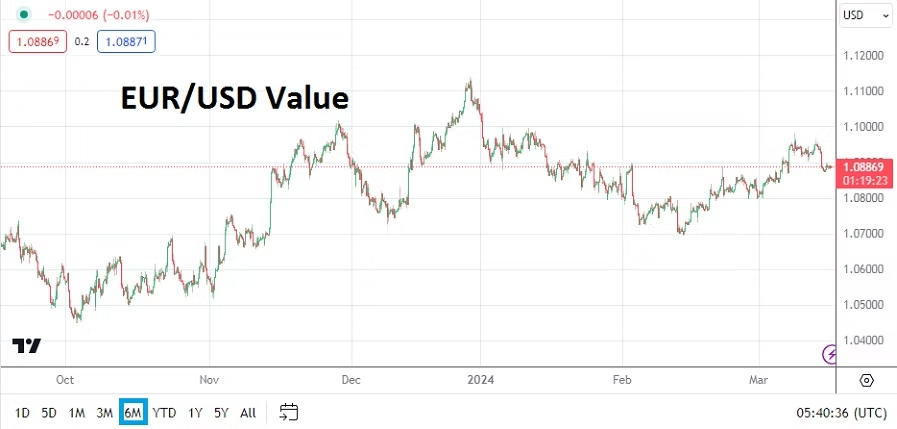
EUR/USD Six Month Chart as of 18th March 2024
Monday, 18th of March, E.U Final Core Consumer Price Index – the European Union will release crucial inflation data. An expected gain of 3.1% is the estimate. While this data release is not considered vital by many investors, the inflation statistics should be watched. The EUR/USD has produced mixed results the past four months as shifting behavioral sentiment due to battling perceptions regarding central bank policy outlooks converge.
USD/JPY Six Month Chart as of 18th March 2024
Tuesday, 19th of March, Bank of Japan – the BoJ will deliver their Monetary Policy Statement and Policy Rate. While no numerical change is expected from the BoJ, signs for a change in rhetoric will be looked for as central bank observers try to read the tea leaves. The Japanese economy is within an intriguing spot, there have been signs of improvement, but the Bank of Japan is likely to remain on a conservative path regarding negative interest rates for the moment. The USD/JPY remains within the higher realms of its price range as the currency pair grapples with global inflation outlooks.
AUD/USD Six Month Chart as of 18th March 2023
Tuesday, 19th of March, Reserve Bank of Australia – the RBA is expected to parrot the pronouncements of the other central banks as they point to stubborn inflation and ‘improving yet lackluster’ economic outlook. Trading in the AUD/USD has been choppy and the volatility is likely to continue within the known price range.
Tuesday, 19th of March, Canada CPI – the Consumer Price Index data is anticipated to show inflation remains remains sticky in the ‘Northern Tundra’. The CPI report from Canada should be monitored because of the strong relationship between the U.S and Canadian economies. The USD/CAD will react to any surprises.
Wednesday, 20th of March, U.K Consumer Price Index – yet another important inflation report. Great Britain has been a ‘poster child’ regarding stagflation. The ugly word is not something central banks, nor governments want to discuss, but the simple truth is that problematic inflation and limited growth equal stagflation. The statistics from the U.K should be examined. The economic health of Great Britain is often a solid reflection of global conditions.
Wednesday, 20th of March, U.S Federal Reserve – the Federal Funds Rate, FOMC Statement and Fed Press Conference will be focal points for investors. Except importantly, not much is likely to be said be Jerome Powell that isn’t known already. Inflation reports from the U.S have highlighted stubborn higher prices. U.S economic numbers regarding manufacturing and consumer confidence have started to turn lower, but the Fed is not going to change its policy this week. Talk about ‘becoming’ dovish will be heard, but the U.S central bank still wants to see more proof that inflation can erode before they start to cut interest rates in the mid-term.
Thursday, 21st of March, E.U Manufacturing and Services PMI, readings will come from France, Germany and the U.K via the Purchasing Managers Index results. Most of the data will likely continue to point to lackluster outlooks, only the Services PMI from the U.K is expected to offer a glimmer of hope regarding ‘expansion’. If the Flash numbers come in worse than expected this could cast a shadow over behavioral sentiment for European investors.
GBP/USD Six Month Chart as of 18th March 2024
Thursday, 21st of March, Bank of England – the BoE is likely to keep its Official Bank Rate within place and their pronouncements via the Monetary Policy Summary may sound like a replica of the U.S Federal Reserve. Inflation and growth will be spoken about and the BoE will try its best to paint an optimistic picture. The GBP/USD will react to the gyrations, but the range of the currency pair will have already seen tests in the preceding days. The past four months have produced a value as of the 18th of March, that is hovering slightly above late November and early December 2023 prices.
Friday, 22nd of March, U.K Retail Sales – a negative result of minus -0.3% is expected. The retail data will certainly be watched, but following the massive week of central bank statements and data which have already been published, this number may prove to be rather anti-climatic unless there is a massive surprise.
Friday, 22nd of March, E.U ECB and U.S Fed – Officials from both central banks will engage in a variety of speeches in Europe and the U.S, but again after the week’s worth of central bank rhetoric which has been heard, investors are unlikely to react much to these soundbites from members of the European Central Bank and Federal Reserve. Existing behavioral sentiment which has been produced in the dynamic days beforehand should remain the central theme as investors go into the weekend.
Interest Rates, Fireworks, OPEC, Fed Minutes, and Jobs Data
Global day traders will certainly be able to work early this week, but they should note the 4th of July holiday in the U.S will deliver rather light volumes Monday and Tuesday. Markets in the U.S will be open on the 3rd, but speculators need to understand that price action may be flat and then experience sudden bursts of energy. Financial institutions in the U.S could be rather quiet until Wednesday.
Monday, the 3rd of July, European Manufacturing PMI – data will come from across Europe and is expected to show the sector remains rather lackluster. France, Germany, the U.K and others will issue reports.
Monday, the 3rd of July, U.S Manufacturing PMI via the ISM – the Purchasing Managers Index numbers are expected to produce a slight rise, but remain under the level of 50. However, any increase compared to last month’s outcome will be an additional sign the U.S economy is battling on and would give the U.S Federal Reserve another reason to lean towards an interest rate hike later this month.
AUD/USD One Month Chart as of 2nd July 2023
Tuesday, the 4th of July, Australia RBA Cash Rate and Statement – while some analysts assume no interest rate hike will be delivered in July because the CPI has shown a slight downturn, there seems to be rather large whispers another hike of 0.25% could be added from the Reserve Bank of Australia. AUD/USD traders certainly need to pay attention, and folks with limited funds should stay on the sidelines until the decision is released.
Tuesday, the 4th of July, U.S Independence Day – banking holiday.
Wednesday, the 5th of July, China Caixin Services PMI – economic data from China has certainly shown signs of downward pressure. A slight decrease is the expected result.
Wednesday, 5th of July, OPEC Meetings – the energy cartel will be conducting its official get together in Vienna, Austria and oil traders should be on alert for any news and decisions made public that could affect the energy sector.
Wednesday, 5th of July, U.S FOMC Meeting Minutes – the publication will provide insights into the Federal Reserve’s decision to ‘pause’ interest rate hikes last month, but could also add fuel to the notion the U.S central bank remains within an aggressive stance regarding inflation. Forex markets will react to the report.
Thursday, 6th of July, U.S Services PMI via ISM – the statistics will be monitored closely due to the rather positive outcome from the GDP report last week, which showed the U.S economy remains rather resilient. A positive outcome in the Services numbers will add further evidence for the Federal Reserve to remain hawkish.
Friday, 7th of July, U.S Jobs Numbers – the employment data will culminate as the week comes to an end with the Non-Farm Employment Change and Average Hourly Earnings figures. Yes, on the day before, Thursday, traders will also see the JOLTS numbers and weekly Unemployment Claims. However, it is the Non-Farm and wages data that financial institutions will largely react upon depending on the outcomes. Because it is a ‘holiday’ week in the U.S, the reports may find a muted response, but financial institutions will use the information to gauge their mid-term outlooks and position their assets including Forex and bonds.
Week Ahead: Summer Begins with Questions Lurking for Traders
Monday, the 19th of June, China Foreign Direct Investment – data from China has been lackluster and last week’s announcement of a stimulus program from the government underscores economic concerns regarding growth.
Monday, the 19th of June, U.S banking holiday – for commemoration of Juneteenth.
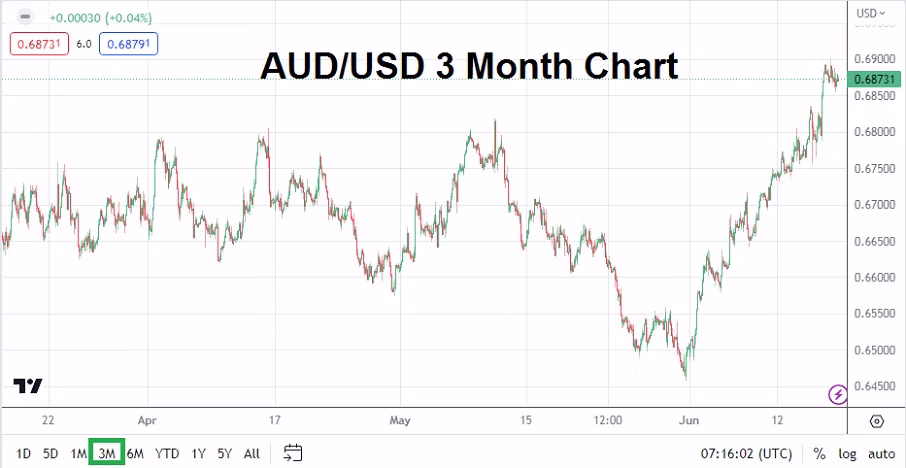
AUD/USD Three Month Chart as of 18th June 2023
Tuesday, the 20th of June, Australia Monetary Policy Meeting Minutes – report from the Reserve Bank of Australia will interest AUD traders and those with an interest in Asian Pacific economics.
Tuesday, the 20th of June, U.S FOMC member John Willliams – as the President of the New York Federal Reserve, Williams, is a key member regarding policy. Taking into consideration last week’s pause, traders may want to pay attention to the New York Fed Presidents’s remarks to see if the pause in Federal Funds Rates seen last week is looked upon as a halt or a ‘skip’ by Williams. The difference between a pause and a skip may appear to be semantics, but a skip would mean an interest rate hike is coming in July. Williams is not going to say what is going to happen at the next Federal Reserve meeting, but he may give a hint regarding his opinion on what should be done.
GBP/USD Three Month Chart as of 18th June 2023
Wednesday, the 21st of June, U.K Consumer Price Index – the data will be important regarding inflation insights for Britain. The Bank of England is expected to raise their Official Bank Rate on Thursday by 0.25%. Another report showing stubborn inflation could set the table for a rather hawkish Monetary Policy Statement from the BoE.
Wednesday, the 21st of June, U.S Federal Reserve Chairman Powell testimony – the Fed Chairman will begin two days of speaking and taking questions. The first day will be before the House of Representatives and the second day in front of the Senate. Because a major election is coming in the U.S in 2024, this will be an opportunity for politicians from both sides of the aisle to get airtime and take a ‘stance’ while bludgeoning Jerome Powell. The Fed Chairman’s remarks could stir the markets slightly, but Powell will be as careful as possible not to put a scare into the financial sector.
Thursday, the 22nd of June, U.K Bank of England – the Official Bank Rate, Monetary Policy Summary and vote count from the Monetary Policy Committee will be released. A hike has been widely expected by GBP traders and has been factored into the British Pound already.
Thursday, the 22nd of June, U.S Existing Home Sales – the housing report will cause a few murmurs in the marketplace because it is seen as an extension of consumer health and interest rate policy in the U.S regarding behavioral sentiment. Existing home sales numbers have been dropping as people with homes have decided to stay put in their current residences. ‘Locked in’ interest rates are more attractive, instead of taking on a higher rate via a new purchase due to costlier mortgages because of more expensive borrowing fees.
Friday, the 23rd of June, E.U Manufacturing and Services PMI – the flash reports from the likes of Germany, France and the U.K should be watched. Manufacturing readings have been producing recessionary readings while Services data is expected to show incremental decreases too.
Friday, the 23rd of June, U.S Manufacturing and Services PMI – the flash reports via the Purchasing Managers Index data need to be monitored too from the States. The readings give a rather good insight regarding outlook of U.S business sentiment.