postR183.1

Nervous? Central Banks Cautious, FX and Asset Equilibrium

Nervous? Central Banks Cautious, FX and Asset Equilibrium

Sometimes when looking for ideas regarding a risk analysis article it is difficult to find a timely subject. Exaggeration is often used to grab attention. This week and next will not be one of those times. Equities, Forex and commodities have produced nervous results since last Monday. The broad markets appear to be in search of equilibrium, but price velocity while higher than normal hasn’t produced a volcanic surge of pain. Financial institutions were presented less than inspiring jobs data this past Friday and day traders hopefully had their risk management working. Everyone will need to be paying attention this week too.

Gold One Month Chart as of 9th Sept. 2024

Gold has hovered around the 2,500.00 level and while it certainly is a short-term speculative asset for day traders, the precious metal also serves as distinct barometer of behavioral sentiment and long-term guidance regarding inflation. Recent economic data has created concerns in financial institutions about the potential for a stronger than anticipated U.S downturn. The volatility and sell off in equity indices last week is a clear sign investors would like the Federal Reserve to be more aggressively dovish.

This coming week is packed with a variety of risk events which will keep all market participants engaged. Long-term investors may feel calm as they rely on their outlooks which extend over a handful of years, but anyone who needs a firm grasp on short and mid-term viewpoints might not be comfortable. It is important not to cry wolf too often, but based on the trading results seen the past week it is worthwhile to point to the turbulent outcomes and issue a warning that more volatility could develop.

Nasdaq 100 One Month Chart as of 9th of Sept. 2024

Some analysts may apply the thought that what we have seen was profit taking, and this can certainly be debated. The coming two weeks have plenty of noteworthy events on the calendar. Besides the listed risk highlights noted below, the Fed will release its FOMC Statement on Wednesday the 18th, the BoE will follow on the 19th and not to be outdone the Bank of Japan will step onto center stage on Friday the 20th of September.

While long-term investors likely believe all variables will return to known price realms and that central banks sooner or later will fall into their proper places regarding monetary policy, day traders who are gambling on short-term momentum must try to figure out where behavioral sentiment is leaning. One of the ways speculators without deep pockets can put the odds in their favor concerning potential profits, is to make sure they are practicing rock solid risk management and not stepping into Forex trades, equity indices via CFDs wagers, and commodities bets when they are displaying rough conditions without being prepared.

Monday, 9th of Sept., China Consumer and Producer Price Index – the inflation reports from China both came in below their estimates earlier today. While some may believe that less inflation than predicted is a good thing, it isn’t when the economy is suffering from deflationary pressures. Lackluster spending from consumers in China continues to highlight negative sentiment about prospects for growth. The USD/CNY is near the 7.1125 ratio as of this writing.

Tuesday, 10th of Sept., U.S Presidential Debate – while not an economic data event, investors might want to pay attention to the answers given by Vice President Kamala Harris and former President Donald Trump. The race for the White House appears to be close according to various polling. It could prove interesting for financial institutions if Harris is questioned about her ideas regarding taxing unrealized capital gains.

USD Cash Index One Month Chart as of 9th Sept. 2024

Wednesday, 11th of Sept., U.S Consumer Price Index data – the inflation reports will certainly get the attention of financial institutions. If the annual CPI report comes in weaker than the previous outcome, this could spark more USD centric weakness in Forex. All asset classes will react to the inflation numbers because they are likely to play a major part in the Fed’s FOMC decision in one week’s time. The USD Cash Index is still lingering near lows, but for it too resume a more bearish trajectory, financial institutions will need to believe the Federal Reserve is going to become increasingly dovish.

EUR/USD One Month Chart as of 9th Sept. 2024

Thursday, 12th of Sept., European Central Bank Main Refinancing Rate – The ECB is definitely going to cut its prime borrowing interest rate, the question is how much of a haircut they are going to provide. A 0.25% cut has certainly been traded into the EUR/USD, but many financial institutions believe there is a possibility to see a 0.50% basis cut. Can the ECB and Christine Legarde be aggressive? The European Union remains under recessionary pressures and inflation data is starting to show signs of erosion. The amount of the interest rate cut from the ECB will also be a telltale sign regarding what will happen via the Federal Reserve on the 18th of September. The EUR/USD will react to the European Central Bank’s decision, and global assets in far off places may react too because behavioral sentiment among investors may shift according to the rhetoric provided. Prediction: The ECB will stay cautious and cut by 0.25%, while saying a November rate cut is likely if economic data remains under pressure. Having said the above, the ECB should cut by 0.50% this Thursday, if they do not – financial institutions will not be pleased unless ECB President Legarde sounds very dovish during her Press Conference.

Thursday, 12th of Sept., U.S Producer Price Index – more inflation data from the U.S will provide investors an other opportunity to glance into the Fed’s looking glass. But if these PPI numbers meet or are near the anticipated results, financial institutions may be reacting to the ECB’s rate decision more because they might believe it is a better clue regarding the Fed’s Federal Funds Rate decision which will come in a handful of days.

USD/JPY One Month Chart as of 9th Sept. 2024

Friday, 13th of Sept., Japan Revised Industrial Production – this number may not get much attention, but because the Bank of Japan will release its Policy Rate on the 20th, the outcome could impact existing sentiment in the USD/JPY. The Japanese Yen has continued its bearish trajectory and traders who are wagering on more downside should not bet blindly on selling positions because intraday trading remains very choppy. The USD/JPY is now touching values last seen in a sustained manner in early January of 2024, lower values were seen in December 2023, and lower ratios that traversed the 138.000 realm and proved choppy occurred in the spring of 2023.

Saturday, 14th of Sept., China New Home Prices, Retail Sales, Industrial Production – this parade of data from the nation will be important. Foreign investors remain concerned about China’s economic prospects. The deflationary winds that have been blowing in the Asian giant have been well documented. The results from these three reports are expected to be lackluster.

postR161.1

Market Trading Risks: Speculative, Anxious Impatient Results

Market Trading Risks: Speculative, Anxious Impatient Results

Monday’s trading provided a solid oversight for day traders to observe market conditions in commodities, Forex and equities. Financial institutions appear to be leaning towards a belief the U.S Federal Reserve will have to become more dovish, but financial institutions and other large players are worried about shadows being caused by inflation concerns and timeframes which are likely sparking nervous wagers.

Via the commodities, results saw Gold come down from highs on Friday which approached the 2,380.00 USD perch, and drop to lows around 2333.00 yesterday. The precious metal remains within sight of record values, this as questions persist about USD direction, and speculative forces bet. WTI Crude Oil meanwhile climbed from a selloff late Friday and into yesterday’s opening while challenging the 77.75 USD vicinity, and as of early Tuesday is now over the 79.00 mark again.

Also within the volatile world of commodities it needs to be mentioned that Cocoa which regained a portion of its higher price values last week and finished Friday above 9,000.0 USD per metric ton, fell swiftly in yesterday’s trading session and is now traversing 7,357.0 USD. Cocoa has enjoyed a spectacularly wide ride of maneuvering via market forces. The commodity is still valued within loftier heights when compared to its historical averages, and demonstrates the speed and danger (and opportunity) of price velocity.

Cocoa Three Month Chart on the 14th of May 2024

Further signs of risk appetite and fragile notions are being exhibited via U.S equity indices, which produced sideways price action yesterday as important economic data awaits and will certainly churn short-term and mid-term perspectives. The S&P 500 is again within sight of record levels, while investors of it and the Dow Jones 30 and Nasdaq 100 all brace for this week’s data which will affect their risk outlooks.

S&P 500 Index Three Month Chart on the 14th of May 2024

Monday, 13th of May, New Zealand Inflation Expectations – yesterday’s quarterly result came in slightly below the previous report. The decrease of inflation concerns likely helped the NZD/USD spark Monday’s climb above 0.60300 briefly. This morning’s early trading is seeing sideways action as U.S inflation reports are anticipated and the currency pair ebbs around 0.60180.

GBP/USD Three Month Chart on the 14th of May 2024

Tuesday, 14th of May, U.K Average Earnings Index, a gain of 5.7% has just been posted. This result will make GBP/USD traders nervous because it highlights that inflation remains sticky in Britain. While last week’s GDP numbers from the U.K showed an improvement, the growth certainly was not spectacular. The range of the GBP/USD remains choppy and bullish day traders targeting higher ratios on the belief the currency pair remains in oversold territory need to consider their timeframes and bias. While the 1.26000 may look like a logical target, it will take weaker U.S inflation and USD centric price action to get there.

Tuesday, 14th of May, U.S Core Producer Price Index – last month’s core report matched expectations. However, the PPI numbers occasionally spell trouble in Forex. Higher inflation results from the U.S would certainly kickstart volatility for all major currency pairs today.

Wednesday, 15th of May, U.S Consumer Price Index – this reading could prove to be the prime mover for financial assets this week because of its potential affect on behavioral sentiment. The Federal Reserve watches this number because of the influence it has on the American public. Forex will react to this report and if it is weaker than anticipated this would create weaker USD centric price action. The U.S will also report Retail Sales and the Empire State Manufacturing Index statistics on Wednesday.

USD/JPY Three Month Chart on the 14th of May 2024

Thursday, 16th of May, Japan Preliminary Gross Domestic Product – last month’s report came in with a gain of 0.1%. This GDP data carries an expectation of minus -0.4%. Traders who like fundamentals should pay attention to revisions within the statistical pages. The Bank of Japan remains in a curious and suspicious predicament. After two interventions, the USD/JPY has climbed incrementally once again. The BoJ is certainly keeping their eyes on the USD/JPY and know financial institutions are still wagering against the Japanese Yen.

Day traders should be extremely cautious with the USD/JPY because the BoJ has the ability to strike with a massive blow when not expected. Risk management is essential for speculators wagering on this currency pair. Evidence of speculative interest in the USD/JPY correlates to the notion that while the USD has been weaker against many major currencies recently, the Japanese Yen remains within a weaker and elevated price range.

Friday, 17th of May, China Industrial Production and Retail Sales – economic dark clouds continue to cascade on Asia’s largest economy. The industrial numbers will be watched by investors certainly, but the overall health of Chinese consumers will likely be the focal point. The USD/CNY remains within bullish terrain, but the Shanghai Stock Exchange’s SSE Index has done well since its lows in the first week of February.
postN41.1

Nervous Trading Results End of Last Week Serve as Caution

Nervous Trading Results End of Last Week Serve as Caution

The end of last week saw mixed U.S inflation data and lingering nervous sentiment regarding outlooks about U.S Treasuries, create rather choppy conditions for day traders. Economic data this week should be more calm because there appears to be less significant risk events on the horizon. Financial institutions finished Friday within a USD buying mode, a bearish gold trend, and U.S stock indices declining – highlighting fragile conditions remain evident among larger market players.

NZD/USD Six Months Chart as of 13th August 2023

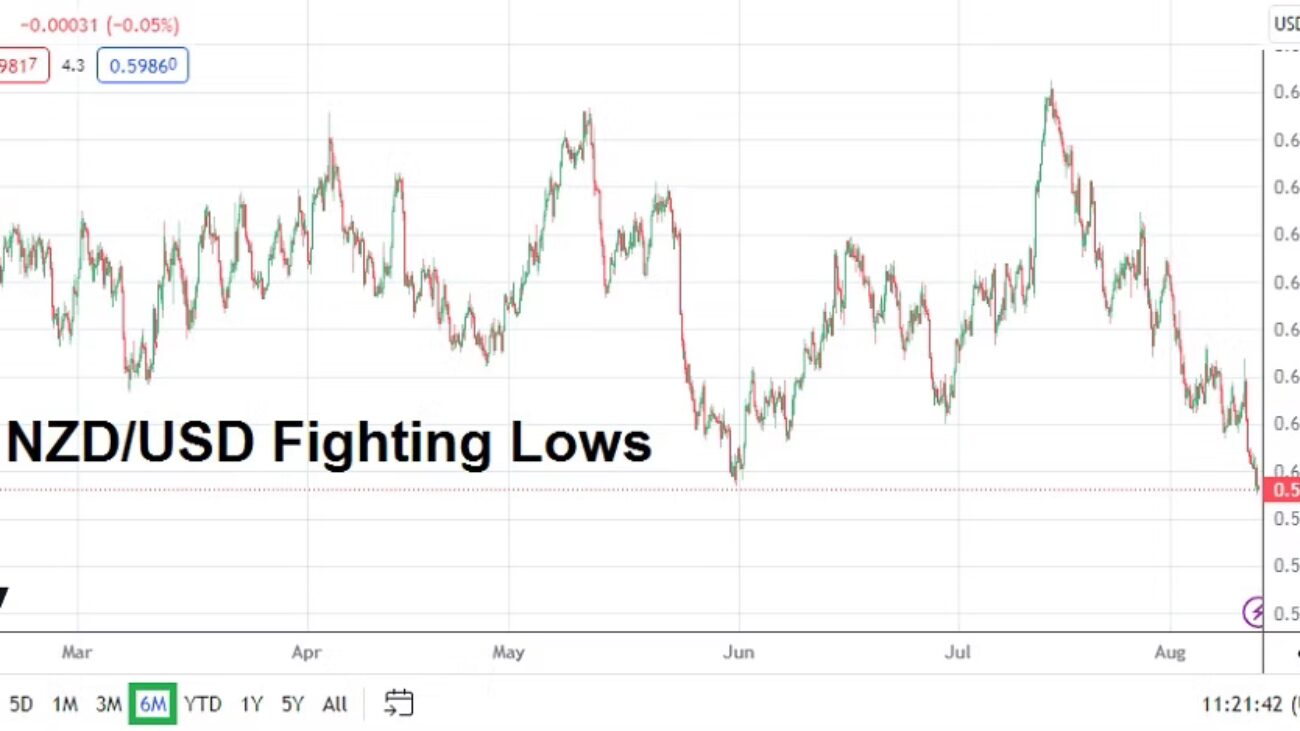
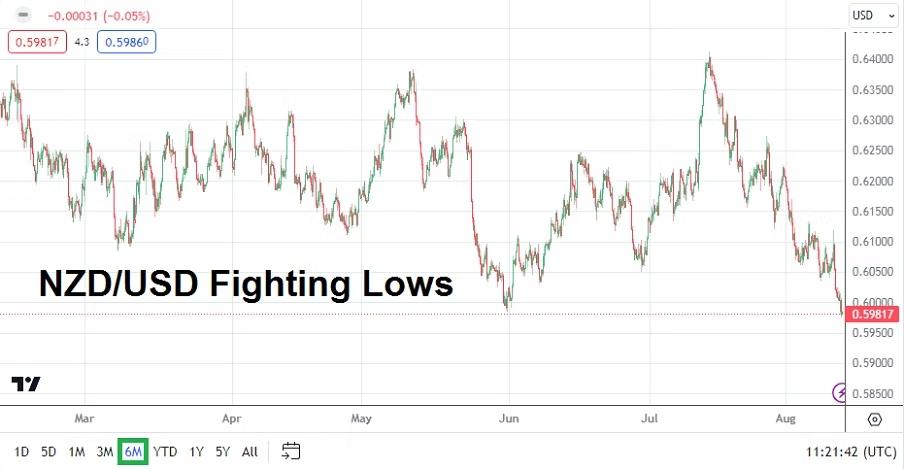
Monday, 14th of August, New Zealand Business Services Index – this report may turn out to be the highlight of the day for some traders. The NZD/USD which will start tomorrow near values last seen in the middle of November of 2022, may find interested speculators glancing at the report. But the NZD is moving largely under a USD centric driven market, like most of the broad Forex market. Mid and long-term technical support levels are certainly in focus, and they have proven vulnerable recently as the NZD/USD trends lower.

Tuesday, 15th of August, China Industrial Production – economic data from the nation has been troubling regarding deflation. However, traders who lean towards a ‘Western’ bias should remember to keep their perspectives realistic, because weaker China economic results mean the global economy is struggling too. A slight decline in Industrial Production is expected. Weaker than expected numbers from China could indicate ‘soft’ demand via export partners.

As an aside financial institutions will keep their eyes on the China real estate market too, this as whispers about ‘Country Garden Services Holdings’ funding problems remain a talking point and potentially escalate. Values of properties are suffering from declines too in China and this is hurting the domestic economy.

Tuesday, 15th of August, U.S Retail Sales – a slight gain in spending by U.S consumers is expected to be seen. If the number can meet the anticipated gain of 0.4% the result may not spark too much volatility. If for some reason a higher outcome is produced, this could spark some concerns about U.S Federal Reserve rhetoric. Although it may seem counter-intuitive to some traders, a weaker number could help ignite some bearish selling of the USD.

Wednesday, 16th of August, New Zealand Official Bank Rate – the interest rate policy from the RBNZ is expected to remain in place. Although it should be noted both New Zealand and Australia have almost made it a habit to surprise investors over the past few months.

Wednesday, 16th of August, U.S FOMC Meeting Minutes – the report will be studied for clues regarding outlook. However, the Fed has a well-practiced ability to maintain tight lips and not disclose too much internal thinking, particularly when it comes to disagreement regarding policy – which is seemingly escalating in the Federal Reserve.

Thursday, 17th of August, U.S Weekly Unemployment Claims and Philly Fed Manufacturing PMI – in what has likely been a quiet week of data leading up to these reports, some analysts may try to get the attention of their clients regarding these results to create ‘noise’, but unless there is a strong miss the data is likely to simply be digested quietly into the broad marketplace.

GBP/USD One Week Chart as of 13th August 2023

Friday, 18th of August, U.K Retail Sales – last week’s better than expected GDP numbers from Britain will make the outcome of this consumer data rather intriguing. The GBP/USD could find some impetus from the results. The estimate is calling for a decline of minus -0.4% compared to last month’s gain of 0.7%. The GBP/USD which went into last weekend near lows will likely find plenty of attentive traders as this new week comes to a close.

post34

Economic Data and Underlying Factors this Week

Economic Data and Underlying Factors this Week

Monday 15th of May, U.S Empire State Manufacturing – N.Y manufacturing sector report regarding business conditions, which serves as a sentiment reading. A lackluster outcome could put a bit more pressure on the Federal Reserve to lessen their aggressive stance, and certainly point out nervousness among U.S corporations regarding profits.

Monday 15th of May, U.S TIC Long-Term Purchases – report shows results from between domestic and international purchases of U.S Treasuries. While not considered a major data release, this one could give an impetus to investors in U.S banking sector who may find intriguing potential correlations. An increase in the number of domestic purchases compared to international buyers would be of interest. Large dark shadows on the U.S mid and small size banking sector still exists, pressures boil as depositors are still considering parking their money elsewhere, and corporate share values remain fragile.

Tuesday 16th of May, China Industrial Production and Retail Sales – China economic results are a barometer of global health due to the fact the nation is a large supplier of worldwide products. Industrial Production results if they are lagging in China, would indicate decreasing demand and global economic weakness. Retail Sales figures from China is an indicator of consumer sentiment within the nation.

Tuesday 16th of May, U.S Retail Sales – results indicate buying power and confidence among U.S consumers. Underlying numbers also focus on how Americans are spending, in other words – are they paying the full price being asked or are they looking for discounted goods as inflation continues to hit wallets.

Wednesday 17th of May, Japan Preliminary Gross Domestic Product – No real surprises expected from Japan’s growth numbers, but the results are always appealing to economists who debate the nation’s ability to remain among the wealthiest without any truly outstanding GDP numbers produced in years. In other words a lot of noise for traders without much real impact.

WTI Crude Oil – One Month Chart as of 14th May 2023

Wednesday 17th of May, U.S Crude Oil Inventories – another report that seems important for commodities traders, but without any real surprises has limited impact. Many times even among WTI Crude Oil speculators, they are often looking at other data they have gathered like production numbers from OPEC, Mexico and Canada. And also oil tanker movements around the globe.

Thursday 18th of May, Australia Employment Change and Unemployment Rate – outcome from these numbers could factor into AUD/USD momentarily, but without a major surprise will likely have little impact on global speculators for more than a couple of hours.

Thursday 18th of May, U.S Existing Home Sales – housing numbers are under some scrutiny as they reflect behavior of current U.S home owners as they react to growing interest rate pressures on mortgages and stay within their current homes to avoid higher borrowing costs.