USD and the Fed: Parade of Jobs Data Ready to Make Noise
U.S data last week created landmines for Forex speculators and the Federal Reserve. Global financial markets return to full action today following the long holiday weekend. Growth and inflation numbers from the States last week provided more unsettling results for financial institutions. While Forex has proven difficult for many traders, the major equity indexes are flirting with highs but also running into some intermittent headwinds.
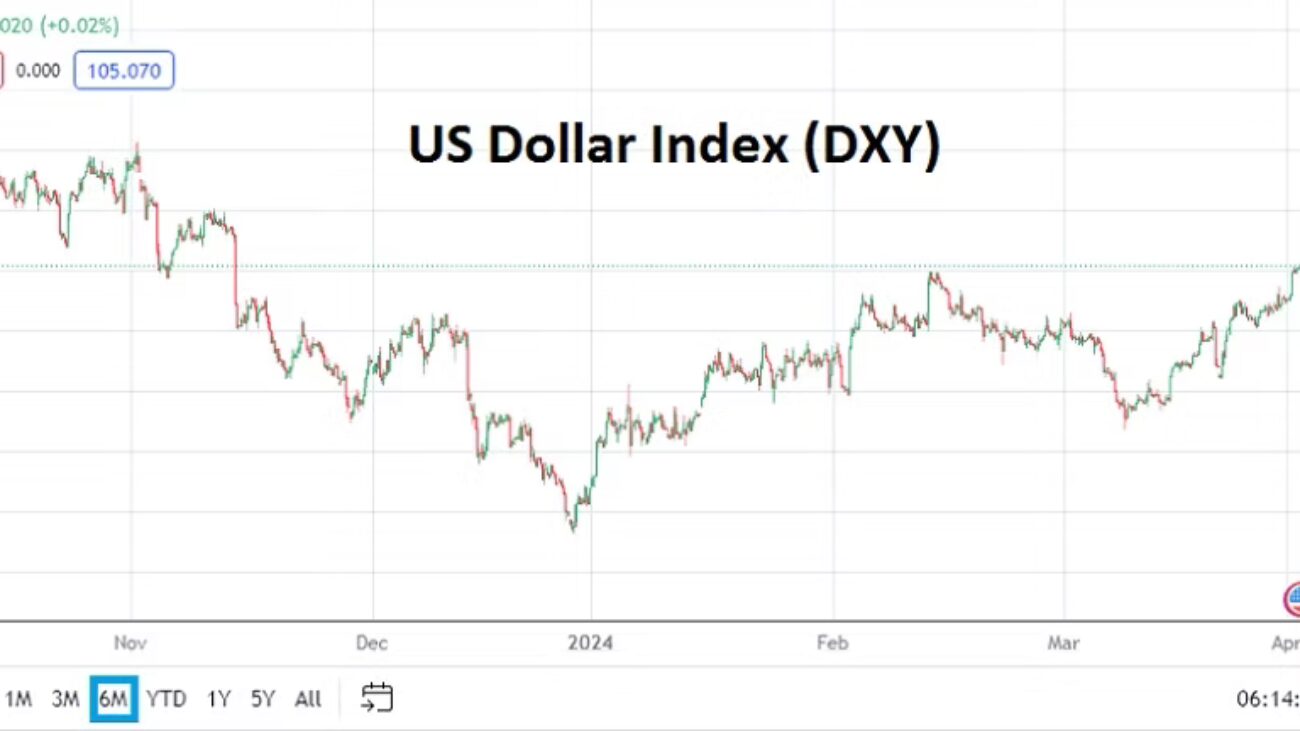
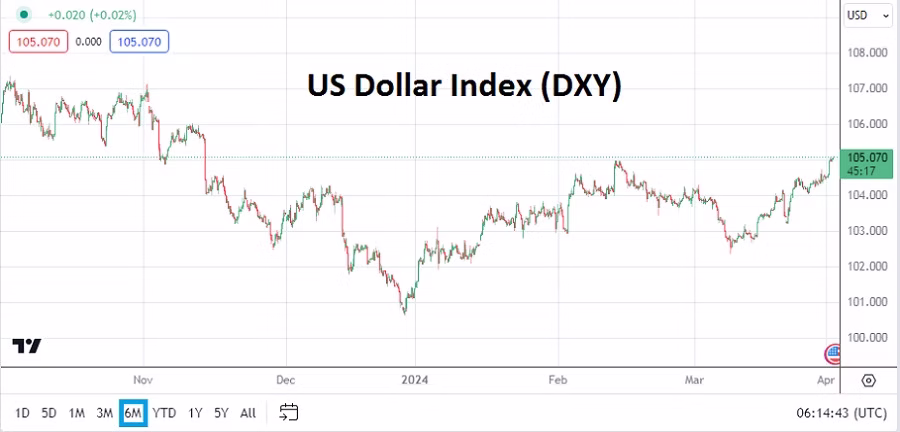
US Dollar Index Six Month Chart as of 2nd April 204
In December of 2023 the Fed was interpreted as having confirmed it would be able to cut the Federal Funds Rate during the 2024 calendar year rather consistently. Dovish policy had been anticipated by financial institutions which began to sell the USD aggressively in November. But by the end of the Christmas week the USD had essentially hit lows in many major currency pairs, and as January started reversals intensified.
The last three months of trading has produced choppy conditions in Forex, but one thing is clear – financial institutions no longer believe the Federal Reserve will be able to aggressively cut the Federal Funds Rate. The Fed has now begun to show signs that it is nervous regarding U.S economic data, this as growth via GDP numbers has remained firm, inflation sticky, and consumers resilient. Clouds shadow Forex and day traders have been hampered by a lack of solid trends.
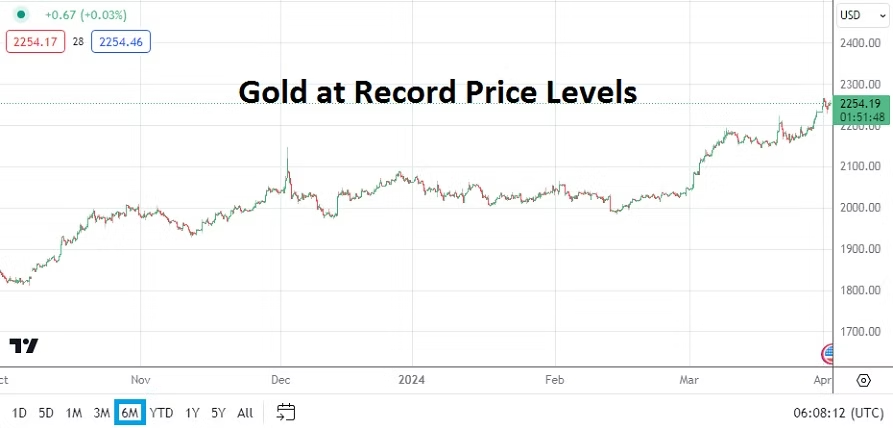
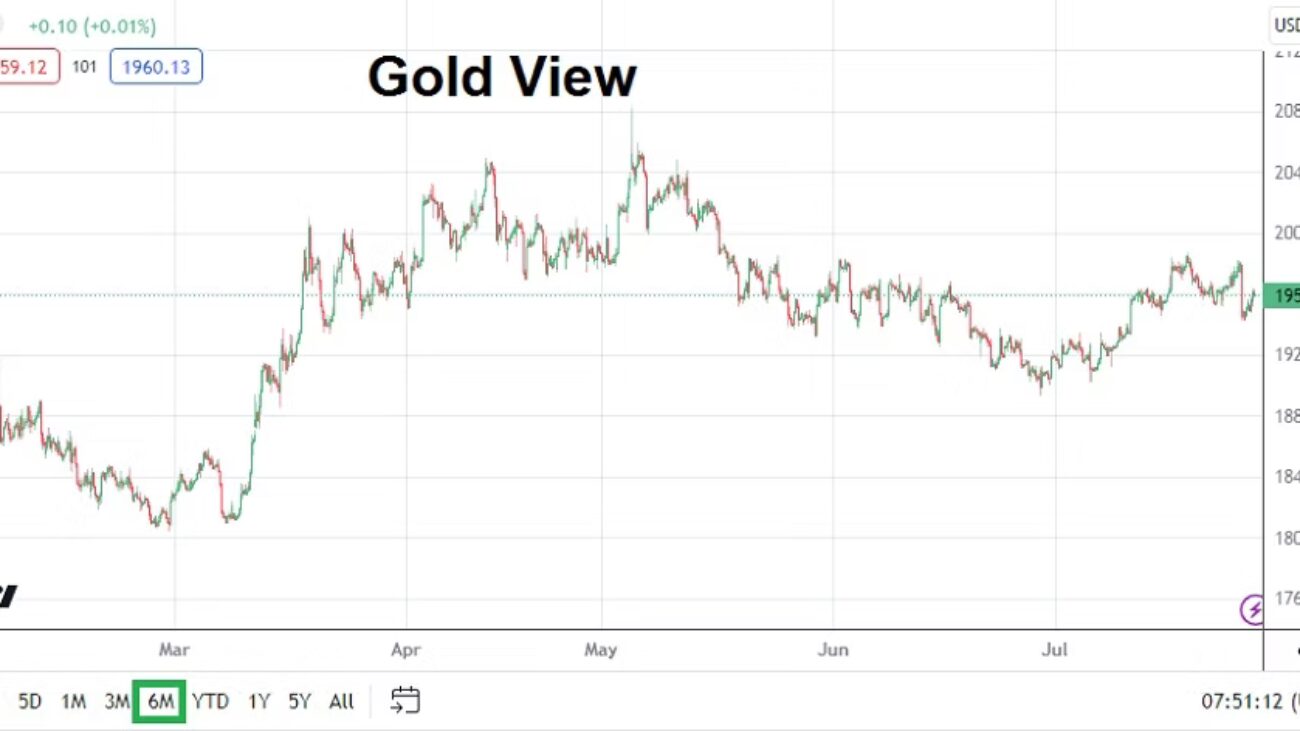
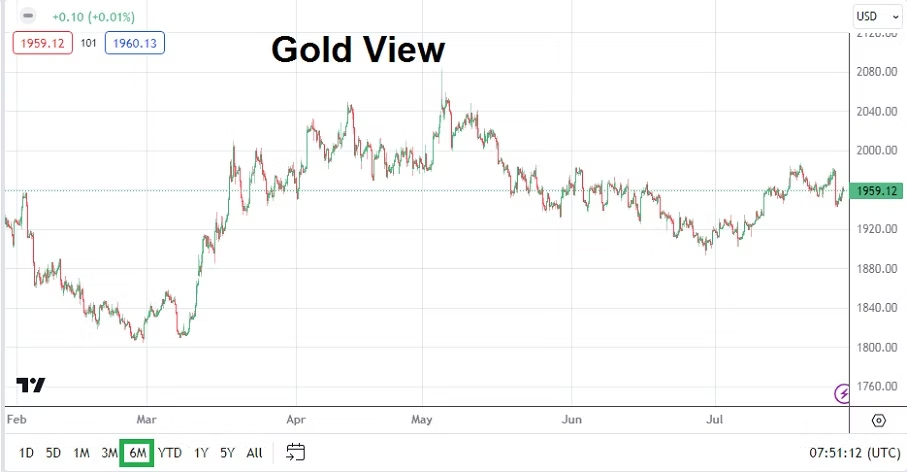
Gold Six Month Chart as of 2nd April 2024
Gold is trading near record price levels. The fact that the precious metal is touching all-time values as the USD has been strong has flustered some speculators. But traders need to remember Gold is affected by large players, including nations, that may be hedging USD bets and preparing for political instability. The price of Gold may underscore belief the U.S Fed will have to cut rates at least a couple of times this year no matter the economic facts on the ground, because this is an election year and if the central bank doesn’t deliver on its ‘promise’ jobs at the Fed may be at stake.
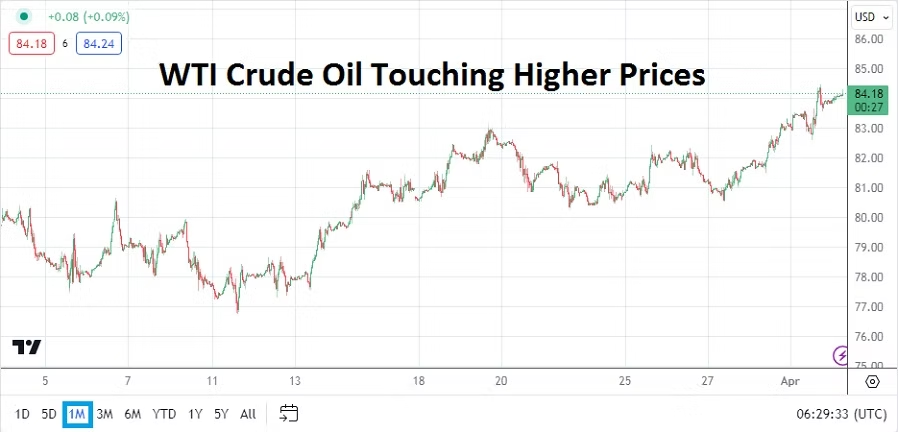
WTI Crude Oil One Month Chart as of 2nd April 2024
Not making anything easier for Federal Reserve policy is the higher price of WTI Crude Oil which has reached the 84.00 USD per barrel price. If energy costs go higher this will not help the fight against inflation. OPEC will be conducting a meeting this week. As an aside the price of Cocoa per metric ton is now over 10,000.00 USD, which is more expensive than Copper. While the price of Cocoa is not a game changer for global financial markets, the higher price will make chocolate more expensive, which some traders may find disagreeable as they try to relax and watch their speculative wagers while trying to nibble on their favorite snack.
Monday, 1st of April, U.S ISM Manufacturing – both the Purchasing Managers Index reading and the Price numbers came in higher than expected. The stronger results show the U.S economy remains better than anticipated by the Federal Reserve, which has been counting on its higher interest rate to slow down growth and inflation.
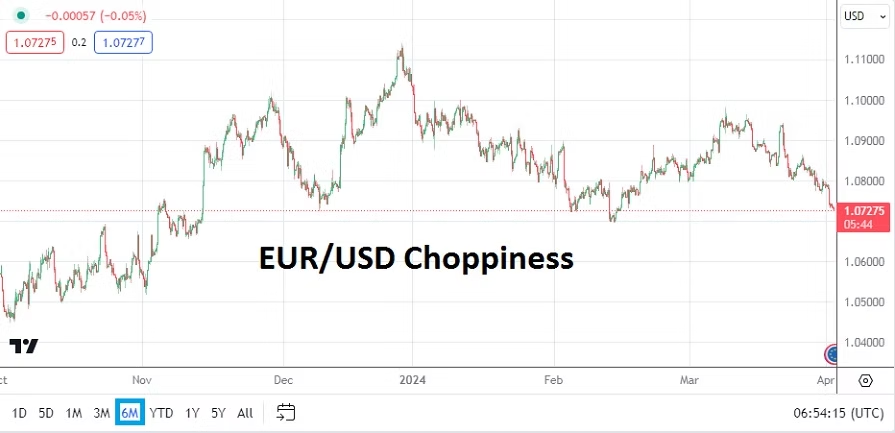
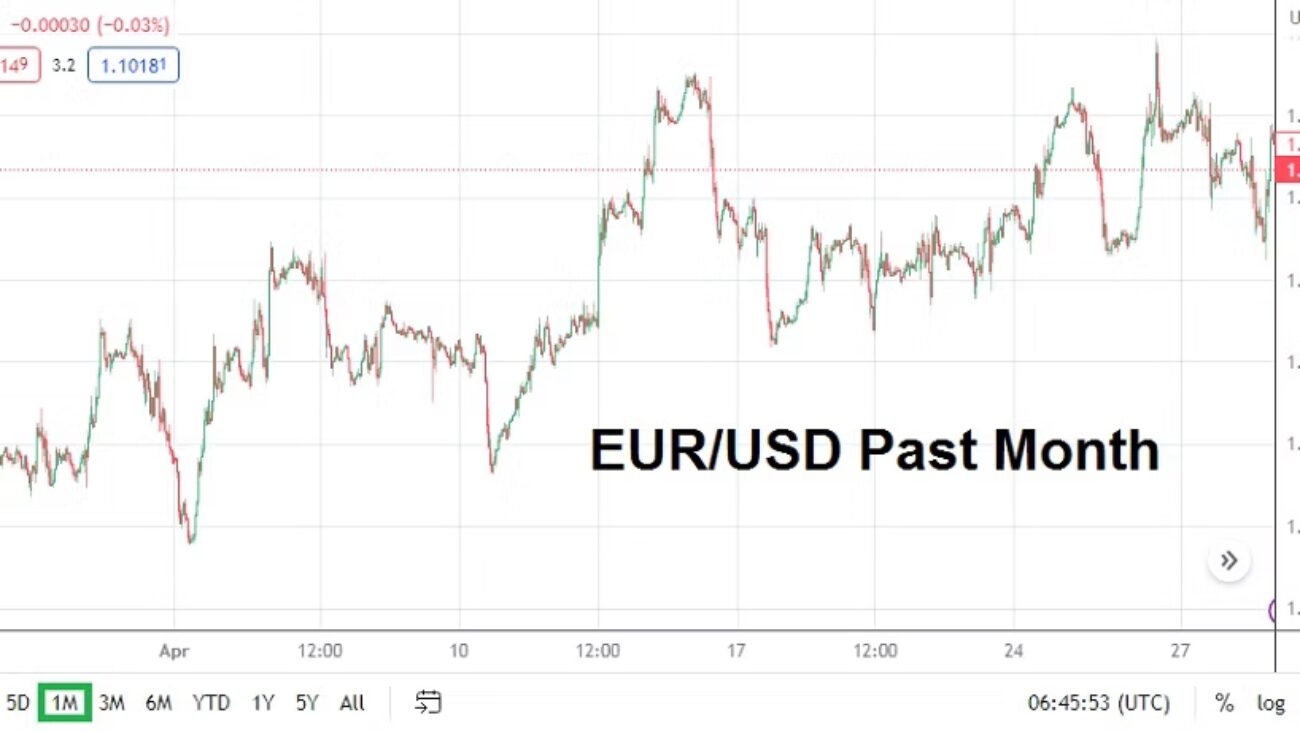
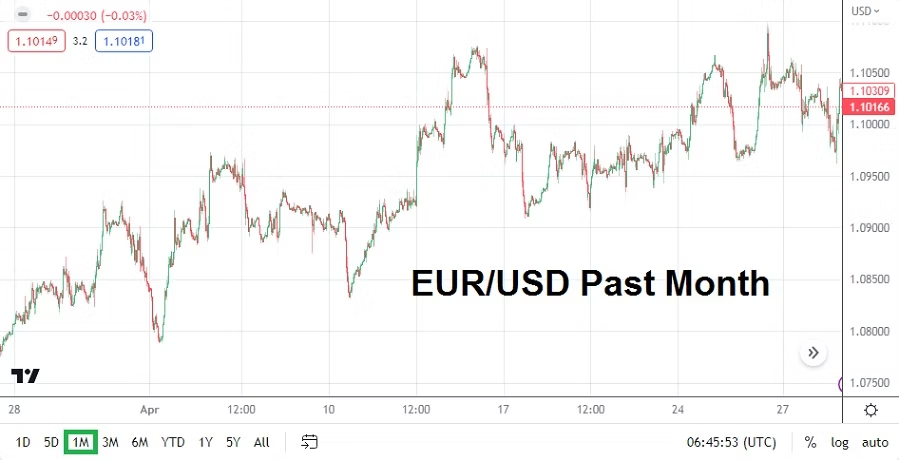
EUR/USD Six Month Chart as of 2nd April 2024
Tuesday, 2nd of April, European Manufacturing PMI – the European Union and Great Britain will release their business readings today. The results will demonstrate insights regarding sentiment. Financial institutions are worried the European Central Bank and Bank of England may have to consider lowering their interest rates before the Federal Reserve. The EUR/USD and GBP/USD will react to the results.
Tuesday, 2nd of April, U.S Federal Reserve FOMC Members – there will be appearances throughout the day in the U.S from various Federal Reserve members who will make the case for their monetary policy outlooks. It should be noted that Jerome Powell will be speaking on Wednesday. The JOLTS Job Openings will come out before the FOMC members speak. While the JOLTS report will not cause earth shattering reactions, the jobs data is the beginning of the parade regarding employment statistics for this week.
Wednesday, 3rd of April, U.S ISM Services PMI – taking into account the Manufacturing report came in stronger than expected on Monday, the Services data will be watched by financial institutions. If this report is better than anticipated, USD sellers will not rest easy. The ADP Non-Farm Employment Change data will also be released on this day.
Thursday, 4th of April, U.S Weekly Unemployment Claims – the Federal Reserve has been counting on employment strength to erode based on their notion that higher interest rates would create ‘lagging’ reactions in the jobs sector. Jerome Powell has said the Fed is anticipating weaker employment data. The results from the weekly report will not be as significant Friday’s data, but should be given attention by day traders in Forex.
Friday, 5th of April, U.S Non-Farm Employment Change and Average Hourly Earnings – the climax for speculators this week will be these jobs numbers from the States. If the numbers produce less hiring than expected this would help USD bearish momentum. Wages will also prove crucial regarding behavioral sentiment for financial institutions. Simply put, the Federal Reserve is anticipating that weaker employment numbers are going to be seen, if this doesn’t happen it might cause major volatility in Forex going into the weekend.
Anxiety and Surprising U.S Data for Day Traders to Consider
Global central banks stayed in their anticipated lanes last week as the Fed and ECB raised their key lending rates. The BoJ has admitted it is allowing its yield curve to increase, meaning the Japan government is cutting back on purchases of Japanese bonds. Forex produced anxiety and choppy results for day traders.
Gold 6 Months Chart as of 30 July 2023
Economic data from the U.S last week provided a strong Gross Domestic Product result on Thursday, and followed with weaker than expected Personal Consumption Expenditures and Personal Income statistics before going into the weekend. Meaning the U.S economy appears to be surprisingly solid, while inflation pressures do indicate they are in decline. The Forex market turned volatile on Thursday and Friday, gold which traded at nearly 1980.00 USD on Thursday went into the weekend near 1959.00.
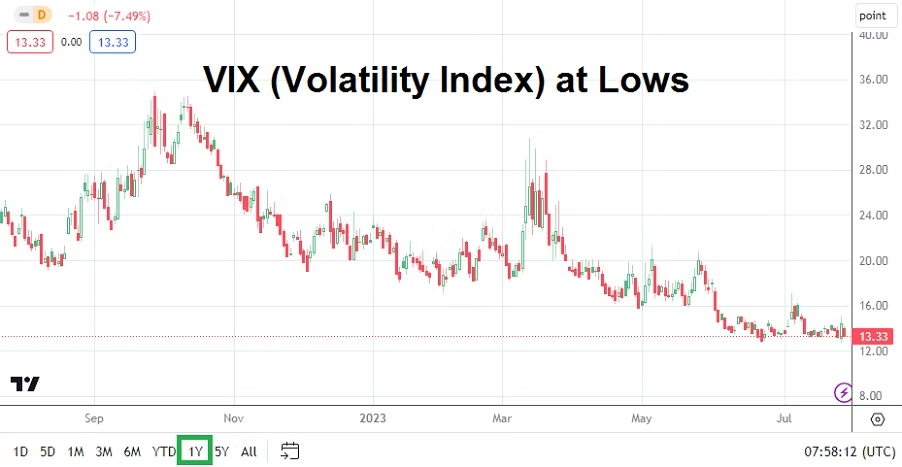
VIX Index 1 Year Chart as of 30 July 2023
Stock markets in the U.S via the major indices continue to incrementally rise and folks waiting for a big sustained selloff are having their patience tested. Perceived volatility in U.S markets is very low and the VIX (Volatility Index) indicates many investors are not taking the time to hedge with options because their confidence is remarkably high. A cautious reminder for traders, one bad day could change all of the optimistic sentiment.
In the cryptocurrency world, folks should continue to keep their eyes on the Binance exchange and its Binance coin. Many digital assets seem to be suspiciously close to important support levels as this week begins and appear vulnerable.
Monday, 31st of July, China Manufacturing PMI – while U.S data surprisingly improves, China has not begun to show signs of a positive turnaround quite yet, and this reading is expected to be below last month’s outcome. China data is a solid barometer of global economic health and traders should give these results proper attention.
Monday, 31st of July, E.U Consumer Price Index Flash Estimates – the European CPI numbers are expected to come in slightly below the previous month’s reading. If for some reason these inflation numbers are higher than expected, this could cause some chaos briefly for the EUR/USD. A weaker number however offers no sound wagering basis for short-term day traders either. Behavioral sentiment appears to be ruling the EUR/USD landscape for the time being, and technical levels should be watched.
Tuesday, 1st of August, Australia Reserve Bank Cash Rate – the RBA is expected to follow in the footsteps of the Fed and ECB and raise its lending rate by 0.25%.
Tuesday, 1st of August, E.U Manufacturing PMI – Germany and France are anticipated to produce similar results to last month’s outcomes. Recessionary pressures are a concern in the E.U and better than expected numbers would be welcomed, but this may prove difficult to demonstrate as economic conditions remain challenging.
Tuesday, 1st of August, U.S ISM Manufacturing PMI – the results from the manufacturing sector in the States should be watched. A slight improvement is expected, but the reading is not expected to produce a wildly optimistic result. An outcome which slightly beats expectations, but is not too strong might make the USD slightly weaker. Global investment institutions are likely hoping for any signs that the Federal Reserve will have to become less aggressive. A lackluster to ‘fair’ ISM Manufacturing PMI result could be evidence larger Forex traders want to see if they are aiming for bearish momentum in the USD.
NZD/USD 3 Months Chart as of 30 July 2023
Wednesday, 2nd of August, New Zealand Employment Change – the jobs statistics are expected to show slightly weaker results from the nation. The NZD/USD remains within the lower elements of its long-term price range. There are many NZD/USD bullish traders waiting for a sustained reversal higher, but it is unlikely to be produced from these New Zealand jobs numbers.
Thursday, 3rd of August, U.K BoE Monetary Policy Summary and Official Bank Rate – the Bank of England remains in a difficult spot and it will likely raise interest rates by another 0.25%. Criticism of the Bank of England has been loud in Britain, but the BoE likely feels it has to remain in line with the Fed and ECB. Recessionary pressures continue in the U.K and inflation remains problematic. Concerns will be heard regarding property mortgages for home owners if the BoE hikes. The GBP/USD will certainly move depending on the rhetoric from the Monetary Policy Summary and talking points delivered by BoE Governor Andrew Bailey.
Friday, 4th of August, U.S Non-Farm Employment Change and Average Hourly Earnings – the jobs data parade will climax at the end of the week, this after starting on Wednesday via the ADP jobs numbers. Investors will watch the Non-Farm Employment Change data carefully and correlate them to the better than expected GDP results from the 27th of July. The wages data from the Average Hourly Earnings is expected to come in with a slight decrease. A weaker inflation result from the wages statistics could cause additional softness in the USD. However, recent data from the U.S has been hard to predict correctly, and day traders may want to sit on the sidelines until all the jobs numbers are digested.
Monday 1st of May, U.S ISM Manufacturing PMI – weaker than expected Advance GDP results last week make this report of keen interest for investors regarding U.S growth (or recessionary) prospects.
Tuesday 2nd of May, Australia RBA Cash Rate – Reserve Bank of Australia is expected to hold the line regarding borrowing.
EUR/USD 1 Month Chart as of 30th April
Wednesday 3rd of May, U.S Federal Reserve FOMC Statement and Federal Funds Rate – U.S central bank expected to raise by another 0.25% making key lending mark 5.25%. This number has been digested into the broad markets, what investors want to know is the Fed’s June outlook. Federal Reserve outlook and FOMC Press Conference will move Forex and equities globally. Traders remains suspicious regarding another hike in June.
Thursday 4th of May, E.U ECB Main Refinancing Rate – European Central Bank expected to hike by another 0.25%. Anything different would be a surprise. ECB Press Conference should be rather tranquil.
Friday 5th of May, U.S Non-Farm Employment Change and Average Hourly Earnings – while jobs numbers are always of interest, it is the earnings statistics which should be watched and will give insight regarding inflation and potential actions about Fed’s June considerations.