Sudden Bullish Momentum of Indian Rupee Raises Questions
The past week of trading within the USD/INR has seen a bullish trend emerge, this while many speculators were likely starting to believe lower price realms and targets were possible.
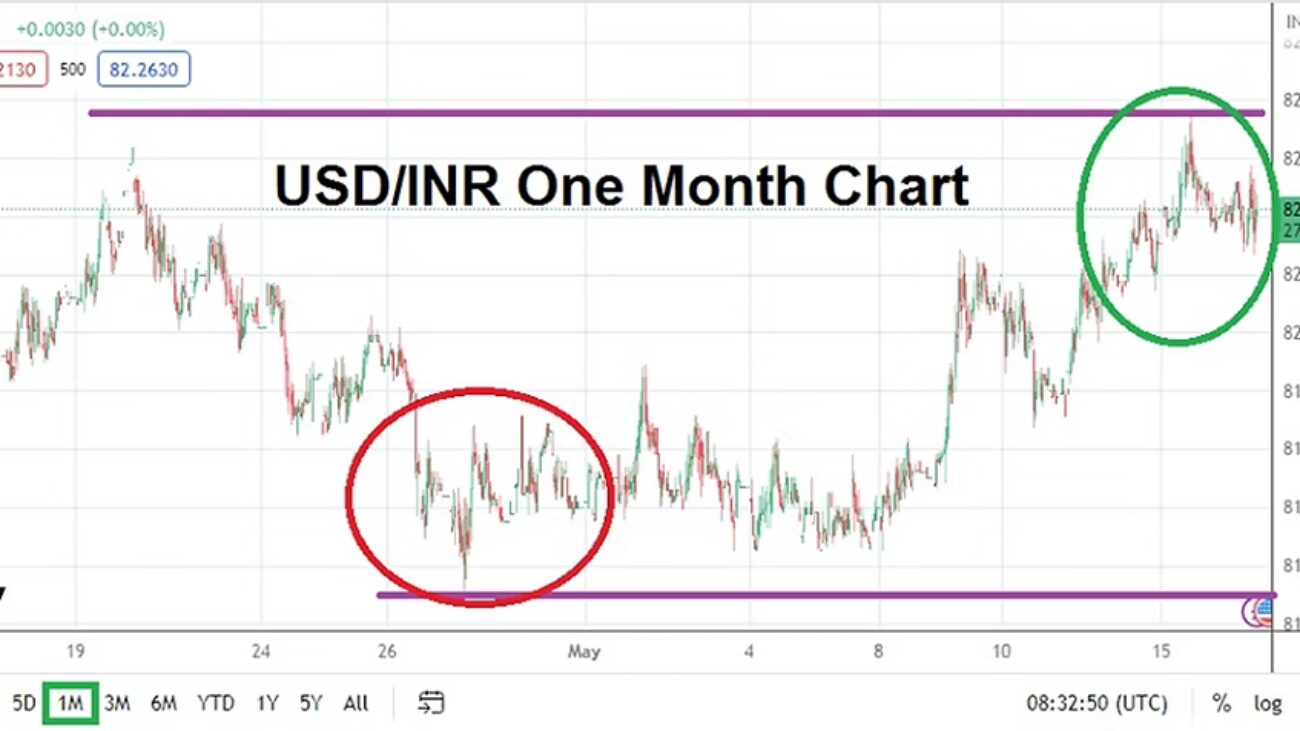
The USD/INR is trading near the 82.2200 mark as of this writing, which is within the higher elements of its one month price range. Volatility within the USD/INR has been abundant the past week and has likely proven expensive for speculators who were pursuing the currency pair with visions of more bearish price action to target. Early May values of the USD/INR certainly tested lows and likely fueled the appeal of selling positions. However, the early May lows within the Forex pair tested the 81.6260 mark, while never actually hitting April’s lowest values which tested the 81.5500 ratio on a couple of occasions.
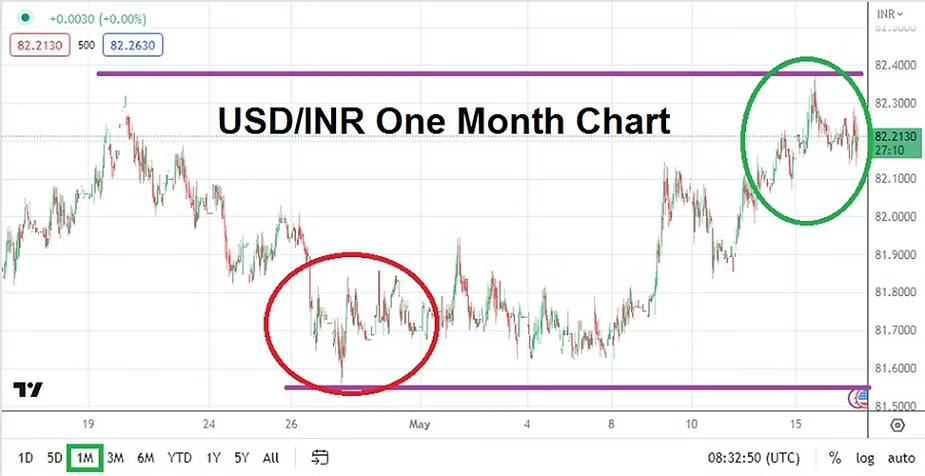
USD/INR One Month Chart as of 16th May 2023
One of the dangers of trading is always the potential for a sudden change in behavioral sentiment. The lows in the USD/INR seen on the 8th of May, which is only a little bit more than a week ago, highlights the price velocity the currency pair has demonstrated. While many speculators are trying to understand why the sudden shift in dynamics has taken place, it is important to remember the USD/INR was actually trading above its current values in February, March and early April of this year.
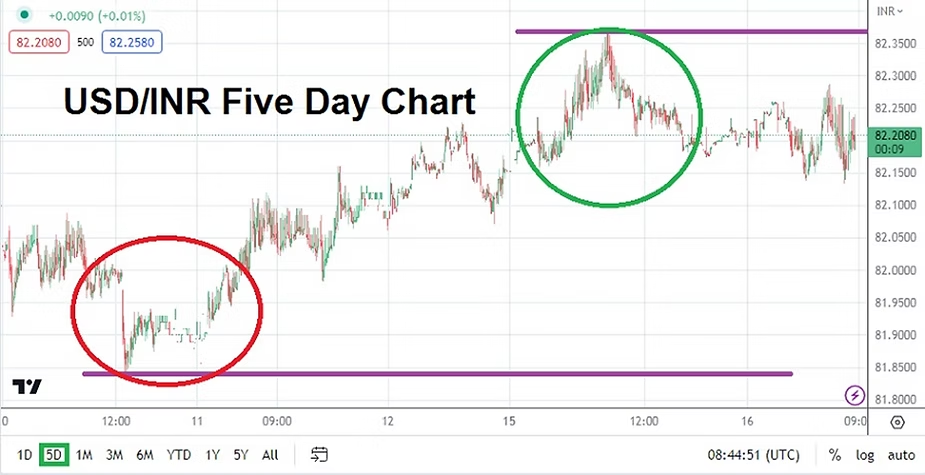
USD/INR Five Day Chart as of 16th of May 2023
The Difference between Day Traders and Financial Institutions
The outlook of speculators within the USD/INR is totally different than financial institutions. This is because most speculators are short and near-term traders. They do not have deep pockets like financial institutions – which can hold the USD/INR in a chosen direction for a long period of time and simply allow the currency pair to trade until they want to cash out of a position. Day traders are also using leverage a lot of the time, and the combination of leverage with limited available trading funds makes the daily gyrations of trading volatile and frequently dangerous.
Short-term traders look at the USD/INR with a technical viewpoint much of the time, financial institutions are likely maneuvering in the Forex pair with fundamental perspectives and inside knowledge based on known transactions they have to accomplish.
Many financial houses believe the U.S Federal Reserve will have to become less aggressive regarding its hawkish interest rate stance it has maintained the past year and a half. However there is enough nervousness within the broad Forex markets to make things very difficult for day traders, this as the potential for risk adverse trading based on economic data results move currency pairs including the USD/INR constantly, particularly if a financial institution needs to react quickly.
The ability of the USD/INR to move downward and hit support depths at the beginning of last week, may indeed be a sign that financial institutions have a belief the currency pair should be lower. However, the recent strength of the USD the past handful of days may have been brought on by the simple notion that financial houses grew momentarily nervous. There is also the possibility that large corporations made transactions in the USD/INR that moved the price higher. Day traders must understand there are forces within the USD/INR that are much stronger than their opinions. The USD/INR is not a widely traded currency pair in the open markets, it is difficult for instance to trade the currency pair in a speculative manner within India and traders in the nation face restrictions, which forces many Indian speculators who want to wager on the USD/INR to seek foreign brokers abroad.
Data and Rumors Can Sometimes be False Flags for USD/INR Traders
Some analysts have claimed the recent move higher in the USD/INR has taken place because of factors like a fear of the U.S debt ceiling not being raised in time and causing chaos in the financial markets, however this if true is likely only a short-term worry. It is very unlikely the U.S government is ‘idiotic’ enough to allow the U.S debt ceiling to not be taken care of within Congress. It would be very problematic for the U.S Federal Reserve and Treasury to have to explain why U.S bonds are suddenly difficult to repay. In other words, the U.S debt ceiling is likely to be taken care of and many financial institutions with a long-term view know this, although it is a possibility they could ‘punish’ the financial markets and act in a risk adverse manner in the short-term.
Data from the U.S yesterday highlighted another important aspect again regarding behavioral sentiment. The U.S Empire State Manufacturing Index reading came in with a negative number of minus -31.8. The expected result was -3.7, the report shows that New York business activity and outlook is worse than forecasted. This doesn’t mean the entire U.S manufacturing sector will have the same results, but it underscores the potential for a U.S recession to possibly occur. Today the U.S will release Retail Sales numbers. If these numbers come in with a negative result this could spur on bearish sentiment within the USD/INR in the near-term, particularly if financial institutions feel the results are more evidence the U.S Federal Reserve will have to pause interest rate hikes in June. USD/INR day traders should be ready for more choppiness. But there is reason to suspect resistance above in the currency pair may start to prove durable from a speculative point of view considering the trading results the past month in the USD/INR.
Traders wishing to pursue the USD/INR need to use solid risk management. Entry price orders will help traders get a ‘fill’ they are expecting and the use of stop loss and take profit tactics are highly encouraged. The past week of trading in the USD/INR has likely tested the nerves of many speculators and the assault on highs is alarming, but downside price action may be ready to reignite if U.S economic data continues to falter in the near-term.