Digesting Holiday and Markets to Come as Fed Looms Next Week
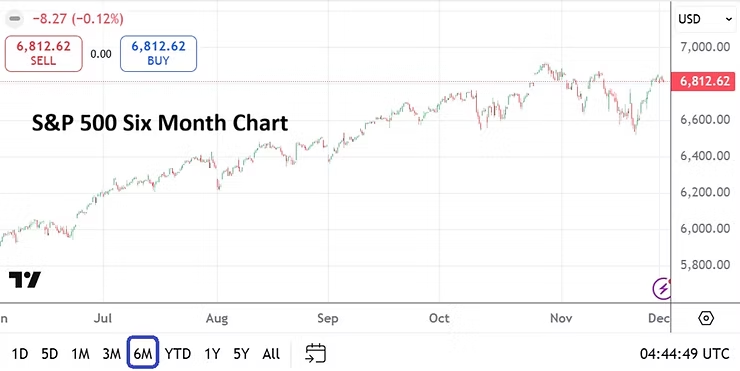
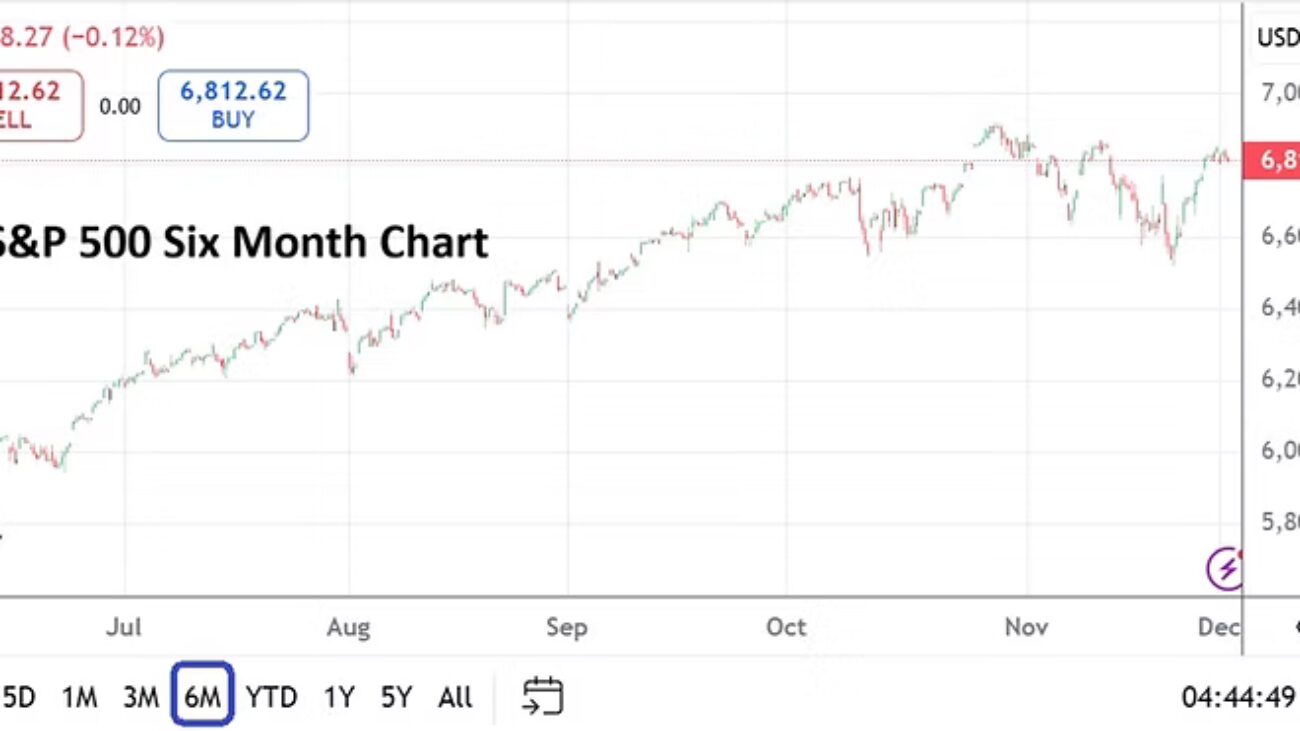
Day traders trying to gauge markets may be feeling a bit of angst for the moment. Always wanting to participate when record highs are being made in the stock markets, the S&P 500 and Nasdaq 100 remain under their respective apexes from late October and early November. Though the markets have produced gains recently, they have not come particularly easily for those who like to ride momentum waves. As always timeframes matter, it is often easier to make mistakes and be impatient when short-term wagers factor into decision making.
S&P 500 Index Six Month Chart as of 2nd December 2025
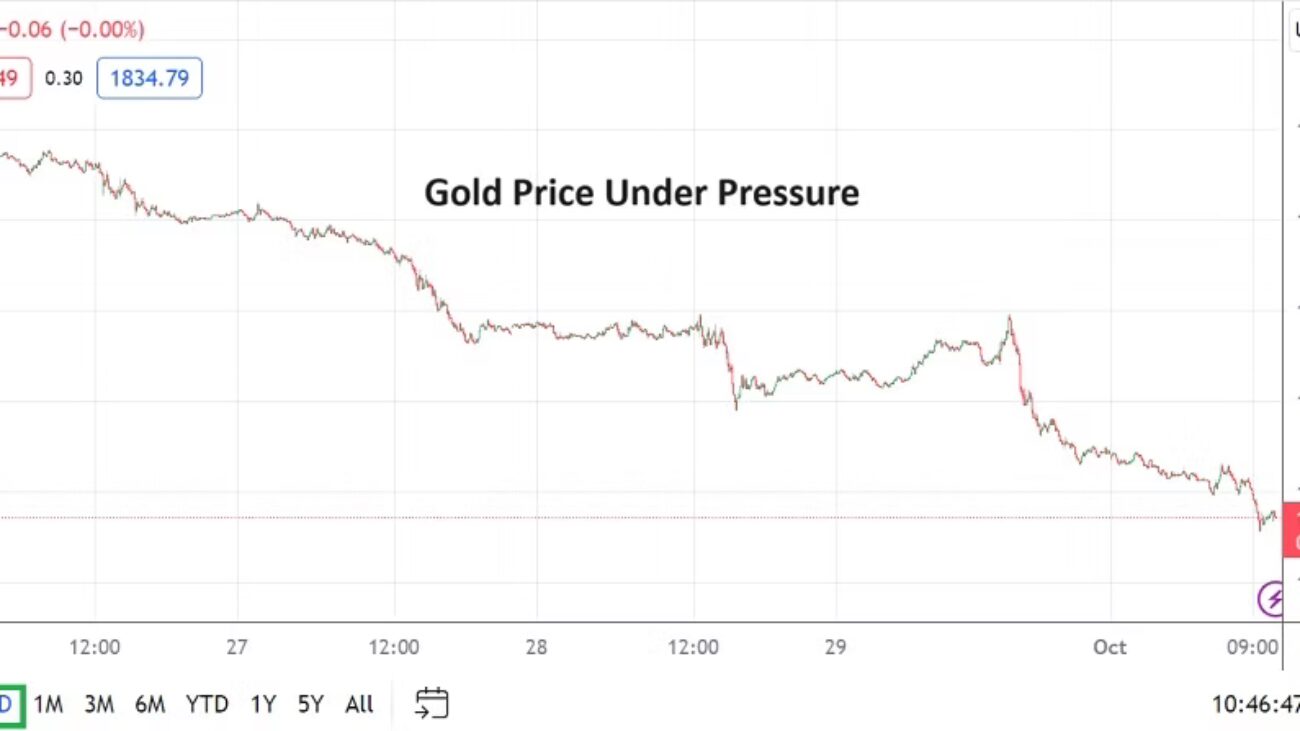
Gold has done well the past couple of weeks, regaining its upwards traction, but also remains under its apex values. The Federal Reserve will release its FOMC interest rate decision on the 10th of December, and this is what many in the markets may be waiting for in order to make their last big bets for the year per speculative plays.
The Forex market like equities and commodities continue to provide choppy behavior. The ISM Manufacturing numbers from the U.S came in below expectations yesterday. Retail Sales data and Consumer Confidence numbers last week from the States came in below expectations too. There will be jobs statistics via the ADP report on Wednesday and an ISM Services figure. Thursday will see U.S weekly Unemployment Claims. Friday will provide a rather interesting clue for Forex traders and likely influence bond yields when the Core PCE Price Index reading is provided – which the Federal Reserve pays quite a bit of attention regarding their interest rate decisions. The Consumer Sentiment Preliminary University of Michigan data will also be seen on Friday.
As Tuesday starts, day traders should also beware that full market volumes will emerge, this after last week’s Thanksgiving holiday in the States and perhaps a slow return to offices yesterday. The markets will provide plenty of action over the next couple of weeks, before the inevitable Christmas and New Year’s trading doldrums begin.
Trading Optimism for 2024 and Pursuit of Castles in the Air
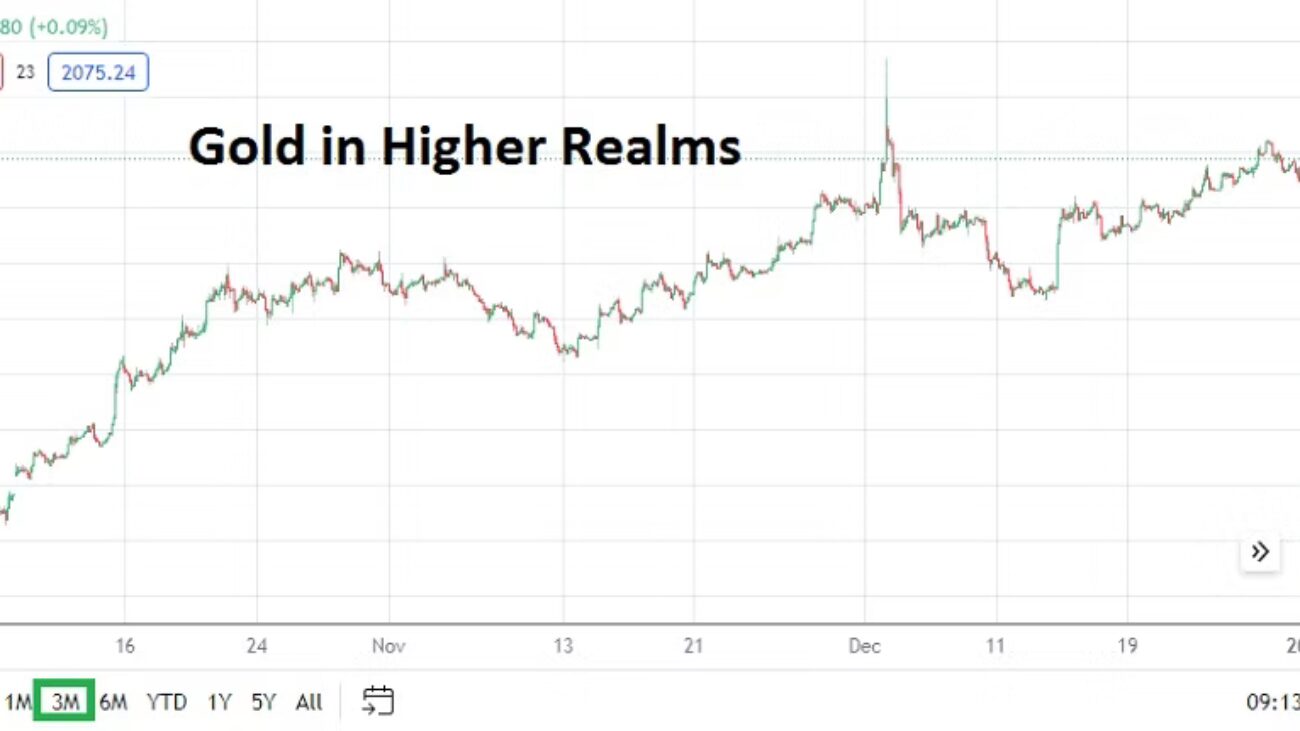
Traders may feel like horses being kept in their stables right now. The desire to run freely in Forex and other markets is certainly being felt, this as many analysts have jumped onto optimistic bandwagons and are pointing to the U.S Federal Reserve and its rather dovish outlook for 2024. Gold in early trading this morning is lingering near highs and the USD remains within weaker territory when technical charts are inspected via one month results.
Gold Three Month Chart as of 2nd January 2024
Yet, thin holiday trading is full in effect. Light volumes will continue to be seen early this week after the New Year’s celebrations. Financial institutions will open their doors today, but their corporate clients around the world will have plenty of employees who will remain on vacation until the 8th of January. Thus, while day traders may feel enticed to wager in the markets with various CFDs, they should be careful and understand unbalanced positions may cause temporary chaos. Risk taking tactics should be carefully considered.
The desire to dream about castles in the air is a source of comfort for many new day traders. But remaining realistic about potential results, while not getting overly ambitious about targets is an important aspect for all speculators. While trends may look attractive in Forex, commodities and equities a well planned approach regarding risk taking is a practical road. Castles in the air tend to vanish.
Optimism will be a word frequently heard in the coming days and weeks, and here’s to wishing everyone a prosperous and peaceful 2024. The potential of a more dovish U.S Federal Reserve regarding monetary policy and declining Treasury yields sparking more risk appetite in equities as investors seek solid returns is alluring, however risks remain on the table. The economy of China continues to worry analysts and tensions in the Middle East are still a long way from being solved.
However, the biggest cause for speculative concerns during 2024 may come from elections in Taiwan, India, South Africa and the United States. Taiwan’s presidential vote is on the 13th of January. China will certainly be watching the results, and traders should expect to hear swords rattling afterwards and then hope the noise calms down.
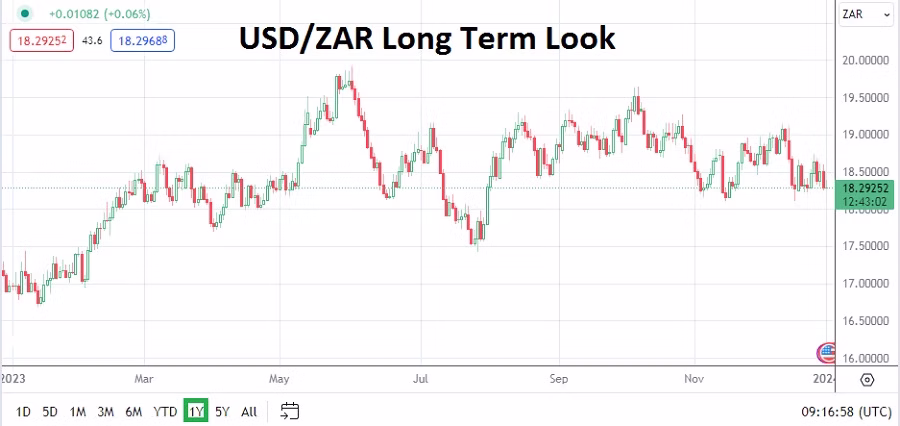
USD/ZAR One Year Chart as of 2nd January 2024
Tranquil voting results in India will be welcomed by investors. India is becoming a noteworthy economic giant, its rapid growth and ascension as an important investment vehicle needs to remain stable. South Africa remains troubled domestically by concerns regarding corruption and inefficiency, its upcoming spring election results may not solve the problems it faces. There will be many elections in Africa this year, which could spur on considerations regarding geopolitical alliances and the price of commodities.
The U.S election late in 2024 will start to grow in noise as the months progress and by early this summer behavioral sentiment will begin to become nervous regarding the outcomes for the White House and Congress. The U.S appears to be braced for an election between Joe Biden and Donald Trump and this will certainly cause skittish storms.
Traders should feel confident about risk appetite in the global markets improving, but they should keep in mind that impetus coming from many different spheres can affect the financial world.
Tuesday, 2nd of January, U.S Final Manufacturing PMI – today’s Purchasing Managers Index is expected to show a slight improvement, but the results may fall on deaf ears because many market participants will not be around to react due to the fact they are still on vacation.
Wednesday, 3rd of January, U.S ISM Manufacturing Prices – this inflation survey from purchasing managers may be given a bit of attention, but its effect may be limited because of light trading volumes still being exhibited.
Thursday, 4th of January, Germany Preliminary CPI – the inflation data from Germany will get some consideration, and the result is expected to show a slight increase. Services PMI data will also come from European Union nations, the U.K and U.S.
Friday, 5th of January, U.S Non-Farm Employment Change and Average Hourly Earnings – the jobs reports will get the notice of financial institutions. The results for employment and wages are expected to be slightly weaker than the previous month’s outcomes. Typically these numbers would cause a stir, but unless there are surprises, most financial institutions may not react massively to the reports because it remains a ‘holiday’ week. If the numbers come in weaker than expected this could cause interesting reactions on the 8th of January and weaker USD sentiment.
AMT Top Ten Miscellaneous Viewpoints for the 29th of Dec.
10. Book: Cargill: Trading the World’s Grain by Wayne G. Broehl, Jr., a book that folks interested in physical commodities may find interesting.
9. Music: A Night in Tunisia played by Charlie Parker and Miles Davis on The Complete Savoy & Dial Master Takes.
8. NBA: Detroit Pistons have now lost 28 straight basketball games. Will the team get a participation trophy at the end of this season?
7. Post-Quantum: While ‘Artificial Intelligence’ grabs headlines, ‘post-quantum cryptography’ is a phrase and reality that corporations will need to learn increasingly.
6. Behavioral Sentiment: Risk appetite has remained firm during this holiday week, which may spark additional optimistic trading banter in January as trends are wagered upon.
5. U.S Treasuries: Yields have continued to move lower, and dovish outlooks regarding the U.S Federal Reserve inside many financial institutions may increase speculative zeal.
4. Gold: The precious metal remains near highs and the price of 2100.00 USD is hovering above, will this level start to be challenged and penetrated?
3. JPY and NZD: Both currencies remain bullish as they recover from long-term USD strength, this while mid-term price realms are being firmly challenged. Technical traders with long-term outlooks may want to start examining one year charts.
2. U.S Equities: S&P 500 on the cusp of record highs, the Nasdaq 100 is at apex values – while the Nasdaq Composite remains bullish, and the Dow Jones 30 continues to create new heights.
1. 2024: A prosperous and peaceful New Year is wished for all.
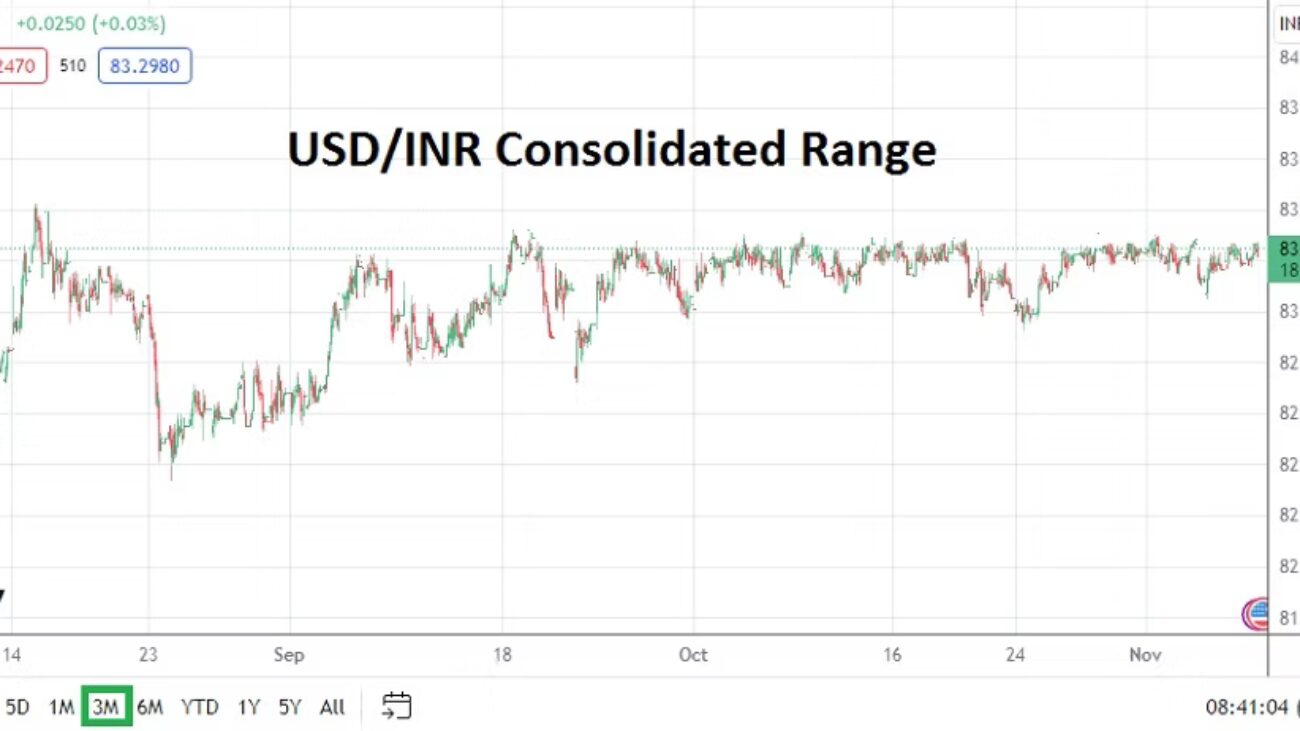
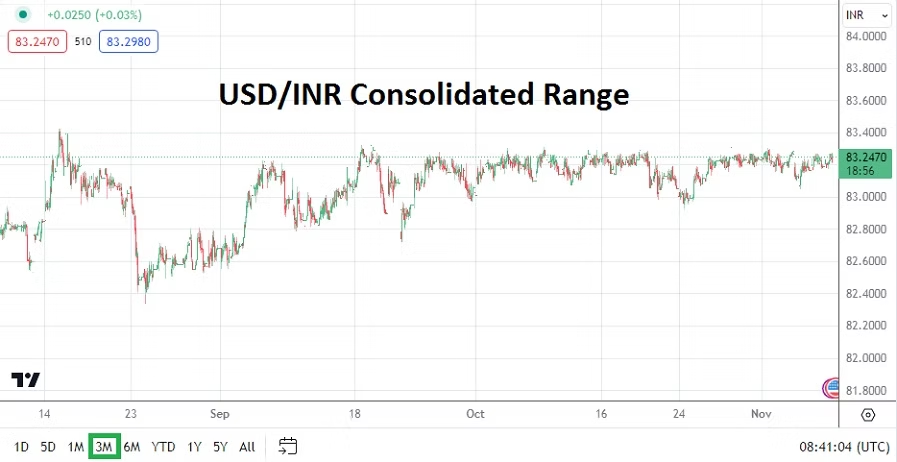
USD/INR and the 83.3000 Resistance Level is Not an Illusion
Traders of the USD/INR for those who remain short-term speculators of the currency pair, as opposed to financial institutions which position holdings for corporations and large investors, may be perplexed about values and momentum over the past three months. It is abundantly clear the USD/INR faces a rather strong force when it approaches the 83.3000 mark. Yes, sometimes the Forex pair has traversed above this level, but the moves have been momentary and have been pushed back.
USD/INR Three Month Chart as of 8th of November 2023
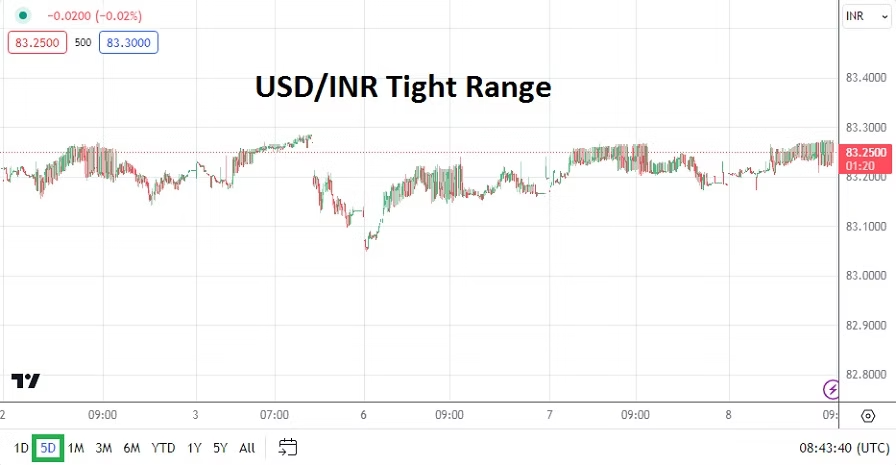
It is not a conspiratorial thought to simply look at the three month chart of the USD/INR and see that when the 83.3000 level has come into play that selling pressure mounts. And it is not news the Reserve Bank of India is involved in the durability of this resistance level. Simply put the USD/INR doesn’t trade in a ‘free’ market manner, the constraints and persistence of the Reserve Bank of India to maintain a structured resistance value for the USD/INR is evident. The past month, and last five days of trading via technical charts shows the same dynamic. And it is important to point out the resistance level of 83.3000 has been sustained over the mid-term when global risk adverse trading has seen the USD gain strength against many other major currency pairs, meaning the USD/INR should have traded at higher levels.
USD/INR Five Day Chart as of 8th of November 2023
The Indian government is managing the USD/INR with a philosophy which allows the currency pair to remain within its weaker elements regarding the Indian Rupee, but not allow it to lose too much value. And it must be pointed out that the USD/INR does show an ability to trade lower and the Reserve Bank of India doesn’t appear to mind if this happens. The 83.0000 was challenged from about the 20th to the 24th of October rather consistently and even traded at a low of 82.9300 very briefly.
As global risk conditions remain fragile the USD has shown an ability to remain strong against most major currency pairs, but risk appetite has picked up over the past handful of days. The 83.2000 to 83.2500 range of the USD/INR has been tested with momentary bursts lower. Last week’s U.S Federal Funds Rate was held in place as expected at 5.50%, and financial institutions are starting to believe the Fed has reached the end of its interest rate cycle which has seen consistent hikes. Yes, the U.S is likely to keep its higher interest rates in place over the mid-term, but U.S Treasuries yields are starting to show signs of an incremental decline. If U.S bonds start to decrease via their yields this will help soften the USD.
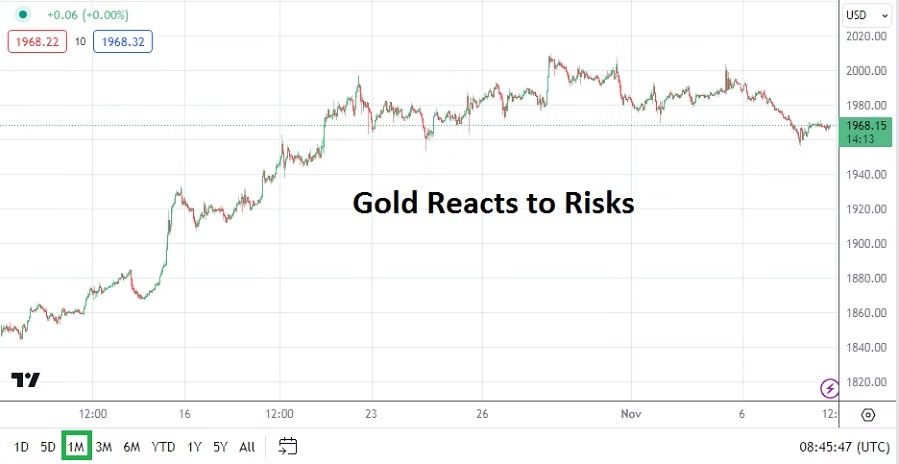
Gold One Month Chart as of 8th November 2023
Gold has started to come of its highs, but still remains within an elevated range per its one month chart. If the precious metal continues to trade around its current values, this can be taken as a sign risk sentiment wants to shift. The key word is ‘wants’ and there are no guarantees. While financial institutions have shown the ability to digest the escalated concerns because of the Middle East crisis there is always the possibility developing news can escalate quickly. But will it?
Unfortunately, the media and pundits largely control the narrative that is given to the public. Most traders are not privy to the inner workings of the ‘temples’ in which governments work. The Reserve Bank of India doesn’t issue a statement every time it makes a move within the USD/INR. Nor do the governments of the world which may say one thing publicly and say something else behind closed doors.
Day traders want to be told what to do and how they should react. First off risk management is essential, entry orders are crucial so fills meet expectations. However, achieving the direction desired and wagered upon is a gamble. Take profit and stop losses orders are urged as protection.
If the Reserve Bank of India had not intervened in the USD/INR it is likely the currency pair would have reached the 84.0000 level and higher over the past three months. The question is if risks will decrease now that the U.S Federal Reserve seems prepared to potentially take a less aggressive stance. While it seems logical the USD/INR should have been trading at higher values, the control the government of India has practiced has kept the currency pair within a ‘safe place’ while risks were heightened.
If behavioral sentiment conditions start to turn more tranquil and risk appetite increases it is possible the USD/INR could actually continue to show some selling momentum. However, traders looking for declines in the USD/INR need to be conservative and they might want to wait for the currency pair to come within sight of resistance levels to wager on short and near-term movements lower. Overly ambitious selling is likely to remain an expensive mistake until the U.S equity markets show sustained buying and U.S Treasury yields are no longer threatening long-term highs. Until there is a legitimate shift in behavioral sentiment, looking for quick hitting changes of value in the USD/INR needs to remain the focus for day traders.
Nervous Outlooks and Short Term Fixes Creating Anxiousness
A U.S government shutdown has been avoided, but the resolution highlights that an important year of political games is getting fully underway in Washington. Short term fixes via congressional agreements do not hide the fact the U.S government continues to bleed money and is adding to its deficit as yields on U.S Treasuries remain high.
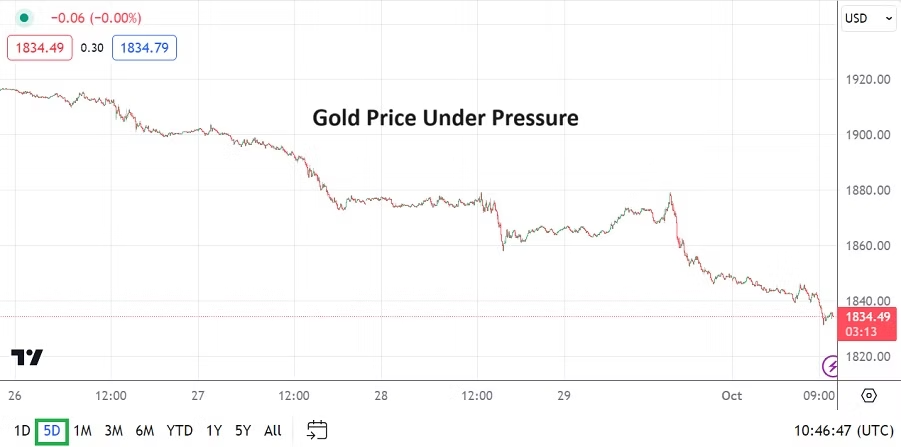
Gold Five Day Chart as of 2nd October 2023
The price of gold has sank substantially in the past week, which shows the USD continues to be strong, and that speculative short-term games within the precious metal must always be kept in mind by day traders. Long term fundamental beliefs regarding the value of gold cannot stop momentary volatility.
GDP results from the U.S last week came in slightly below estimates, but the ability to still sustain growth also creates the suspicion the U.S economy remains stubbornly strong, which effectively puts the U.S Federal Reserve in a rather difficult place. Crude Oil prices have remained high, and this week’s coming jobs data will be important for short and mid-term market participants as they position themselves while nervous behavioral sentiment continues to be evident.
U.S stock markets are near three month lows and trading conditions choppy, this as yields on U.S Treasuries are elevated and create a tough road for speculators to navigate in the short-term.
Monday, 2nd of October, U.S ISM Manufacturing PMI – a reading below 50 is anticipated which would mean sentiment remains negative regarding the U.S economy, but Core Durable Goods Orders came in better than expected last week. Thus, the result of this manufacturing report could play into short and near-term USD trading and cause a ripple as financial houses anticipate the jobs numbers later this week.
Tuesday, 3rd of October, Reserve Bank of Australia – the RBA is expected to keep its Cash Rate in place. If the RBA cooperates with financial institutions and does not change its key borrowing rate , the RBA Rate Statement will come into focus. However, the AUD/USD is still within the shadows of U.S Federal Reserve like most other major currencies.
Wednesday, 4th of October, U.S ISM Services PMI – the outcome from the Services report is expected to fall below last month’s outcome. The slight miss in the GDP numbers last week was noteworthy, but the better than expected Core Durable Goods results will make this report of interest and provide a bit of impetus to the USD and U.S indices before Friday’s key jobs data – particularly if the Services reading is better than anticipated.
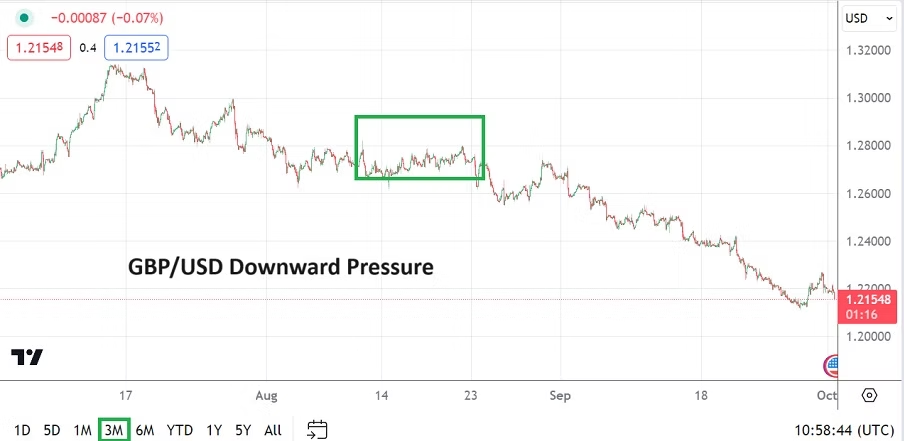
GBP/USD Three Month Chart as of 2nd Oct. 2023
Thursday, 5th of October, U.K Construction PMI – while not considered a major publication by many analysts, the ordering by purchasing managers in Britain may prove relevant as an indicator regarding outlook. The Bank of England held their interest rates in place a couple of weeks ago and this was based on the belief the U.K economy is slowing. The Construction PMI report is expected to come in slightly below last month’s outcome which could set the table for slight choppiness in the GBP/USD which has continued to trend lower.
Friday, 6th of October, U.S Non-Farm Employment Change and Average Hourly Earnings – the combination of these two reports will impact USD trading before their publication and afterwards for several hours. Financial institutions will examine these statistics carefully. If there is a hint of weakness in the U.S jobs market and wage inflation is tame, this could make the USD weaker. However, if jobs hiring remains firm and there is a slight uptick in the costs employers are having to pay workers, the USD could get stronger.
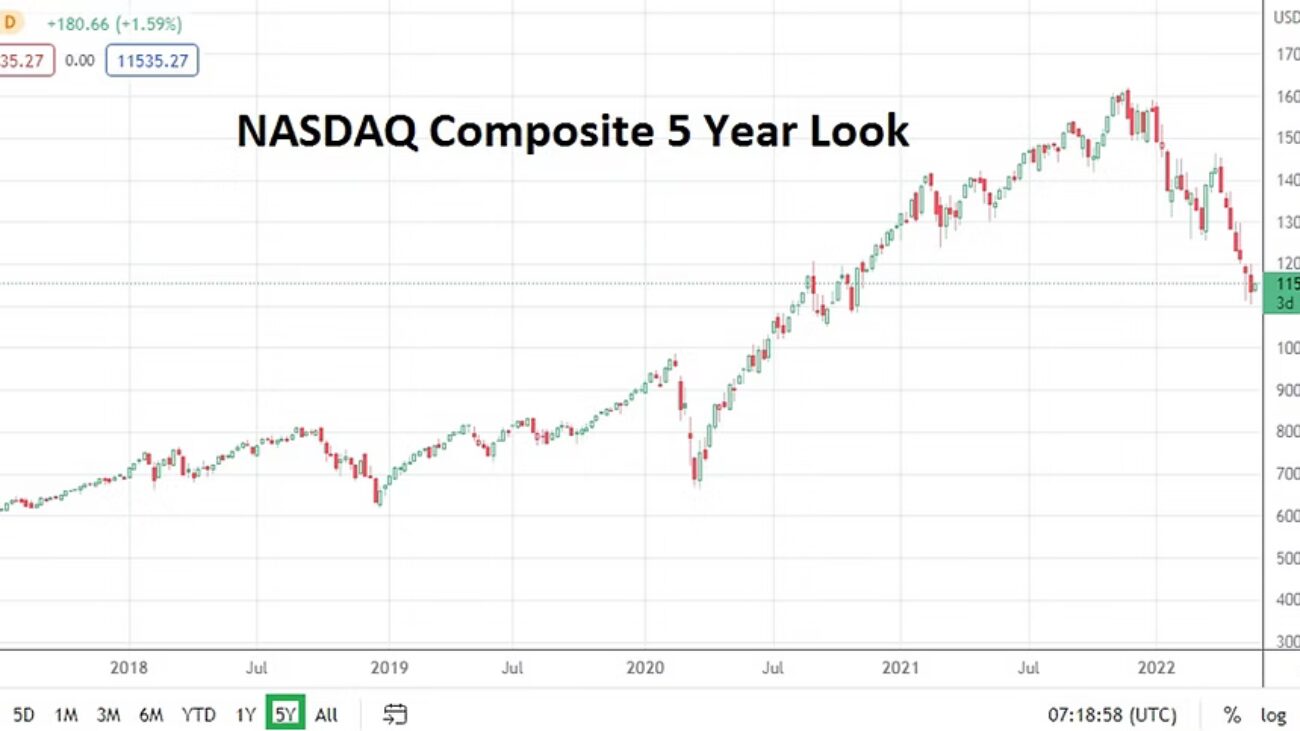
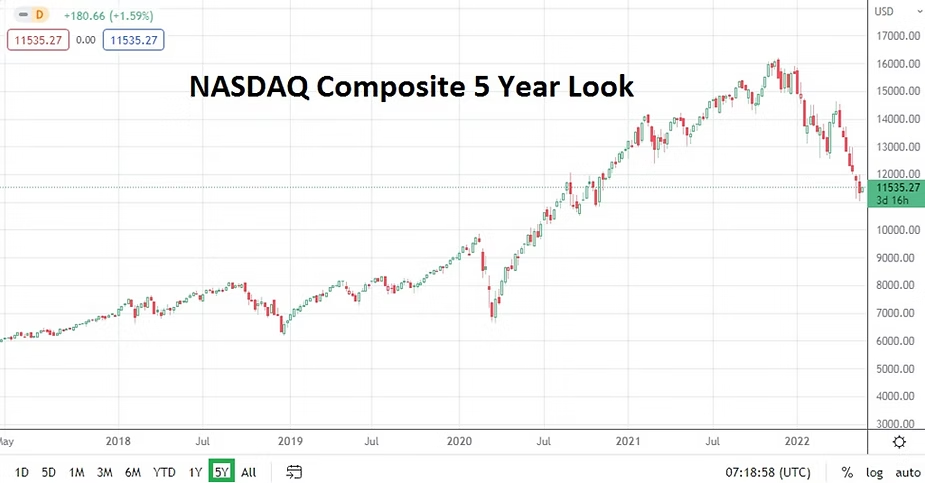
The NASDAQ Composite has been within the grasp of a selling trend since late November of 2021, and traders who feel the urge to buy should understand their goals and time frames clearly.
The NASDAQ Composite has seen a strong wave of selling take hold of its equities since the later stage of 2021. Investors have likely been spooked by inflation and high PE ratios which correlate into questionable values and fears of over exuberance and reactions. The combination of U.S Federal Reserve policy which is certainly having an effect on behavioral sentiment is problematic too. Investors are not fans of unclear outlooks and current economic conditions are definitely causing nervous sentiment.
Many traders and investors have not experienced a sincere bear market during their financial careers. Indices and their equities have produced a rather steady upwards vehicle for years. The thought that an equity index can actually go down for a long duration, without significant reversals higher following is troubling and new for many people. Timing new trends is exceptionally hard. An investor who has a ten year outlook certainly brings a different perspective to buying the NASDAQ Composite compared to a day trader who is likely maneuvering in the index with short term wagers using CFDs.
Current market conditions in the NASDAQ and other major global equity indices remain challenging and this will likely continue into early this summer. The U.S Federal Reserve will be conducting an FOMC meeting in mid-June and another interest rate hike is likely being considered. A potential rate hike of 0.50% may be seen. The potential of this additional hike to the current interest rate of 1.00% has likely been digested into the marketplace by financial institutions, but that is not the end of the troubling concerns.
Technical traders who watch the daily results of the NASDAQ Composite and other indices may attempt to speculate on the gyrations of their moves based on short term volatility. These traders should understand they are also battling large institutional traders who use complex algorithms to pursue their positions. The combination of nervous equity markets caused by uncertain economic outlooks, while it waits on the pronouncements of the U.S Federal Reserve are bound to deliver more nervous results in the NASDAQ Composite and other global equity indices.
While it may be accepted that the U.S Fed will raise interest rates again in June, the greater question that financial institutions want answered is what the U.S central bank’s outlook on additional interest rate hikes in the summer and fall will be. Inflation in the U.S remains troubling high. The rising costs of logistics, food and consumer goods are largely a manifestation of higher energy costs.
Yes, coronavirus has been a large ingredient too, regarding inflation and its current effect on employment and the resulting lack of workers is a component in the equation due to new perspectives among the workforce. The shortage of employable labor has also sparked concerns about demographics for the future. While the virus and its effects seem to have eroded in the West for the time being, unfortunately there are concerns regarding a potentially large problem in China if coronavirus infections continue to occur there. Shutdowns in China due to the virus can affect supply and commodities prices globally.
The costs of higher energy and commodity prices are something that companies and consumers will have to deal with in the months ahead. Disinflation is likely to come, but it may take a handful of months more. It is a complex puzzle and traders who want to bet on short term results will have to endure sudden storms of volatility which are likely to arise. Unanswered questions await and because of the shadows that hover over the economic landscape, clarity is not going to be delivered soon.