postN105.1

India Insider: Agriculture Still Traps Nation’s Workforce

India Insider: Agriculture Still Traps Nation's Workforce

A Field Survey in South India’s Agricultural Towns

India’s growth story is usually told through noteworthy headline numbers. Yet beneath these aggregates lies a persistent imbalance, agriculture continues to employ a large share of the workforce, while contributing a much smaller share of output. This gap shapes income stability, consumption patterns, and the complicated experience of growth across much of the country for many people.

This essay uses field observations comparing two major agricultural towns in Tamil Nadu State in India, Tiruvannamalai and Kallakurichi. After analyzing their respective data and examining how this imbalance plays out on the ground, I offer my perspective.

Typical Agricultural Field in Southern India

Tiruvannamalai: Growth Without Employment Transformation

In Tiruvannamalai district, I visited several areas where housing conditions were poor and informal settlements were widespread. I have visited many households here since 2023. These conditions are now changing, but not in a way that fundamentally transforms employment.

Capital inflows from the neighboring State of Andhra Pradesh have fueled a real estate boom and expanded services such as lodging, restaurants, and transport. While this has altered the physical landscape and raised asset values, it has not created stable non-farm jobs at scale. Employment remains largely informal, seasonal, and low-paid, leaving the underlying agricultural labor trap intact.

Although Tiruvannamalai exhibits a relatively high services share in district GDP, the income generated by this sector accrues from a narrow group of asset owners, intermediaries, and rent-seekers. As a result, per capita income figures overstate the extent of broad-based welfare. A large share of the workforce remains engaged in low-wage service activities with limited income security.

Kallakurichi: Agricultural Dependence, Weaker Services

In Kallakurichi district, the structural imbalance is even more pronounced. Agriculture accounts for a noticeably larger share of district GDP than in Tiruvannamalai, while the services share is correspondingly lower. District level GDDP and sectoral composition data from the Department of Economics and Statistics, Government of Tamil Nadu (2022–23 provisional, current prices), show that agriculture contributes roughly one-fifth of district output, even as a disproportionately large share of the workforce continues to depend on this type of work for income.

This high dependence on agriculture results in extremely low output per worker, widespread disguised unemployment, and chronically weak incomes. Growth exists, but it is concentrated in activities that do not absorb labor effectively.

Gross Domestic District Product Comparison of Agriculture versus Non-Agriculture

Core Problem: Growth Composition, Not Growth Absence

The core structural problem in districts like Tiruvannamalai and Kallakurichi is therefore not the absence of growth, but its composition. Too many workers remain tied to a sector that generates relatively little value. Services and industry have expanded, but not in a manner that absorbs surplus rural labor at scale.

As long as labor remains trapped in low productivity farming, while non-farm sectors fail to provide stable employment opportunities, headline income measures will continue to overstate actual welfare.

Consumption Consequences of Agricultural Dependence

This imbalance has direct consequences for consumption. Towns that depend heavily on agriculture tend to exhibit weak and uneven consumption patterns. Farm incomes are inherently volatile, driven by fluctuations in commodity prices, weather conditions, and market access. In many cases, farmers are forced to sell produce at a discount, incur outright losses, or delay sales under distressing conditions. Only intermittently do they realize meaningful profits.

Chart Comparing Towns of Tiruvannamalai and Kallakurichi in Tamil Nadu

This volatility translates into cautious spending behavior. Consumption rises in short bursts following a good season, but thereafter contracts sharply. This pattern is clearly visible in districts such as Tiruvannamalai and Kallakurichi, where agricultural dependence suppresses steady consumption despite occasional income windfalls.

The same dynamic is visible at State level. Across Tamil Nadu, agriculture employs over 40 percent of the labor force, while contributing a far smaller share of output. The statistics exhibited at the district level are therefore not an isolated phenomenon, but a systemic one.

National Structural Imbalance

Zooming out further, what is visible in Tiruvannamalai and Kallakurichi mirrors India’s broader structural imbalance. Nationally, agriculture employs close to half the workforce, but contributes less than a fifth of GDP. This gap suppresses incomes, weakens consumption, and reflects India’s limited success in industrializing at scale.

India Agriculture as Percent of GDP from 1990s into 2020s

Services have grown rapidly, but they remain reliant on capital and skill intensive, and unable to absorb surplus rural labor in large numbers. As a result, economic growth continues without broad based prosperity. Headline GDP numbers improve, but the underlying structure remains fragile.

India’s central economic scrouge is growth without labor mobility. Until workers move out of low productivity agriculture jobs and into stable non-farm employment at scale, income volatility and weak consumption will remain defining features of the economy. Regardless of how strong the headline growth numbers appear, a national challenge remains.

postN71

India Insider: The 8.2% Growth Mirage Needs a Reality Check

India Insider: The 8.2% Growth Mirage Needs a Reality Check

India is celebrating the 8.2% real GDP growth result for Q2 FY26, as if it has entered a new economic orbit. Politicians are claiming victory and media is packaging optimism. The narrative is simple: India cannot be stopped. But once we move beyond the headline, the number loses credibility. It rests on a broken deflator, a statistical gap that no one can trace, and data architecture that doesn’t consider half the economy. This is not a story of unstoppable growth. This is a story of statistical convenience.

The Production–Expenditure Divide

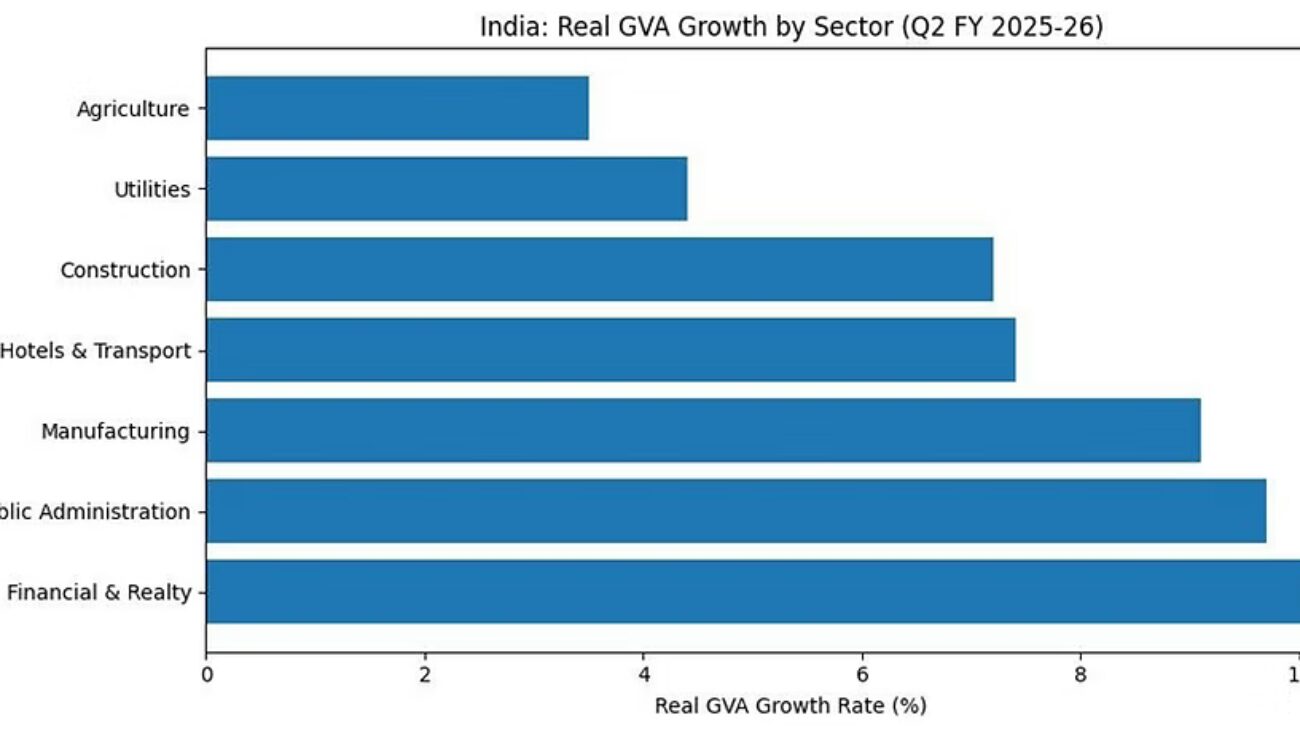
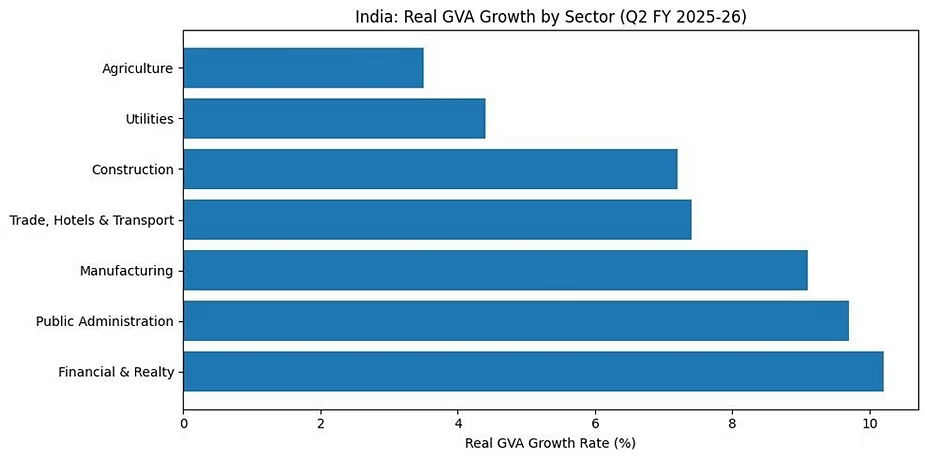
On the production side, the numbers look heroic. Manufacturing allegedly grew 9.1%, and financial and professional services posted more than 10% growth. Corporate India looks like it is flying. But when the same activity is measured from the expenditure side – who actually spends this income – the story weakens.

Private consumption at 7.9% is respectable, not outstanding. The real shock is government consumption, which contracted by 2.7%. A shrinking government should normally mute growth, not accelerate it. Yet the GDP shoots up. How does that make sense? It doesn’t unless the number is being propped up somewhere else – and this is the case.

₹1.63 Lakh Crore of ‘Unknown Growth’

GDP includes a category called ‘discrepancy’. It exists because the two methods – production and expenditure – never perfectly align. The discrepancy stands at ₹1.63 lakh crore ($18.2 Billion USD) which equates into roughly 3.3% of real GDP. That means a chunk of this 8.2% growth has no identifiable spender: No households. No firms. No government.

It is income without absorption. A statistical plug. When a number this large is called ‘discrepancy’, the headline becomes unreliable – suspicious. You cannot claim world beating growth when your own data admits it cannot explain where that growth came from.

Chart via the National Statistical Office

The Deflator Illusion

The next distortion is the nominal vs real GDP gap. Nominal GDP is growing at 8.7% and real GDP at 8.2%. A gap of 0.5 percentage points implies inflation has almost vanished. Every Indian knows this is not true. Costs did not collapse. Food inflation has not disappeared.

The explanation is mechanical: India still uses the Wholesale Price Index (WPI) to deflate nominal output. Global commodity prices fell, WPI softened sharply, and that flattening pushed up the real number. In other words, GDP grew because the denominator fell, not because production surged.

This creates a fiscal problem. The Union Budget assumed 10.1% nominal growth. At 8.7%, tax buoyancy will weaken, deficit targets become more difficult, and next year’s fiscal capability shrinks. Real GDP does not pay the bills, Nominal GDP does.

The Informal Blind Spot

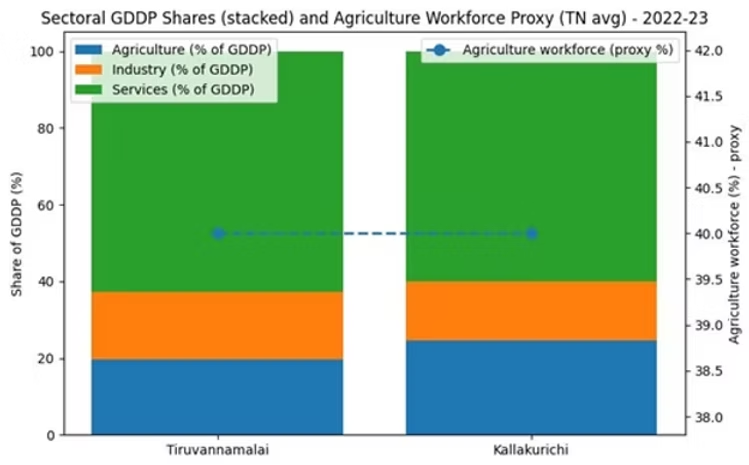
India still cannot measure its informal economy accurately. Nearly half of GDP and employment sits outside the formal system, yet the NSO uses formal sector proxies such as corporate balance sheets, GST data, and financial flows to estimate the rest of the economy. If a small business collapses and a corporate giant expands, the data shows a net gain, erasing distress at the bottom which means real economic circumstances are not portrayed accurately for Indian citizens.

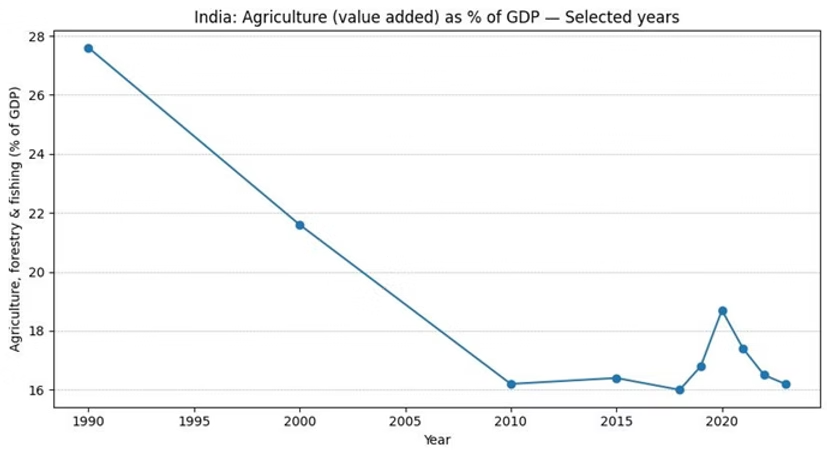
Agriculture grew at 3.5%, but it still supports 46% of India’s workforce. That means growth is concentrated in capital intensive and balance-sheet heavy sectors, not into areas that put cash into rural hands. A booming Nifty Index via the stock market does not translate into household prosperity.

An Economy Measured with Old Tools

India continues to measure GDP using a 2011–12 base year, an era before UPI (Unified Payments Interface), before fintech credit, before e-commerce, before gig workforces, before the pandemic rewired supply chains and consumption patterns. India is living in a digital economy, but measuring activity with analog instruments.

A shift to a 2022–23 base year, plus replacing WPI with a Producer Price Index, may finally align the numbers realistically. But until then, headlines are running ahead of bona-fide measurements.

India’s 8.2% print is impressive, but growth estimates that don’t reflect grounded realities produce illusionary optics rather than useful insights. For India to strengthen fiscal and economic credibility, measurements must capture households, labor markets, and productivity, not solely corporate outputs. Policy cannot be shaped by statistical ambiguity, it requires transparency and trusted data.

post305

India Insider: Affluence Among the Few, Aspirations for Many

India Insider: Affluence Among the Few, Aspirations for Many

A recent report by Franklin Templeton highlighted that India’s per capita income will penetrate the $5,000.00 USD level by 2031, pushing the country into what some analysts consider an affluence trigger zone. Their article celebrates the consumer boom showing the rising sales of premium detergents, growing green tea consumption, and a surge in discretionary spending, as if prosperity has finally crossed over into a mainstream phenomena.

But a closer look reveals something else and a worthwhile critique of Franklin Templeton’s optimistic portrayal.

Who Actually Spends this Money ?

The Franklin Templeton report confidently attributes the wealth effect to rising equities, real estate and gold. Yet, with only 13 crore (130 million) demat accounts in a country of 143 crore people, how can equities be driving broad affluence? Even within those attributed accounts, activity is heavily concentrated in the top decile of income earners like urban professionals in finance, IT and export linked sectors; and over 70% of mutual fund assets under management come from the top ten cities.

The so called upper middle class that fuels premium consumption largely works in these sectors. For the rest of India – especially the 42% still dependent on agriculture – wages have barely kept pace with inflation. Several national surveys and analyses show real wage stagnation since 2015-2016. Data from the Labor Bureau and the National Sample Survey (NSSO) indicates that real wages for rural laborers had near zero growth between 2015-2016 and 2022-2023. In contrast, the period before 2015-16 showed much faster wage growth.

NSSO Survey data compiled by Idea India Magazine

The Concentration of Savings and Spending Power

The report itself concedes that the top 20% of households hold around 85% of India’s total savings. That’s roughly 26 crore people (260 million) driving most of the premium consumption, while the remaining 104 crore (1.04 billion) share only 15% of savings – a stark reminder that aggregate growth often hides skewed realities. And this is why rural households and lower-income urban families, meanwhile, are facing tighter budgets and are actually cutting back on discretionary spending.

Gold as a Survival Cushion

The report romanticizes gold as a symbol of wealth, but in rural India, the precious metal plays a very different role. Gold is not an indicator of luxury and status, but a financial safety net. In villages around Tiruvannamalai City of Tamil Nadu State. Where I have surveyed about 50 families, average holdings are often below 40 grams. When harvests fail or cash flows tighten, this gold is pledged or sold to fund essentials like health expenses, education or seeds for the next planting season.

Yes, some towns in India have higher gold holdings and savings, sharply due to offshore remittances especially in States like Kerala and Gujarat. This remittance led prosperity fuels local real estate and pushes up rents, but it’s a localized story, not a national one. Most rural communities still depend on seasonal income and informal borrowing.

The Uneven Reality Behind Growth

Premium brands are growing faster, but this signals income polarization, not inclusive growth. The per capita income maybe rising, but it’s an average skewed by the top 10-20% who hold multiple assets. For most, consumption is fueled by rising debt. Until wage growth broadens and rural incomes strengthen, India’s  consumption boom will remain the affluence of a few – not the prosperity of the many.

post262

India Insider: Booming GDP & Fragile Foundations of Growth

India Insider: Booming GDP & Fragile Foundations of Growth

India’s economic footprint on the global stage is expanding significantly each year. As the world’s largest democracy, the nation achieved a remarkable 7.4% GDP growth rate January to March of this fiscal year. Yet, beneath this impressive headline, job creation remains tepid, overshadowed by slowing foreign direct investments (FDI) and lower corporate investments from India’s domestic market.

Despite Prime Minister Narendra Modi’s initiative to attract manufacturing into India and boost jobs, the manufacturing share of GDP has stubbornly clung to 16% for the last decade. While India’s services sector accounts around 55% of GDP, the IT and allied services sectors contributes a mere 3-4% of total employment. Even after the last two decades in which India’s Asian neighbors have shifted labor force out of agriculture and into high scale manufacturing, 45% of India’s workforce still are employed in agriculture and aligned services constituting only 15-17% of GDP.

Speculative Capital, Excessive Credit and Rising Financial Risk

Between 2003 and 2023, India attracted approximately $275 Billion USD from foreign capital inflows, encompassing mostly equity and debt foreign portfolio investments. These capital injections are speculative in nature, primarily chasing returns in financial markets, rather than being directly invested into long-term productive infrastructure like manufacturing and export oriented industries.

Foreign Portfolio Investment into India 2003 to 2023

Interestingly, India’s public sector banks especially between 2008 and 2015 aggressively lent to infrastructure, real estate and capital intensive projects. The state owned banks tried to fill the gap left behind by private investors. A substantial share of these loans later turned into non-performing loans, exacerbating a duel crisis as corporate and bank balance sheets came under severe stress within a few years. The government of India stepped in and injected 3.1 lakh crore Rupees ($45 Billion USD) to recapitalize the struggling banks, and also orchestrated mergers of weaker banks with stronger banks. India’s citizens helped cover these costs via higher taxes and hidden banking charges.

Reserve Bank of India: FX Reserves and Liquidity Dynamics 

As of financial year 2025, the RBI’S Foreign Exchange Reserves stand at around $696 billion USD. While a stronger reserve buffer is crucial for maintaining external stability, the Reserve Bank of India’s purchase of foreign currency to build reserves leads to problems with domestic Rupee liquidity and creates liabilities for the RBI’s balance sheet. Unless it’s not fully absorbed via Open Market operations, it will end up as excess liquidity in the banking system.

Post 2020 and the Covid19 pandemic, loose monetary policy and excess liquidity within the banking system has culminated with more reckless lending. Unsecured retail credit particularly in personal loans, credit cards and consumer finance is troubling. Non-banking financial companies (shadow banking) and fintech enterprises also expanded rapidly into this segment and now pose risks.

India Falling into Debt Trap 

Per a recent survey conducted by the RBI,  household financial savings have sharply declined to a five decade low of 5.1% of GDP in FY2023, down from 11.5% in 2021. Concurrently, household liabilities have risen, particularly in the unsecured credit segment.

Delinquencies in small ticket personal loans and “Buy Now, Pay Later“ programs are on the rise, prompting the RBI to intervene recently with tightening of personal loan norms in late 2023. This dynamic suggests that excessive credit creation, unaccompanied by productive or real income growth, is fueling a fragile boom in consumption backed predominately by debt especially among middle and lower income groups.

Lower Net Foreign Direct Investment amid Higher Repatriation

Even with coordinated efforts from the likes of Apple, Foxconn (Hon Hai Technology Group) and other electronics companies setting up facilities, and the assembly of manufactured goods like iPhones as part of the “China Plus“ strategy, a more comprehensive method of doing business and improved proactive FDI policy is needed. Overall results are still falling short. Evidence shows many companies continue to choose Vietnam and Mexico over India, which is clearly reflected in the lower net FDI figures in India’s Balance of Payments. In financial year 2024-25, net FDI fell 96% to $353 million USD, caused by a surge of money being repatriated out of India led by foreign companies, and also increased foreign investments by Indian companies to other nations, per the Hindu magazine.

The irony is that India needs foreign capital to finance its current accounts deficit, long-term capital investment would boost jobs and increase wages. As the central Indian government practices an austerity drive and its corporations show an unwillingness to invest, India needs higher foreign capital at this crucial juncture. How will India achieve this task? Without better employment and raising wages, India’s celebrated growth faces risks from underlying cracks.

postR186.1

Risk Appetite: Forex and Equities and Cautious Optimism

Risk Appetite: Forex and Equities and Cautious Optimism

Day traders can clearly see that risk appetite has taken hold of behavioral sentiment early this week. USD centric price action has created highs for the British Pound, South African Rand, Singapore Dollar and a host of other major currencies paired against the USD. Yesterday’s poor showing via the CB Consumer Confidence reading in the U.S poured additional fire onto the notion the U.S economy is not doing as well as Fed Chairman Jerome Powell expressed last week, which means caution should be used when looking at the broad markets. Speculators who only make short-term wagers cannot let blind optimism be the guiding light.

USD/SGD Three Month Chart as of 25th Sept. 2024

While today will be thin with economic data, Thursday’s Gross Domestic Product results could prove to be another ignition switch for market impetus. The quarterly Final GDP result is widely expected by analysts to produce a gain of 3.0%. The Final GDP Price Index statistics are anticipated to show a 2.5% ratio. If the growth and inflation numbers miss their marks this could set off a momentary storm in the markets. A good example of trading that has already been baked into the cake regarding values and mid-term outlook is the USD/JPY, which while maintaining its bearish stance has clearly found a price realm financial institutions are now maneuvering carefully within as equilibrium is battled.

GBP/USD Three Month Chart as of 25th Sept. 2024

Yet, many financial institutions have clearly leaned further into their optimistic stances particularly via the U.S major equity indices and day traders are likely trying to follow the momentum being generated. Yes, New Home Sales will be published in the U.S today, but these numbers carry a lot of complex considerations which analysts tend to dissect in a myriad of ways, meaning that while they will get some attention, the largest players will stay focused on tomorrow’s growth and inflation data coming via the U.S GDP outcomes.

USD/ZAR Three Month Chart as of 25th Sept. 2024

Forex traders should keep an eye on U.S Treasury yields, yesterday’s slight climbs early in they day were mostly met by reversals lower later on. There is also the knowledge that the yields are traversing long-term depths and there is an assumption they don’t appear ready to see a large shift in momentum. The Federal Reserve is widely expected to cut the Federal Funds Rate again in November by another 0.25%. Numbers via reports like tomorrow’s GDP statistics, and Friday’s Core Personal Consumption Expenditures Price Index will shake existing behavioral sentiment and the Fed’s outlook. The Core PCE number has an estimate of 0.2% per its monthly reading, the last three reports have met expectations.

USD/JPY Three Month Chart as of 25th Sept. 2024

Fed Chairman Jerome Powell will speak tomorrow at the U.S Treasury Markets Conference in New York, but his remarks will have been pre-recorded and presented via video. Treasury Secretary Janet Yellen will also speak afterwards at the meeting. However, their thinking is widely known and they are expected to sound rather tame. It also needs to be added that both Powell and Yellen are fully aware the U.S Presidential election is approaching. Neither one of them is going to risk saying something that can be interpreted as economically defiant.

Traders should expect the potential of volatility developing tomorrow as financial institutions and larger market participants position for the GDP reports, but if the numbers are within sight of expectations, it is likely current price equilibriums will continue to reflect current risk appetite dynamics. Proper risk management and the use of conservative leverage should be fully practiced. Retail traders should also begin to start considering that Non-Farm Employment Change data that will come from the U.S on Friday, October the 4th. The jobs numbers next week could pose a significant threat.

The Fed last week made it clear they believe there was reason to lower the Federal Funds Rate (while playing catch up) and there is the potential to enact further dovish actions in the months ahead. However, Jerome Powell also insisted – paraphrasing – the U.S economy is rather strong and added this is being reflected in solid growth statistics and a jobs market which may be weaker but remains stable.

Given the Fed’s propensity for a conservative approach, they have crawled out a rather precarious limb regarding their rather positive attitude. The coming economic data will certainly be noteworthy tomorrow and Friday, and via next week’s job numbers. Will optimistic equilibrium in Forex prevail over the next week? The major currency pairs will certainly be tested.

postN38.1

Reactions and Risks as Trading Clarity Remains Hard to Grasp

Reactions and Risks as Trading Clarity Remains Hard to Grasp

While many U.S government officials try to shrug off the downgrade of U.S Treasuries by Fitch Ratings last week, a warning shot has been fired regarding U.S spending and the nation’s growing deficit. Janet Yellen and others may believe the downgrade should not have happened, but the prospect that the U.S golden goose is going to stop eventually producing enough eggs is a realistic viewpoint from Fitch. Risk adverse trading on the news was seemingly sparked from the U.S Treasuries downgrade, while many prominent figures including Warren Buffet have claimed they are not worried. However, one thing that the downgrade did was certainly create more clouds for financial institutions which have already been suffering from a lack of clarity the past three weeks.

U.S economic policy remains troubling regarding its spending, and while the government believes its bonds will remain the best in the world for the foreseeable future, it would certainly help matters if responsible ‘adults’ would be allowed a voice regarding stimulus, expenditures and debt ceiling concerns. The U.S has been warned, but with a major presidential campaign approaching on the horizon, more promises to the U.S public will likely carry greater long-term costs.

Gold One Week Chart as of 8th August 2023

While the USD did get stronger across Forex and gold finished last week near lows, some major currencies finished Friday with slight reversals higher against the USD before going into the weekend, based on the weaker than anticipated Non-Farm Employment Change outcome. However, Average Hourly Earnings came in slightly higher. The rise in wages for employees wasn’t expected, but the gains via the inflation number may not have been considered significant enough to cause a panic.

Day traders trying to navigate through the news of the ratings downgrade and the mixed jobs numbers from the U.S may have gotten ripped apart from the volatility late last week. Forex brokers likely had a good week if the majority of their speculators were ‘B’ book – virtual – traders. Survivors of last week’s dynamic price action should be aware that financial institutions do not have the best of outlooks for global central banks. This week’s coming data may help a bit, but trading could also remain rather dangerous and churn volatility.

Global Outside Influence to Give Attention:

Although Niger may seem like a world far away for most day traders, they should keep an eye on the developments of the African nation. A military coup has gotten the attention of global powers and there are threats of military intervention rattling. France, the U.S and Nigeria and other ‘Western’ leaning nations have a stake in the Niger drama, on the other side is Russia and its Wagner affiliated mercenaries. The potential for a war to to start in this landlocked northern African nation appears to be growing. A conflict in Niger could include a wide range of competing sides and create loud rhetoric and hyperbole. It could also cause uncomfortable feelings at the BRICS summit scheduled to begin on the 22nd of August in Johannesburg, South Africa.

GBP/USD One Month Chart as of 8th August 2023

Monday, 7th of July, U.K Halifax Home Price Index – this data is expected to remain rather stable, but the past three results have been negative. Mortgages are getting expensive in the U.K and the pressure added from higher interest rates is not helping. The GBP/USD could react briefly to this outcome.

Monday, 7th of July, E.U Sentix Investor Confidence – the reading is anticipated to be worse than last month’s outcome regarding investor outlook. The past three months have been negative. The E.U is certainly facing recessionary pressure. Oddly enough, a poor outcome could spur on the belief the ECB may have to become less aggressive regarding their higher interest rates. The EUR/USD may see a flurry of reactions from this report.

Tuesday, 8th of July, China Trade Balance – the results will get plenty of attention because recent economic data from the nation has been troubling. Export demand is important for China’s economy.

Tuesday, 8th of July, Germany Final Consumer Price Index – the result is expected to match the forecast of a 0.3% gain. This inflation report will be watched by EUR/USD, but if expectations are met this could create rather consolidated trading until Thursday for the currency pair.

Wednesday, 9th of July, China CPI – the inflation data from the nation will be watched by global investors. Recent statistics from China have signaled concerns about ‘deflation’. An outcome of minus -0.5% is expected. Economic issues are shadowing China, this as it remains active in global affairs.

Last week Argentina announced China helped facilitate a ‘bridge loan’ for the South American nation so it could make a repayment to the IMF. Rising economic concerns in China could start to squeeze its ‘cash power’ as it tries to gain influence globally by pumping Yuan (CNY) into international finance. China has certainly been bold and is playing a ‘long game’, because its choice of Argentina as a nation to help can certainly not expect to produce short-term financial gains.

Thursday, 10th of July, U.S CPI – Consumer Price Index results from the States will cause potentially dynamic broad market movement. Inflation is expected to match last month’s rise of 0.2% via the broad and core numbers. However, traders should note that some analysts have voiced concerns rising energy prices the past month will hit the inflation numbers, if this occurs it could spark a volatile USD. Higher Crude Oil prices combined with a streak of U.S hot weather may create an intriguing outcome. Risk management should be used by day traders who are wagering in the markets as the CPI readings are released.

Friday, 11th of July, U.K GDP – the Gross Domestic Product numbers will be important immediately for the GBP/USD. Although last month’s outcome was slightly stronger than anticipated it was still negative with a minus -0.1% reading. The growth number this time around is expected to gain 0.2% per the monthly report.

Friday, 11th of July, U.S Producer Price Index – economic numbers from the States have been mixed recently. These inflation numbers are expected to show a slight rise, if the outcome meets expectations – the broad markets may remain calm. However, if inflation is stronger than expected, the result could set off fireworks if the outcome sets off fears about the U.S Fed maintaining it hawkish rhetoric.

postR163.1

Caution as GDP and Reactive Sentiment the Key for the Week

Caution as GDP and Reactive Sentiment the Key for the Week

Forex markets have seen plenty of sideways action with the USD Cash Index lingering within the weaker parts of one and three month ranges. Yes, financial institutions appear to be leaning towards a belief the Federal Reserve will have to become more dovish over the mid-term, but last week’s price action before the onset of the long holiday weekend which has just passed did start to produce headwinds.

Risk appetite although high has climbed down from its peaks for the moment. Yet, financial institutions, investors and day traders likely still are aiming for more optimistic results. Speculative inclinations may believe more weakness is about to come from the USD, and major currencies are within sight of important technical barometers which could fuel more bets on a weaker USD to develop.

USD Cash Index One Month Chart on the 28th of May 2024

A taste for speculative buying in the equity indices while running out of some power last week remains within sight of highs. The Dow 30 and S&P 500 might have come off their records along with the Nasdaq, but the slight declines may be viewed as a buying opportunity by day traders.

However, before retail speculators dip their toes in the water they should understand that the Gross Domestic Product numbers this week will factor into existing behavioral sentiment. Again, taking a position for a short-term wager is different than buying an equity index as a long haul investment vehicle. The two are not the same and the daily fluctuations, even the weekly movements of the equity indices, do not bother investors who are gearing their outlooks for the long-term, while short-term moves can wipe out a person using too much leverage if they are pursing a casino like belief in direction without solid risk management.

Dow 30 Index One Month Chart on the 28th of May 2024

Yesterday’s holidays in the U.S and U.K have likely given financial institutions a chance to reflect on events and outlooks which will be unfolding and affecting sentiment. The announcement on Wednesday of last week that Britain will have a national election on the 4th of July will certainly start to create concerns for the GBP/USD.

USD/ZAR Six Month Chart on the 28th of May 2024

Tomorrow the South Africa election will be held. While not an event which will get the attention of all investors, the implications of the vote in South Africa and the potential for a coalition should be watched. If the African National Congress is forced to form a coalition, investment managers will be hoping that the political maneuvering doesn’t bring about a ‘hard-left’ ruling government. Again while the investment stakes may not be felt by everyone around the globe concerning the results in the South Africa election, its impact on geopolitics long-term could be substantial.

International mining companies with large amounts of infrastructure and investment in the nation will certainly be keeping their eyes on events. There is a high level of suspicion within South Africa that load-shedding (rolling electrical blackouts) which has largely disappeared the past few months could reappear after the election, which highlights some of the distrust citizens have regarding the current leadership. The ANC has been in power for 30 years and tomorrow’s election marks one of the first times their leadership may prove vulnerable.

Gold Six Month Chart on the 28th of May 2024

As a clue for speculators and the level of complexity being seen in the financial markets near-term is that the price of gold remains elevated. Although not at its apex values, the price is certainly within sight of highs. What is interesting is that the record levels have taken place as USD centric attitudes have turned weaker the past month, showing that their is likely a large speculative presence within the gold market.

Certainly governments via central banks and other investors could be buying gold. The apex values in gold coupled with weaker USD sentiment which has developed the past month shows that nervousness still lingers. Again, long-term players in gold have much less to fear than short-term day traders who are betting on intraday price changes. Gold is a remarkably strong inflation hedge historically, but retail wagers on the price of the precious metal is a constant battleground. If the USD stays weaker over the mid-term it will prove very interesting to see where gold starts to display a durable support level – if in fact it is tested. There are gold bugs who certainly believe the price of the commodity should be much higher in relation to the unreliability of paper money in many spheres.

For traders who are looking ahead to the economic data risk events, the price of WTI Crude Oil needs to be given attention too. The price of the energy source remains under 80.00 USD per barrel which is important. If the costs of WTI Crude Oil remains stable this may cool some inflation fears. It should be noted that OPEC will begin conducting a conference to discuss Crude Oil production on the 2nd of June.

Tuesday, 28th of May, U.S Consumer Confidence via the Conference Board – the University of Michigan Consumer Sentiment numbers came in slightly better than expected last week. However, today’s reading is expected to be slightly lower than the previous result. Weaker than anticipated data could actually help the USD remain within its bearish technical range in Forex.

Wednesday, 29th of May, Germany Preliminary Consumer Price Index – this CPI result will impact the EUR/USD. The expectation is for a weaker result of 0.2% compared to previous outcome of 0.5%. If this number matches the expectation, this could put the European Central Bank into a collision course with financial institutions who want the ECB to take on a proactive dovish policy and begin cutting interest rates.

Thursday, 30th of May, U.S Preliminary Gross Domestic Product – the growth and Price Index numbers via the GDP reports will be significant and cause a large impact in the financial markets. Forex, commodities and equity indices (and Treasuries) will all be affected. The growth number is expected to be weaker than last month’s. Having produced lower results last month, if this GDP statistic is below the anticipated level of 1.3% it could set off fireworks. The GDP Price Index will have many eyes upon it too, and it carries a expected gain of 3.1%. Inflation remains a chief catalyst for the Fed and in Forex. The combination of the growth and price numbers is certain to cause volatility.

Friday, 31st of May, China Manufacturing PMI – economic data from China has been mixed recently, but foreign investment is still weak and the nation is looking for positive outcomes. Traders should keep their eyes on these numbers and also remember that economic results from China are not exactly the most transparent. Consumer numbers via retail spending domestically in China are still struggling. China is hoping to attain better trade relationships in Europe, but its intentions are running into a more competitive export landscape and political complications which are making the chances for a quick fix for its economy elusive.

Friday, 31st of May, U.S Core PCE Price Index – this report should be watched by Forex traders because it is highly regarded by the Federal Reserve as an inflation gauge. An outcome of 0.2% is the expectation for this report and if met, the USD could turn weaker going into the weekend.

postN77.1

Forex: Behind the Curtain as Speculative Deja Vu Strikes

Forex: Behind the Curtain as Speculative Deja Vu Strikes

Friday jobs reports came in stronger than anticipated on the surface, and this led to a roller coaster like ride for Forex traders as results were acted upon by financial institutions. However, a look behind the data shows ‘positive’ results were spurred on by part-time hiring and government influences leading to a notion that jobs numbers were not exactly a ray of sunshine regarding U.S economic health. The suspicious results cause a desire to look for ulterior motives, and to wonder if election year politics are playing a role in the U.S employment picture.

GBP/USD Six Month Chart as of 9th April 2024

The GBP/USD and EUR/USD are rather insightful for technical and fundamental traders. The currency pairs are languishing as of today’s values near pricing that was seen in the second week of December. Since the ‘announcement’ from the U.S Federal Reserve on the 13th of December that a change in monetary policy would begin to occur in 2024, in actuality nothing has really happened, except government ‘speak’ trying to sound as if everything is understood and in control, while it is clearly not.

Economic data from the U.S and Europe has continued to be soiled by mixed results, and retail speculators looking for a trend to emerge have had to deal with choppy conditions. Financial institutions remain unclear about interest rate outlooks. The Fed while trying to ‘sound’ dovish rhetoric remains locked within a Google engine keyword mantra as they mutter the phrase ‘over time’ when trying to convince people that interest rates will ‘eventually’ be cut.

Last week leading up to the Non-Farm Employment Change numbers, many FOMC members were offering cautious tones about the Federal Funds Rate and warning it should not be changed yet. The implication of the Fed’s verbiage could lead some to suspect they have all practiced statements handed to them by their overlords who are concerned this is an election year and jobs are in jeopardy.

EUR/USD Six Month Chart as of 9th April 2024

Which leads us back to Forex and all financial assets, as investors try to swim waters which have left fundamental perspectives grasping at data which is not easy to decipher. U.S government policy is practicing fiscal spending that is causing massive debts, and perhaps influencing hiring data which may be more akin to putting lipstick on a pig. Many U.S voters seemingly lean towards electing officials who promise to hand out the biggest ‘social rewards’, while ignoring there will be a price to be paid down the road.

The Federal Reserve in the meantime tries to sound optimistic about inflation eroding, but concerns due to U.S government debt being accrued, and global geopolitical affairs combined with energy policy which is making it more expensive to maintain cheap transportation, efficient agriculture and manufacturing, shadow the Fed’s hopes. WTI Crude Oil remains over 86.00 USD per barrel. Gold is trading at record high values and above 2300.00 USD. Does anyone see the dangerous connections? Equity indices should be watched as a barometer this week.

USD/JPY Six Month Chart as of 9th April 2024

Monday, 8th of April, Japan Average Cash Earnings and Economic Watchers Sentiment – yesterday’s reports matched expectations regarding wages, but workers surveyed noted their concerns about incremental inflation which is being seen in Japan. The USD/JPY is challenging November higher values and the Bank of Japan has been widely criticized for not raising interest rates more aggressively. However, it is possible the BoJ wants the Japanese Yen to remain within its weaker price range to spark a stronger Japanese economy via exports.

AUD/USD Six Month Chart as of 9th April 2024

Tuesday, 9th of April, Australia Westpac Consumer Sentiment – the results via the consumer reading came in negative. The AUD/USD like the GBP/USD and EUR/USD is traversing values tested in the second week of December 2023, leading to the feeling of deja vu.

Wednesday, 10th of April, U.S Consumer Price Index – you have heard this before, the inflation reports from the States are going to rattle the financial markets including Forex. The USD is certain to react. Data from the U.S has produced surprises aplenty in the past few months. The Consumer Price Index is important and day traders certainly need to pay attention.

Thursday, 11th of April, European Central Bank – the ECB is not expected to change its Main Refinancing Rate, but many analysts believe they should cut borrowing costs. However, the ECB will likely remain within the camp of choosing to ‘wait and see’. The ECB Press Conference with Christine Legarde has widely become regarded as an opportunity for political speech as much as an economic dialogue. Recent data from the European Union suggests the worst of the recessionary cycle is gone, but German Trade Balance numbers released on Monday were negative, highlighting hurdles remain. Inflation is a worry, and a cut to the interest rate might be able to help spur on economic activity while counting on lagging data to prove proactive policy should be implemented. But this likely is not going to happen and the EUR/USD will remain problematic.

Thursday, 11th of April, U.S Producer Price Index – these slew of reports should be watched carefully. If the data is stronger than expected it is likely a part of the residue caused by higher energy costs that have affected logistics and created more expensive raw materials which are needed to produce goods. It was the higher PPI reports last month that caused dramatic tidal shifts in Forex, speculators should brace for the potential of additional mayhem.

Friday, 12th of April, U.K Gross Domestic Product – last month’s GDP numbers from Great Britain came in slightly higher than expected with a 0.2% gain, this report is anticipating growth of only 0.1%. Traders should take a deeper look at the statistics upon publication and check for revisions to past months. The U.K economy has been struggling, the ‘growth’ results will affect the GBP/USD before going into the weekend.

postN78.1

USD and the Fed: Parade of Jobs Data Ready to Make Noise

USD and the Fed: Parade of Jobs Data Ready to Make Noise

U.S data last week created landmines for Forex speculators and the Federal Reserve. Global financial markets return to full action today following the long holiday weekend. Growth and inflation numbers from the States last week provided more unsettling results for financial institutions. While Forex has proven difficult for many traders, the major equity indexes are flirting with highs but also running into some intermittent headwinds.

US Dollar Index Six Month Chart as of 2nd April 204

In December of 2023 the Fed was interpreted as having confirmed it would be able to cut the Federal Funds Rate during the 2024 calendar year rather consistently. Dovish policy had been anticipated by financial institutions which began to sell the USD aggressively in November. But by the end of the Christmas week the USD had essentially hit lows in many major currency pairs, and as January started reversals intensified.

The last three months of trading has produced choppy conditions in Forex, but one thing is clear – financial institutions no longer believe the Federal Reserve will be able to aggressively cut the Federal Funds Rate. The Fed has now begun to show signs that it is nervous regarding U.S economic data, this as growth via GDP numbers has remained firm, inflation sticky, and consumers resilient. Clouds shadow Forex and day traders have been hampered by a lack of solid trends.

Gold Six Month Chart as of 2nd April 2024

Gold is trading near record price levels. The fact that the precious metal is touching all-time values as the USD has been strong has flustered some speculators. But traders need to remember Gold is affected by large players, including nations, that may be hedging USD bets and preparing for political instability. The price of Gold may underscore belief the U.S Fed will have to cut rates at least a couple of times this year no matter the economic facts on the ground, because this is an election year and if the central bank doesn’t deliver on its ‘promise’ jobs at the Fed may be at stake.

WTI Crude Oil One Month Chart as of 2nd April 2024

Not making anything easier for Federal Reserve policy is the higher price of WTI Crude Oil which has reached the 84.00 USD per barrel price. If energy costs go higher this will not help the fight against inflation. OPEC will be conducting a meeting this week. As an aside the price of Cocoa per metric ton is now over 10,000.00 USD, which is more expensive than Copper. While the price of Cocoa is not a game changer for global financial markets, the higher price will make chocolate more expensive, which some traders may find disagreeable as they try to relax and watch their speculative wagers while trying to nibble on their favorite snack.

Monday, 1st of April, U.S ISM Manufacturing – both the Purchasing Managers Index reading and the Price numbers came in higher than expected. The stronger results show the U.S economy remains better than anticipated by the Federal Reserve, which has been counting on its higher interest rate to slow down growth and inflation.

EUR/USD Six Month Chart as of 2nd April 2024

Tuesday, 2nd of April, European Manufacturing PMI – the European Union and Great Britain will release their business readings today. The results will demonstrate insights regarding sentiment. Financial institutions are worried the European Central Bank and Bank of England may have to consider lowering their interest rates before the Federal Reserve. The EUR/USD and GBP/USD will react to the results.

Tuesday, 2nd of April, U.S Federal Reserve FOMC Members – there will be appearances throughout the day in the U.S from various Federal Reserve members who will make the case for their monetary policy outlooks. It should be noted that Jerome Powell will be speaking on Wednesday. The JOLTS Job Openings will come out before the FOMC members speak. While the JOLTS report will not cause earth shattering reactions, the jobs data is the beginning of the parade regarding employment statistics for this week.

Wednesday, 3rd of April, U.S ISM Services PMI – taking into account the Manufacturing report came in stronger than expected on Monday, the Services data will be watched by financial institutions. If this report is better than anticipated, USD sellers will not rest easy. The ADP Non-Farm Employment Change data will also be released on this day.

Thursday, 4th of April, U.S Weekly Unemployment Claims – the Federal Reserve has been counting on employment strength to erode based on their notion that higher interest rates would create ‘lagging’ reactions in the jobs sector. Jerome Powell has said the Fed is anticipating weaker employment data. The results from the weekly report will not be as significant Friday’s data, but should be given attention by day traders in Forex.

Friday, 5th of April, U.S Non-Farm Employment Change and Average Hourly Earnings – the climax for speculators this week will be these jobs numbers from the States. If the numbers produce less hiring than expected this would help USD bearish momentum. Wages will also prove crucial regarding behavioral sentiment for financial institutions. Simply put, the Federal Reserve is anticipating that weaker employment numbers are going to be seen, if this doesn’t happen it might cause major volatility in Forex going into the weekend.

postN79.1

Forex Volatility and Coming Data Attractions for this Week

Forex Volatility and Coming Data Attractions for this Week

Nervous trading results have hurt many day traders and likely financial institutions too, as behavioral sentiment in Forex gets blindsided by rather mixed U.S data and the Federal Reserve not giving a definitive answer regarding monetary policy. The violent trading in the USD last week was expected, but the turbulence that many Forex pairs experienced on Thursday and Friday of last week was rather vicious. For all the perceived sophistication of Forex markets via financial institutions, the trading results last week point to a definite fear of the unknown.

USD/JPY Five Day Chart as of 25th March 2024

While the Bank of Japan finally changed its interest rate policy and moved to a Policy Rate of 0.10% early last week, this did not create selling momentum in the USD/JPY. The Federal Reserve’s dangling of potential interest rates to come this year caused temporary weakness in the USD, but as financial institutions and their clients looked at the prospects for a more dovish Fed they apparently became unimpressed as the days passed.

WTI Crude Oil Six Month Chart as of 25th March 2024

The Fed seems to be betting on weaker jobs numbers developing, and there has been data which points to part-time jobs increasing, and full-time jobs becoming harder to find in the States. Jerome Powell said last week that if jobs numbers start to show weakness that the Fed would be willing to begin cutting interest rates even if inflation remains sticky. Lagging economic data correlations have not eased the Fed’s problems.

The Fed has also admitted inflation in housing, transportation and food remains problematic. WTI Crude Oil spent much of last week above 80.00 USD per barrel as its price has begun to show signs of rising incrementally again; and there is little the Fed can do about more expensive energy costs should they be seen. Higher costs for logistics will not make anything cheaper. Pricier mortgages, more expensive rent and insurance rates for cars and gasoline is creating serious knock on effects.

And for the sake of acknowledging the screaming prices in Cocoa, please have a look at the chart below which should explain why your chocolate products are going to be more expensive in the coming months. The price of the most delicious commodity in the world has tripled in less than a year’s time and is around 8931.0 USD per metric ton as of this writing.

Cocoa One Year Chart as of 25th March 2024

Gold turned in a violent week of trading too as it reached 2224.00 last Wednesday, only to fall back to a known value around 2165.00. Day traders are dealing with violent cycles in Forex because sustained trends have been nearly impossible to find. While U.S equity indices are fighting upwards, speculators who are afraid of heights are likely being cautious if they are betting merely on the daily results from the S&P 500, Nasdaq 100 and Dow Jones 30 instead of investing for the long-term.

This week’s coming data from the U.S is important, financial institutions are already dealing with plenty of noise, and they will have to be careful regarding their interpretations regarding the coming economic statistics. Meaning day traders who are speculating in all financial assets should use risk taking tactics that are planned significantly in advance.

Monday, 25th of March, U.S New Home Sales – a slight gain is expected, but mortgage rates continue to shadow the housing sector and cause concerns.

Tuesday, 26th of March, U.S Consumer Confidence via the Conference Board – the reading is anticipating a slight increase. Consumer numbers from the U.S have come in mixed recently. A stronger result than estimated might not be welcomed by traders with bearish sentiment regarding the USD. The Fed wants its cake and to eat it too, they would like to see weaker consumer numbers and a soft economic downturn. If U.S shoppers remain confident this could help sustain inflation. It should be noted too, that Core Durable Goods Orders data will be released one and a half hours before the Consumer Confidence numbers.

AUD/USD Six Month Chart as of 25th March 2024.

Wednesday, 27th of March, Australia Consumer Price Index – inflation numbers are expected to come in slightly higher than the previous results. Like most other central banks, except for the BoJ, the Reserve Bank of Australia would enjoy seeing inflation erode. The AUD/USD will react to the results certainly, but the price action might prove complicated because of USD centric notions.

Thursday, 28th of March, U.S GDP, Weekly Unemployment Claims, Pending Home Sales, and Revised Consumer Sentiment from the University of Michigan – put bluntly day traders will have to be well prepared for the combination of data from the States. Spectators who do not have large trading accounts and cannot take on a great amount of risk, should seriously consider sitting on the sidelines until most of the data is published. The GDP numbers will be watched carefully, while they are expected to match last month’s total, any surprises will affect the USD immediately in Forex. Weaker growth numbers might cause USD sellers to ignite positions.

However, before traders react too much to the Gross Domestic Product numbers, the Weekly Unemployment data will also impact the financial market. Financial institutions are anticipating a higher amount of unemployment claims this week. Also, at the same time as the growth and jobs numbers, the Final GDP Price Index numbers will be brought forth. The mixture from these reports could cause speculative whiplash.

The housing sector numbers and consumer numbers which come one and a half hours later will finish off a very big day for traders and institutional investors. The wide array of data could make this coming Thursday rather loud, and again rather dangerous for retail traders to participate.

Friday, 29th of March, Japan’s Tokyo Core Consumer Price Index – the inflation numbers are expecting to show a slight decrease to 2.4%. The result should certainly be watched by USD/JPY and GBP/JPY traders. If the number were to come in higher than expected, this could cause additional volatility for the Japanese Yen. Financial institutions seemed to indicate last week they would like to see the BoJ become more aggressive with their Policy Rate.

Friday, 29th of March, U.S Core Personal Consumption Expenditures Price Index – the reading is expected to be below the previous month’s total. Traders should be on the lookout for revisions to past results. Financial institutions know this inflation number is important for the Federal Reserve, but they are concerned the U.S central bank doesn’t have the ability to combat inflation which is not part of the Core number. Energy and food costs which are hurting U.S consumers are not part of this report and likely making the Federal Reserve gun shy regarding monetary policy – which has caused a large part of the USD whipsaw trading results that Forex has experienced.

post 189

Forex and Equities Storm: Crucial Data will Impact Markets

Forex and Equities Storm: Crucial Data will Impact Markets

Today will start out with a rather important consumer report from the U.S and day traders should stay alert. It is easy to point to every day and week as being a crucial circumstance for speculators, because that is what gets their juices moving and gets them to wager in the markets.

However, given the rather choppy conditions in Forex seen since the last week of December and pointing to the results of the Consumer Price Index on the 13th of February and the storms created in FX, traders hopefully have enough muscle memory to remember how they felt in the midst of the whipsaw conditions which were experienced only two weeks ago.

Central bank outlooks are fragile among analysts and financial institutions. Simply put this week’s data could prove to be more important than the CPI numbers. Consumer sentiment, GDP, and inflation statistics are all on the U.S roll call this week.

Other geographies will make news too and impact global markets. Last week’s impressive results from Nvidia created another massive wave of positive momentum in equity indices. The Nasdaq 100, S&P 500 and the Dow Jones 30 all have hit record values. Japan’s Nikkei 225 has surpassed record heights.

Yet, other barometers do highlight caution abounds too, U.S Treasuries yields have edged upwards and are touching values which show there is nervousness regarding monetary policy from the U.S Federal Reserve. This week’s data will deliver more insights for investors, and Treasuries are certainly going to react to the economic reports.

Gold One Month Chart as of 27th of February 2024

Gold has edged higher in the past week and is around the 2034.00 USD mark as of this writing. The slight climb above the 2020.00 ratio which has worked like a magnet recently, indicates some traders may be leaning optimistically towards a weaker USD mid and long-term. These folks may be proven correct, but day traders should note that the 2030.00 ratio in gold is below highs seen in December, January and early February – which indicates nervousness. If day traders do not believe gold acts as an inverse barometer for the USD, simply look at the results of trading when the stronger than expected CPI numbers were released on the 13th of February. Gold fell to a low near 1985.00 on the 14th, this was not a coincidence.

Again, while it is easy to sound alarms and jump up and down and proclaim every week important for day traders, the acknowledgement that this week’s economic data is significant should not be treated as hyperbole. You have been warned.

Monday, 26th of February, U.S New Home Sales – yesterday’s results showed another decline in the housing market, and the previous month’s number was revised downwards. The outcome may point to concerns about U.S mortgage rates which remain stubbornly high for those considering purchases.

Tuesday, 27th of February, U.S Durable Goods Orders – a rather large drop of minus -4.9% is expected. The Core data however is expected to produce a rise of 0.2%. These numbers will be a good precursor for the important consumer sentiment which will follow one and a half hours later.

Tuesday, 27th of February, U.S Consumer Confidence via the Conference Board – the results of the important readings have shown intriguing gains since late fall in 2023. While improvement in sentiment has been recorded, revisions lower have also been seen in the previous three reports. The outcome of today’s report should be treated carefully. If another higher reading is produced this may create some positive momentum in the USD momentarily.

NZD/USD Three Month Chart as of 27th February 2024

Wednesday, 28th of February, Reserve Bank of New Zealand Official Cash Rate and Monetary Policy Statement – while many Forex traders will be sleeping when the RBNZ makes its important pronouncement, New Zealand inflation data has remained strong and a conservative government is in charge politically that is pro-business. The question is if the Reserve Bank of New Zealand will go against the grain of other global central banks and actually increase their interest rate while others seem to be adamant about trying to become less aggressive. While many analysts believe the RBNZ will sit on its hands and act according to the whims of others, if an interest rate hike is announced global Forex traders should take note because it would be a signal that central bankers are uneasy regarding their rhetoric and not in agreement.

Wednesday, 28th of February, U.S Preliminary Gross Domestic Product – a gain of 3.3% is the expectation from many analysts. The previous reading was stronger than anticipated. If growth numbers in the U.S come in higher than estimated the USD will react with strength. The Federal Reserve would like to see the outcome meet the expectation or come in below, this so the U.S central bank can consider reducing the Federal Funds Rate late this spring or in early summer. However, if a significantly strong growth number is demonstrated this would cause turmoil in Forex.

EUR/USD Six Month Chart as of 27th February 2024

Thursday, 29th of February, Germany Preliminary Consumer Price Index – a slight gain is expected in the inflation number. The EUR/USD has been struggling as stagflation concerns shadow the European Union. A higher inflation result will not be welcomed by the ECB, which would prefer to cut interest rates sooner rather than later. The German number should be watched and it will cause an impact if there is a surprise. The EUR/USD has been turbulent and is likely to produce more choppy conditions depending on the parade of data results this week.

Thursday, 29th of February, U.S Core Personal Consumption Expenditures Price Index – traders who have felt the previous economic reports already have caused intense reactions this week should brace for this inflation report. A result of 0.4% is expected. The Federal Reserve admits this is one of the most important publications that it monitors. This means financial institutions react to this report too. If inflation were to come in higher than expected, like the CPI results from two weeks ago, this would essentially kill off expectations of a May interest rate cut from the Fed. The USD will react to this report and so will U.S Treasury yields, which means equity indices will also be affected. A weaker inflation report is being wished for by many market participants, but will this be the result?

Friday, 1st of March, China Manufacturing PMI – not to beat a dead horse, but China’s economic data has been poor and this report will be viewed as important. Another negative outcome is expected. Transparency regarding economic numbers from China is a worry for investors. Conditions in China are being watched and it is important for traders to eliminate bias regarding their perspectives. China may be struggling, but its importance as an economic power is still very much in evidence. Foreign direct investment into China is diminishing, but plenty of investors still have ‘skin in the game’ and will be affected by the manufacturing reports.

Friday, 1st of March, U.S Manufacturing PMI via ISM – a slightly improved manufacturing reading is expected. However, because of the U.S data releases from the previous days, the results may be looked at only momentarily and not cause much of a reaction from market participants. Traders may be looking forward to the weekend after this week’s economic publications in order to rest.

postN87

AMT Top Ten Miscellaneous Clues for the 26th of January

AMT Top Ten Miscellaneous Clues for the 26th of January

10. Sports: Australian Open Tennis Tournament Finals this weekend. And five episodes into Netflix’s Six Nations: Full Contact there has been NO mention of rugby national teams in the Southern Hemisphere. Bias?

9. Money Club: Microsoft has joined Apple with a market cap over 3 trillion USD, the only two companies in the world able to make this boast.

8. Democracy: India elections coming in April and May seem to have a predictable outcome, but the South Africa voting date has not been made official and the ANC is under pressure. U.S citizens appear set for a rematch of Biden and Trump in November.

7. Layoffs: Around 1,900 employees of Activision Blizzard and Xbox, both owned by Microsoft, will have their jobs eliminated. Microsoft spent about 68.7 billion USD to acquire Activision Blizzard – a deal that was finalized in October of 2023.

6. Nervous: Bitcoin still battling the 40,000.00 USD ratio. Binance Coin has fallen below 300.00 USD, BNB/USD traded near 200.00 USD in the middle of October.

5. Behavioral Sentiment: Gold remains near 2020.00 USD, U.S Treasury yields are in sight of three month lows, but energy prices have ticked upwards this week with WTI Crude Oil near 77.00 USD.

4. Forex Caution Sign: Day traders should be braced for price velocity today. Is the USD going to become weaker going into the weekend?

3. U.S Federal Reserve: FOMC Statement will be on the 31st of January. Yesterday’s GDP numbers came in stronger than anticipated, fueled by robust consumer spending. However the GDP Price Index results were well below their expectations. Some folks may be dreaming about a rate cut in March, but there is still plenty of data ahead.

2. Stock Indices: The S&P 500, Dow Jones 30 and Nasdaq 100 are within record heights. Japan’s Nikkei 225 is challenging values not traversed since early 1990. The values of these indices may be dizzying, but the trend has been hard to bet against.

1. Inflation: Core Personal Consumption Expenditures (PCE) Index reading is anticipating a 0.2% gain today. Last month’s outcome was 0.1%. The U.S Federal Reserve monitors this particular report closely. Financial institutions will react and any surprises will become a catalyst in the broad markets.