Has a Great Selloff Begun? The Fed Holds a Crucial Card
Once upon a time the Federal Reserve caused a massive amount of fear to simmer and then boil over in the global market place but this is no fairy tale, the date was the 5th of August 2024 to be exact. However, the trigger causing events to unfold was pulled on Thursday the 31st of July. The Bank of Japan increased their policy rate to 0.25%, which was an increase of 0.15%. Then later on the same day the U.S Fed published a cautious sounding FOMC Statement followed by an inconclusive Press Conference, which left investors scratching their heads.
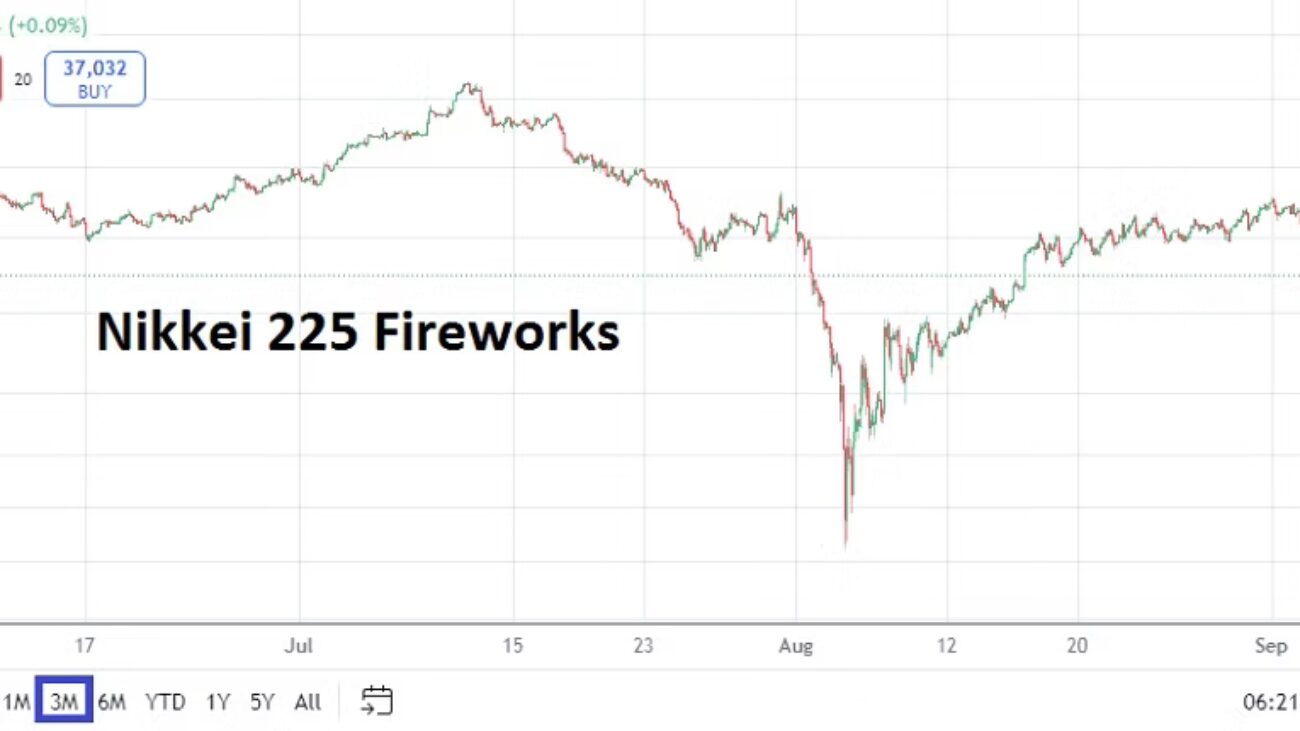
Nikkei 225 Three Month Chart as of 4th September 2024
Markets started to react with scorn on Friday the the 1st of August, particularly when the U.S jobs numbers showed a big miss with the Non-Farm Employment Change numbers, and also a lower than anticipated Average Hourly Earnings report was produced. Because Japan was essentially closed for equity trading when the U.S jobs data was released late on Friday, the Nikkei 225 responded with fury on the 5th of August. Global markets essentially crumbled over the next twelve hours as a massive selloff was sparked.
Some analysts noted the move lower in equity indices was an overreaction and the wild Forex trading would calm down, and this began quite predictably on the 6th of August. In essence the bad jobs numbers from the U.S proved the Federal Reserve was being too cautious and would need to begin sounding more aggressive regarding interest rate cuts. This dynamic played out when Fed Chairman Jerome Powell made his Jackson Hole Symposium speech on the 23rd of August and admitted the Fed would have to begin cutting interest rates – and he seemed to indicate the use of a plural regarding Federal Funds Rate cuts. This dynamic essentially confirmed what most financial institutions had bet on starting in late July via Forex. Equity indices which were able to recover plenty of lost ground after the 5th of August, also built up more momentum per Powell’s rhetoric at Jackson Hole.
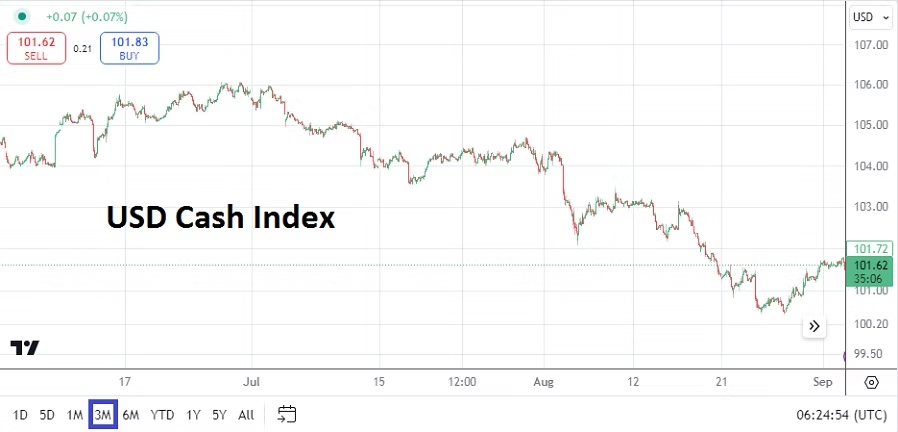
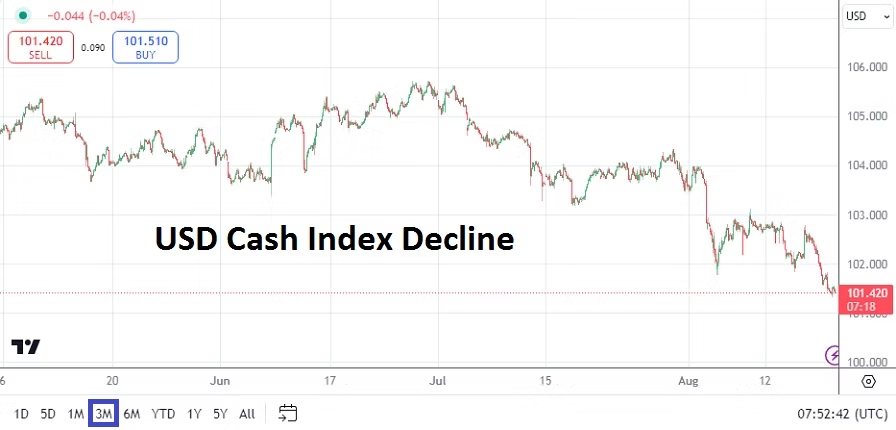
USD Cash Index Three Month Chart as of 4th September 2024
However, Powell while sounding more dovish did not say how much the Fed would cut by in September. And based on the history of the Fed’s rather cautious and very passive monetary policy over the past handful of years, many financial institutions likely felt a cautious outlook should include a 0.25% cut on the 18th of September and then another 0.25% move lower in November. In the last week of August – yes, last week – equity markets started to show signs of nervousness again and the USD began to produce choppy trading before going into the Labor Day holiday.
Yesterday’s large selloff in assets has sparked more worries. While it is clear U.S inflation data has shown signs of erosion, the Federal Reserve has not indicated in any form that a Federal Funds Rate cut of more than 0.25% should be expected in two weeks. And perhaps not so coincidentally, the U.S Non-Farm Employment Change and Average Hourly Earnings data will be published this Friday. The outcome of these two reports will shake the ground for investors and financial institutions may be positioning for the drama.
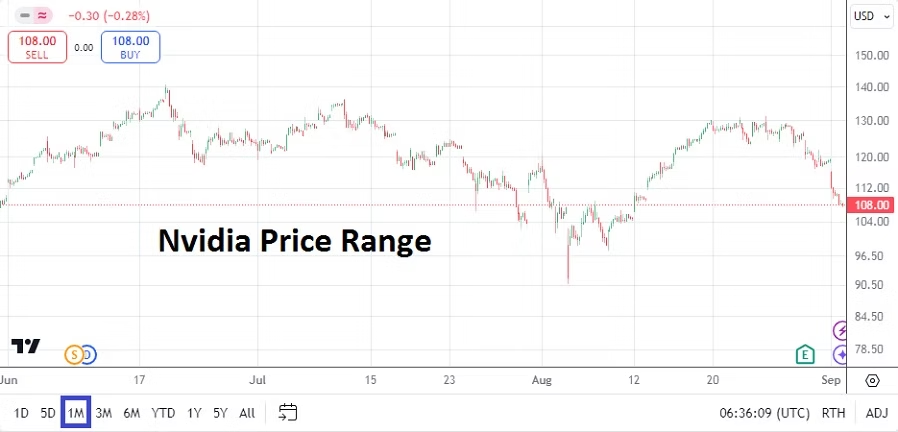
Nvidia Three Month Chart as of 4th September 2024
An interesting three month barometer looking backwards has been created by Nvidia which has been choppy. While it remains only a ‘stock’, the company’s earnings and outlook are firmly on center stage for many investors. Nvidia has soared in value the past year. While some may feel that the asset is within a bubble, the company continues to post impressive earnings and its outlook appears bright as new software and hardware relies upon its products and development promises. Some analysts have said that earnings reports from Nvidia are now just as important as U.S economic data like inflation and jobs numbers. However, that is overstated, but let there be no doubt that Nvidia’s trading results over the next six months will probably tell us a lot about global market conditions and behavioral sentiment within financial institutions.
Day traders should not panic, they have the capability of watching from the sidelines if they choose over the next few days. The USD is still standing on weaker legs and Gold remains near 2,500.00 USD. Investors who have long-term holdings will certainly be nervous and want to make sure their mid-term yield perspectives are alright and their long-term targets are safe. Speculators small and large know the Fed will definitely cut the Federal Funds Rate in September. Yet, the trillion dollar question is if the Fed will only cut by 0.25%?
Gold Three Month Chart as of 4th September 2024
If the U.S jobs numbers this Friday come in below anticipated results once again, the Fed should strongly consider a 0.50% basis cut to the Federal Funds Rate on the 18th, that is what financial institutions would certainly like to see. They should also consider coming out with a brief statement this Friday to make sure investors know that a more aggressive stance will be taken if the jobs numbers are weak. However, as long time day traders and investors know, it is not in the Fed’s nature to grab the microphone loudly, unless a seismic event is taking place in the world and inflicting harm on the financial markets. Are investors now trying to warn the U.S Federal Reserve that they will ignite a major selloff unless the Fed becomes more aggressive?
Summer Optimism as Forex and Equities Focus on Fall Outlooks
Fed Chairman Jerome Powell admitted the obvious at the Kansas City’s Fed’s Jackson Hole Symposium last Friday. The realization the U.S Federal Reserve is going to cut interest rates confirmed what many financial institutions had positioned their trading desks for via forward cash Forex contracts over the past month.
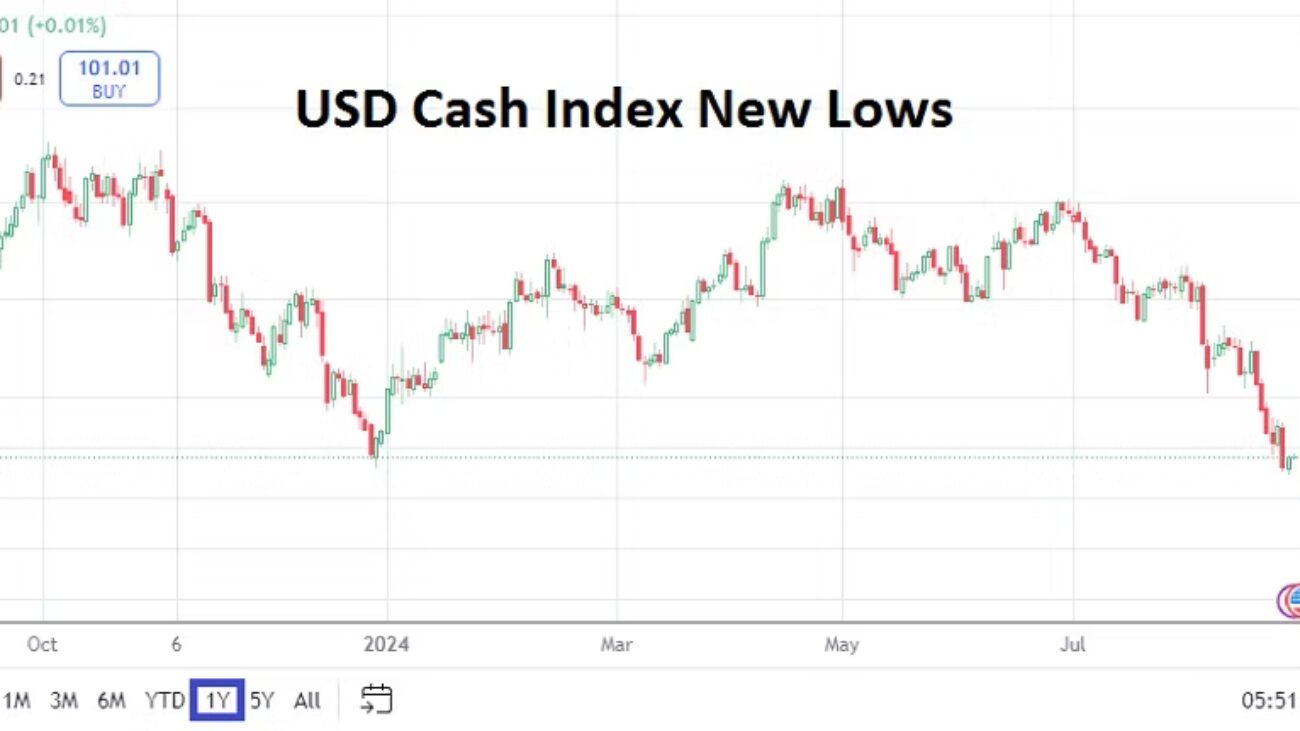
USD Cash Index One Year Chart on the 27th August 2024
The USD has been expected to grow weaker by many people because most knew the Fed would have to state a September rate cut would be delivered. The question that was also somewhat answered is the notion if the Fed will also cut in November. Though Powell certainly did not say a rate cut would happen in November, his rhetoric made it clear the Federal Reserve is considering a dovish perspective which could translate into additional cuts down the road.
The Fed has been criticized for being too passive and while Powell can be congratulated for his rather unemotional Federal Reserve leadership, he and the Fed can certainly be faulted for not reacting quickly enough to ‘transitory’ inflation and then not responding until this past weekend to the need for cutting interest rates with dovish rhetoric. Let’s also remember the U.S Treasury (government) is on the line to pay exorbitant costs for debt repayments because of bad U.S fiscal policy.
As an interesting related side note, the head of the Brazilian Central Bank, Roberto Campos Neto, made a strong appeal for governments to be fiscally responsible while speaking at the Jackson Hole Symposium this past weekend. While he could have been talking to any number of nations regarding spending, his points were obviously meant to highlight his disagreements with the Brazilian government led by Lula da Silva and the Workers Party. Roberto Campos-Neto stated that approximately 50,000,000 (yes, million) people in Brazil receive government allowances, while only about 43,000,000 people are earning money via employment and business enterprises. Traders who want to keep an eye on the USD/BRL this week may be entertained by the potential volatility within the currency pair which is trading a hair below 5.5000 before it opens today. The USD/BRL has certainly not been correlating to broad Forex USD centric weakness, and demonstrates the internal domestic fight between Lula da Silva and the Brazilian Central Bank regarding fiscal policy.
Jobs data from the U.S has continued to turn negative, particularly via revised reports which are being published rather ‘quietly’ as election season approaches. Yet, financial institutions have been aware of the weaker jobs numbers. While the poor jobs numbers combined with eroding inflation is good for USD centric weakness due to the knowledge the Fed will have to reverse from its rather high interest rates, the question becomes how much per the financial institutions selling of the USD has been acted upon in Forex. Is the USD oversold for the time being? It depends on trading timeframes certainly.
Weaker USD centric positions will need more impetus for further bearish trajectories to be seen near-term. Financial institutions may believe equilibrium is being approached, this because it appears interest rate cuts equaling a 0.50% decline seem to have been factored into Forex. Will the Federal Reserve be put into a position in which they will be able to cut by a full basis point (-1.00%) over the next six months?
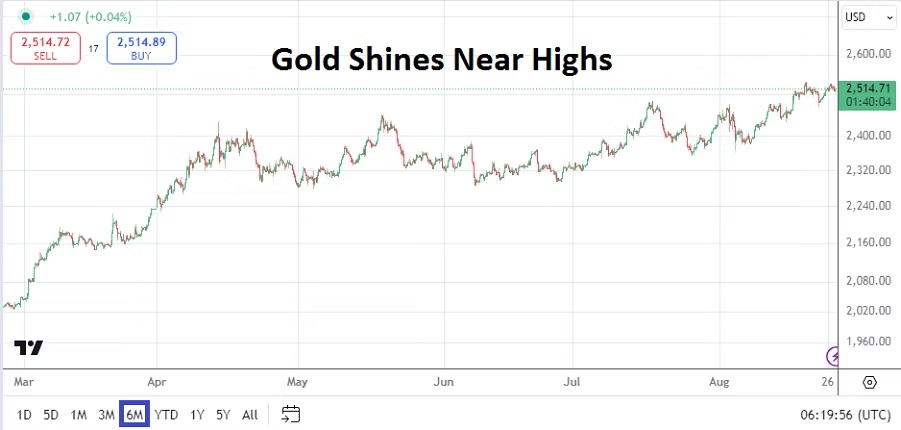
Gold Six Month Chart on the 27th of August 2024
Gold is trading near 2,500.00 plus at the time of this writing. Gold has touched higher levels in the past week and is getting a round of applause from its throngs of believers who proclaim the precious metal the ultimate safe haven against inflation and erosion fears via fiat currencies – including the USD. As a reminder, Bitcoin is highly speculative and doesn’t have the historical (thousands of years) track record that gold has acquired.
GBP/USD Five Year Chart on the 27th of August 2024
The EUR and GBP are traversing higher territories not seen in a while. The EUR/USD is near the 1.11700 level, which was last traded in July of 2023, and it has been since 2022 that sustained prices above this current realm have been traded. The GBP/USD is near 1.32000 and is within a value ratio last seen in March of 2022. Central banks will remain in focus as summer ends and the fall trading season gets underway. The ECB will release their Main Refinancing Rate on the 12th of September, the Fed will present the Federal Funds Rate on the 18th, and the BoE will follow suit with the Official Bank Rate on the 19th.
However, those September dates are still a few weeks away and financial institutions do have data this week which could stir Forex, equity indices and U.S Treasuries in the near-term. Day traders often do not have the ability to rely upon mid and long-term outlooks, and instead have to be content with trying to ride the momentum trends being caused by larger players. While the USD weaker outlook is tempting to rely upon, speculators who are looking for quick hitting wagers need to judge technical charts and try to grasp existing behavioral sentiment which can shift rapidly depending on lengths of time.
Traders should remember the U.S will celebrate its Labor Day holiday next Monday, which sets the stage for potential sudden volatility to flourish before big financial institutions in the States leave for their long weekend. The last week of August should be rather tranquil. Certainly most long-term investors feel as if they have more clarity regarding interest rates and will be able to relax. The hope is that the current calm is not the quiet before the storm due to lingering political issues in the U.S, France and elsewhere. And that escalation of the Ukrainian and Russia war, and the Middle East conflict do not cause sudden surges of bedlam.
Economic data events the remainder of this week that should be given consideration includes the U.S CB Consumer Sentiment reading today. Yesterday’s U.S Durable Goods Orders came in with mixed results as the Core number fell by minus -0.2%, but the broad number came in with a substantial gain of 9.9%.
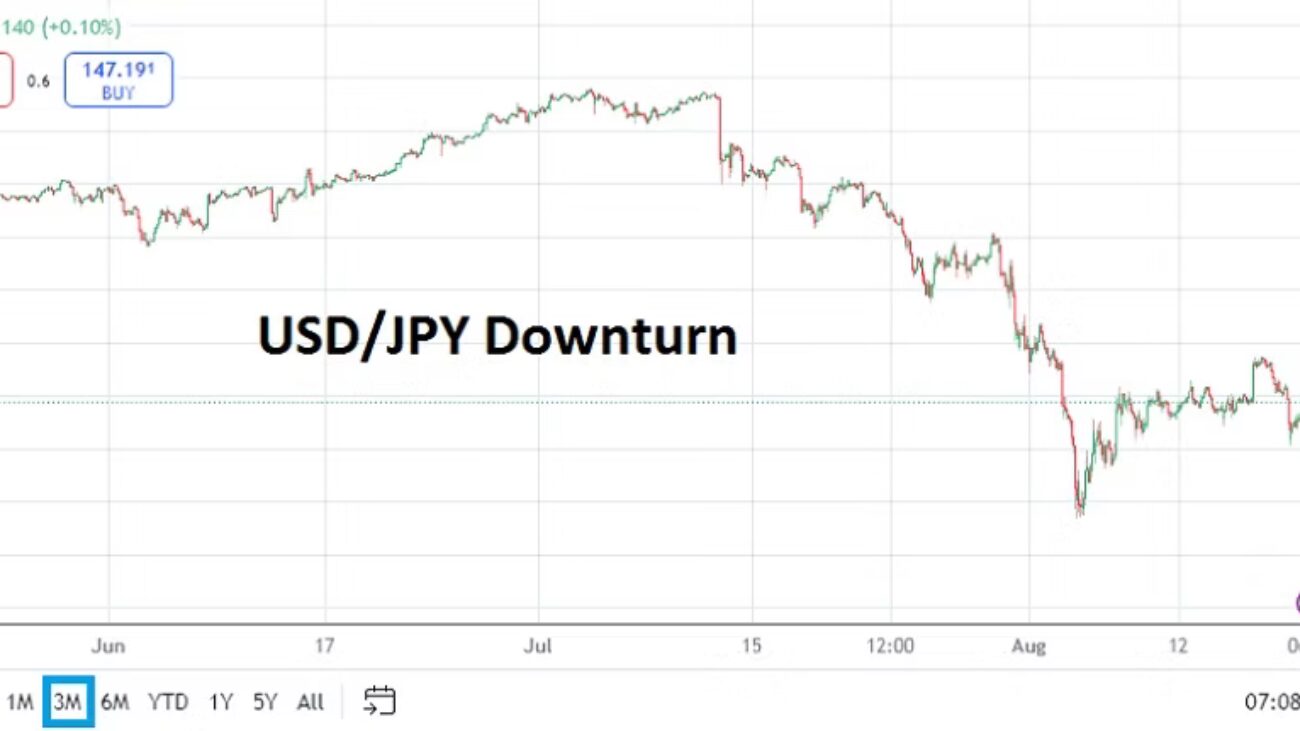
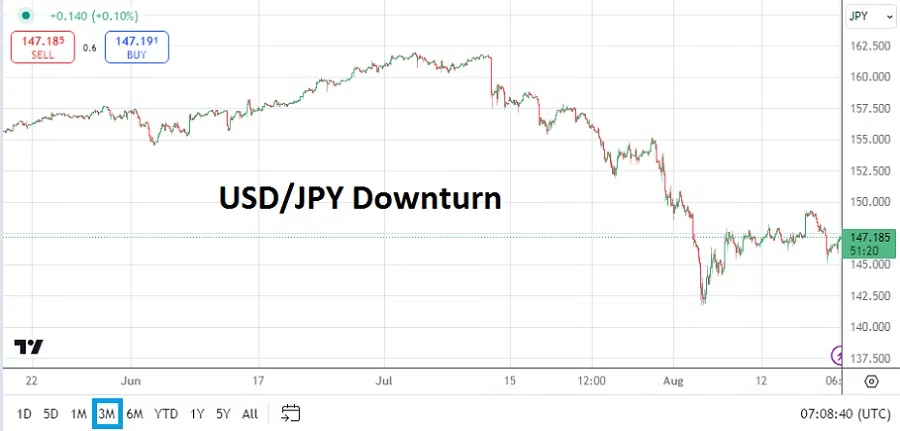
USD/JPY Three Month Chart on the 27th of August 2024
The Bank of Japan has published their Core CPI data today and the outcome came in below expectations with a gain of 1.8% compared to the estimate of 2.1%. The USD/JPY is trading near 144.790 at the time of this writing as it continues to show bearish tendencies. The Bank of Japan which was heavily criticized in many circles may actually be achieving what they have planned, this as they have tried to stimulate stronger export and confront inflation. Their battle is not over yet.
Australian CPI data will be published on Wednesday. And on Thursday, German Preliminary Consumer Price Index numbers will be released. The EUR/USD could react to this report, but the European Single Currency remains highly USD centric. Which sets the table for the U.S Prelim Gross Domestic Product report also on Thursday. The growth number from the U.S could diminish selling considerations for the USD if the report comes in stronger than expected. However, the GDP Price Index and weekly Unemployment Claims from the U.S could also impact short-term behavioral sentiment and cause a bit of turbulence if negative results are published.
Friday will see more CPI numbers from Japan, CPI and GDP numbers from France, and GDP data from Canada. But before going into the long holiday weekend the U.S will present one more major report with its Core PCE Price Index and the monthly statistic is expected to show a slight gain of 0.2%.
China watchers will get Manufacturing PMI numbers early on Saturday. Recent China data continues to show signs of economic stress regarding foreign investment, domestic consumer spending, and deflationary results. Buyers beware.
Telling Someone to Not Trade Works Like Reverse Psychology
From the strange but true file, comes the realization after working within risk analysis for a long time that telling a speculator to avoid a particular market because I believe it is going to be volatile often has the opposite effect. Perhaps the best thing to do is to remain silent and allow inexperienced day traders to lose their money, convincing them to walk away from speculative endeavors forever. But I prefer to constantly teach and warn, while providing help for those who have made the firm decision they want to pursue the financial markets.
It is rather well documented that 90% of retail traders lose their money. And as pointed out within AMT since our inception most brokerage institutions are counting on you to lose money. This because many platforms are letting you trade via CFD assets and virtual Forex wagering, meaning the brokers take the risks that you may actually make money and are willing to pay out your winning bet, because they know most of the time you are going to lose. If not today then tomorrow, because casinos always believe the gamblers will lose.
People ask why I refer to wagers and bets when I write about Forex, commodities and equity CFDs. The answer is because I feel the need to remind speculators constantly they are entering a domain that is akin to gambling. I have come to learn that I cannot stop inexperienced day traders from making costly mistakes by telling them not to trade. New retail speculators can be helped by providing them risk management via basic knowledge and expanding upon the theme. Angry Meta Traders intends to always make risk management and analysis of the markets its core foundation.
Yes, we also provide our insights about potential directions in particular assets constantly, and try to contribute our thoughts on the thinking of the large players within the marketplace. We would like AMT to become a membership pass into the temple for retail traders and the occasional institutional participant that reads our material. Temples are usually the domain for philosophies which have been gained through years of experience and contemplation about the human condition.
While it may sound absurd to discuss temples, experienced traders unless they have been merely lucky their entire careers, know the psychology of financial institutions is always important. Understanding the behavioral sentiment of large players and the quantitative engineering they use to make decisions is crucial. The keys to the inner workings of the financial temples is a metaphor, hopefully allowing day traders to feel like they have been given the ability to look inside and understand the decision making process of large institutions that can move the markets.
Angry Meta Traders is not always right, our analysis and predicted movements about assets are sometimes wrong. Yet, by stressing risk management via limited leverage, stop losses when appropriate (they almost always are), and telling traders to not be overly ambitious, we hope AMT delivers constant reinforcement and needed learning.
The noise of the market can be quite intense, false narratives, and misguided analysis are dangers all traders face, even the most experienced large players and financial institutions understand they will not always be correct. And this takes us back to the notion that trading for inexperienced people is not easy. But I know telling you not to trade works in the wrong way. So what I tell you now is to be patient, learn, gather wisdom as you trade and hopefully you will attain some of the tools needed to make your speculative life easier. Knowing that 90% of traders lose money, we hope that via our efforts to inform that we can put you within the small percentage of people who actually profit.
Tranquility: Forex, Equities and Treasury Yields Drama-Free
Sometimes no news is welcome. The markets though not devoid of drama, have been relatively tranquil. It is obviously summer in the northern hemisphere which helps bring about quiet, this since many ‘active’ market participants are off vacationing having been allowed to go on holiday. The implosion in the markets on the 5th of August after the dangerous riptides created by the combination of the Federal Reserve and Bank of Japan have certainly eased and evidence of the chaos is fading. Retail traders who are always looking at charts and for opportunities may have even been able to rest too the past week and a half.
USD/JPY Three Month Chart as of 20th August 2024
The USD/JPY as of this moment is near 147.185. The Nikkei 225 has recovered lost ground from over-reactive selling on the 5th of August. The value of the Japanese equity index is within extremely intriguing territory as financial institutions are clearly taking a wait and see approach regarding more BoJ and Fed rhetoric, combined with fundamental analysis of Japan’s economy and their companies in consideration. It is a healthy market dynamic, particularly via a notion the Nikkei 225 having reached an early August equilibrium is a solid result, this if you have a long-term viewpoint.
Nikkei 225 Three Month Chart as of 20th August 2024
The GBP/USD, EUR/USD, USD/SGD have all seen better results for traders who have been wagering on USD centric weakness. Even the USD/ZAR has produced a solid trajectory. U.S Treasuries yields are falling.
Gold Six Month Chart as of 20th August 2024
Yes, day traders definitely have different approaches compared to long-term investors, but if a speculator who is accustomed to quick trades synthesizes an outlook using the behavioral sentiment of long-term institutional players, they might find it helps build some foundations which help perceptions when deciding what to pursue. The use of barometers is always good too, this often gives a trader insights regarding market mood even if it is not an asset class they want to pursue. Gold is within record territory as it hovers around 2,500.00 USD per ounce.
Investors can argue all day and night about interpretations regarding results. The trading within gold the past six months, even since November of 2022 opens doors to a vast amount of complex explanations and narratives. They are too numerous to argue here, but the ability of the precious metal to march higher should continue to be watched. The recent surge higher since the end of June suggests – but it is again, only an explanation after the results have been seen – that gold traders believed the Federal Reserve would have to eventually capitulate and stop behaving hawkish about interest rates.
And this brings us squarely to this weeks events. Yes, the DNC is underway in Chicago and hopefully it provides a rather calm atmosphere free of political chaos via unwanted demonstrators. If investors can focus on the Fed’s FOMC Meeting Minutes report which will be published on Wednesday this would be good.
Because the Fed refused to sound dovish in their last FOMC Statement this created the potential for massive retaliation by institutional traders, and when coupled with the BoJ hike and their rhetoric, market turmoil in Japan and globally promptly ensued for a few days. However, because of recent inflation data again highlighting U.S prices via Producer Price Index are stable and decreasing in some sectors, and CPI has continued to come in below anticipated results, investors again firmly believe the Federal Reserve will definitely cut the Fed Funds Rate by at least 0.25% in September, and may be in a position to cut in November. Thus, the weakness and volatility of the USD which is clear to see via the USD Cash Index results.
USD Cash Index Three Month Chart as of 20th August 2024
Yet and potentially amusing tomorrow, the Fed’s FOMC Meeting Minutes may simply restate the cautious and very passive rhetoric from the last FOMC Statement. This because the Meeting Minutes are a reflection on thoughts shared at the Fed meeting, and we know what that outcome was already. Meaning tomorrow’s publication may scare some investors, but it shouldn’t. Tomorrow’s Fed paper may prove to be a non-event.
This sets the table for the Jackson Hole Symposium in Wyoming which starts on Thursday to produce a myriad of central banker statements led by Jerome Powell and his counterparts from the European Central Bank, Bank of Japan and Bank of England. The event is likely going to be important, but much of the talk which occurs in closed meetings is unlikely going to be made public.
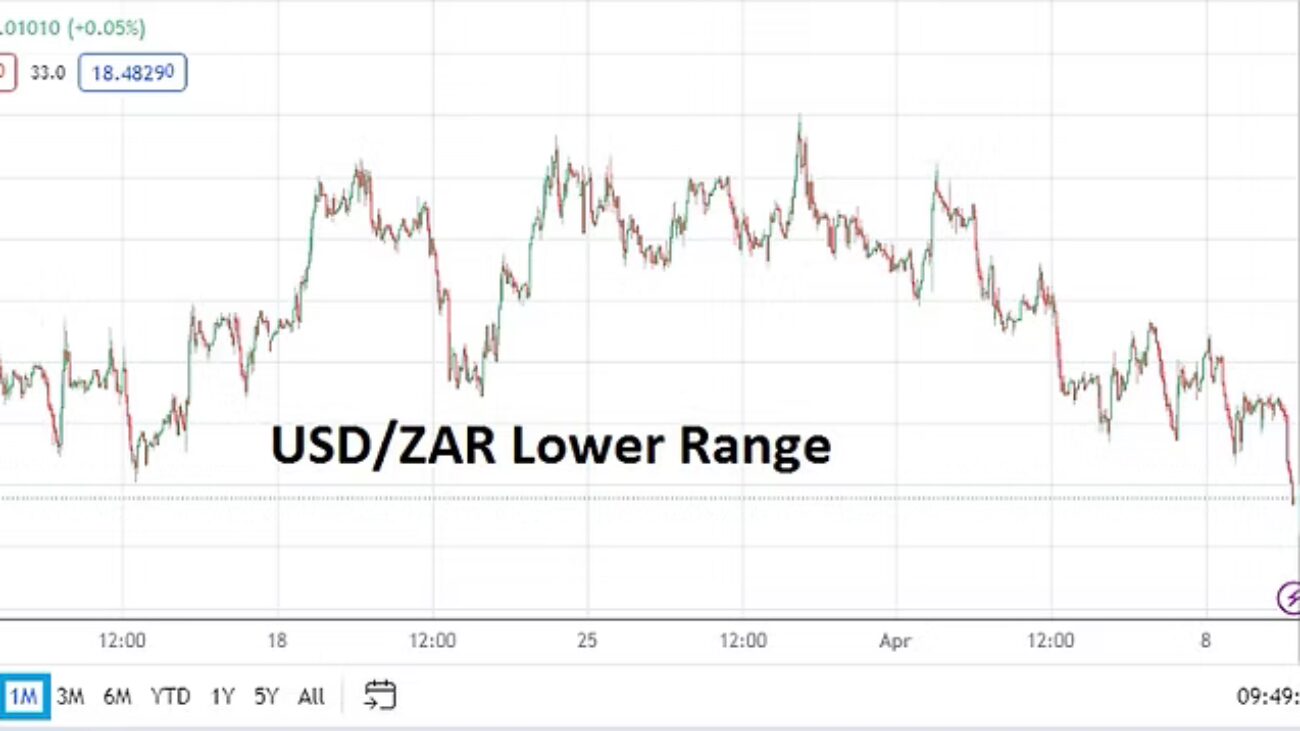
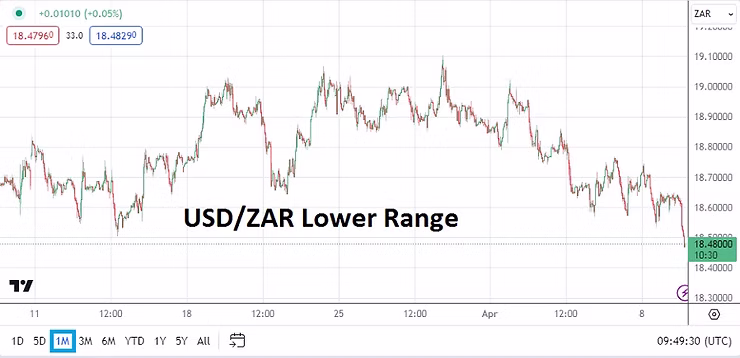
USD/ZAR Celebratory Parade Should be Put on Hold Awhile
The USD/ZAR has produced a solid downward turn since the 1st of April when the currency pair was trading above 19.00000.
The value of the USD/ZAR as of this writing is near the 18.48000 mark as the currency pair fluctuates within Forex. The currency pair has produced a solid downturn since the start of April when it was above the 19.00000 level. The ability of the USD/ZAR to suddenly create a streak of bearish trading and make support levels look vulnerable is intriguing, particularly considering USD centric sentiment against many other major currencies the past week and a half has produced very choppy results in the broad Forex market.
The USD/ZAR is now trading at its monthly low via a technical perspective and the currency pair is testing values last seen at the start of January. The ability of the USD/ZAR to suddenly spark selling may be able to be explained because of the higher value of Gold which is trading at record prices while traversing near 2,360.00 USD currently. Mining makes up roughly 8% of the Gross Domestic Product value for South Africa.
USD/ZAR One Month Chart as of 9th April 2024
However, before a party is launched to start celebrating the reemergence of the South Africa Rand, traders should note the USD/ZAR was trading within its current value range on the 14th of December. Thus the South African Rand is simply taking up residence like many other major currencies including the GBP and EUR within known prices they were valued, when the U.S Federal Reserve ‘changed’ its monetary policy stance on the 13th of December to a more dovish outlook.
The choppiness within the USD/ZAR has been rather extreme over the past few months. On the 28th of December the USD/ZAR was trading near the 18.26000 ratio briefly, on the 23rd of February the currency pair was near the 19.40000 mark and testing values which had been last seen in October of 2023. While the price of Gold is at record values now, the worth of the precious metal might be a false correlation to the USD/ZAR, and technical traders may want to watch the currency pair’s support levels below as a place that reversals higher could be sparked.
U.S Data and Concerns in South Africa Regarding the Election
The U.S will release important inflation data on Wednesday and Thursday. Last month’s Producer Price Index numbers from the States sparked a wave of volatility in Forex and the USD/ZAR was not immune. The bearish cycle in the USD/ZAR has been noteworthy, but fundamental doubt exists regarding its ability to sustain lower price momentum. The U.S Federal Reserve does not appear any closer to cutting its Federal Funds Rate.
There is also a political shadow regarding South Africa elections. The nation’s vote will take place on the 29th of May. The results potentially could create instability and the need for a coalition government which may be difficult to attain without signing off on more costly social policies which the South African government cannot easily afford fiscally.
USD/ZAR Short Term Thoughts:
· The 18.46000/18.47000 support levels in the short-term may cause reactions if challenged.
· Traders are urged not to be overly ambitious, particularly if they still want to pursue downside in the USD/ZAR, the use of take profit and stop loss orders is appropriate.
· Current price levels may spark volatility if financial institutions feel the price of the USD/ZAR has become unbalanced.