post305

India Insider: Affluence Among the Few, Aspirations for Many

India Insider: Affluence Among the Few, Aspirations for Many

A recent report by Franklin Templeton highlighted that India’s per capita income will penetrate the $5,000.00 USD level by 2031, pushing the country into what some analysts consider an affluence trigger zone. Their article celebrates the consumer boom showing the rising sales of premium detergents, growing green tea consumption, and a surge in discretionary spending, as if prosperity has finally crossed over into a mainstream phenomena.

But a closer look reveals something else and a worthwhile critique of Franklin Templeton’s optimistic portrayal.

Who Actually Spends this Money ?

The Franklin Templeton report confidently attributes the wealth effect to rising equities, real estate and gold. Yet, with only 13 crore (130 million) demat accounts in a country of 143 crore people, how can equities be driving broad affluence? Even within those attributed accounts, activity is heavily concentrated in the top decile of income earners like urban professionals in finance, IT and export linked sectors; and over 70% of mutual fund assets under management come from the top ten cities.

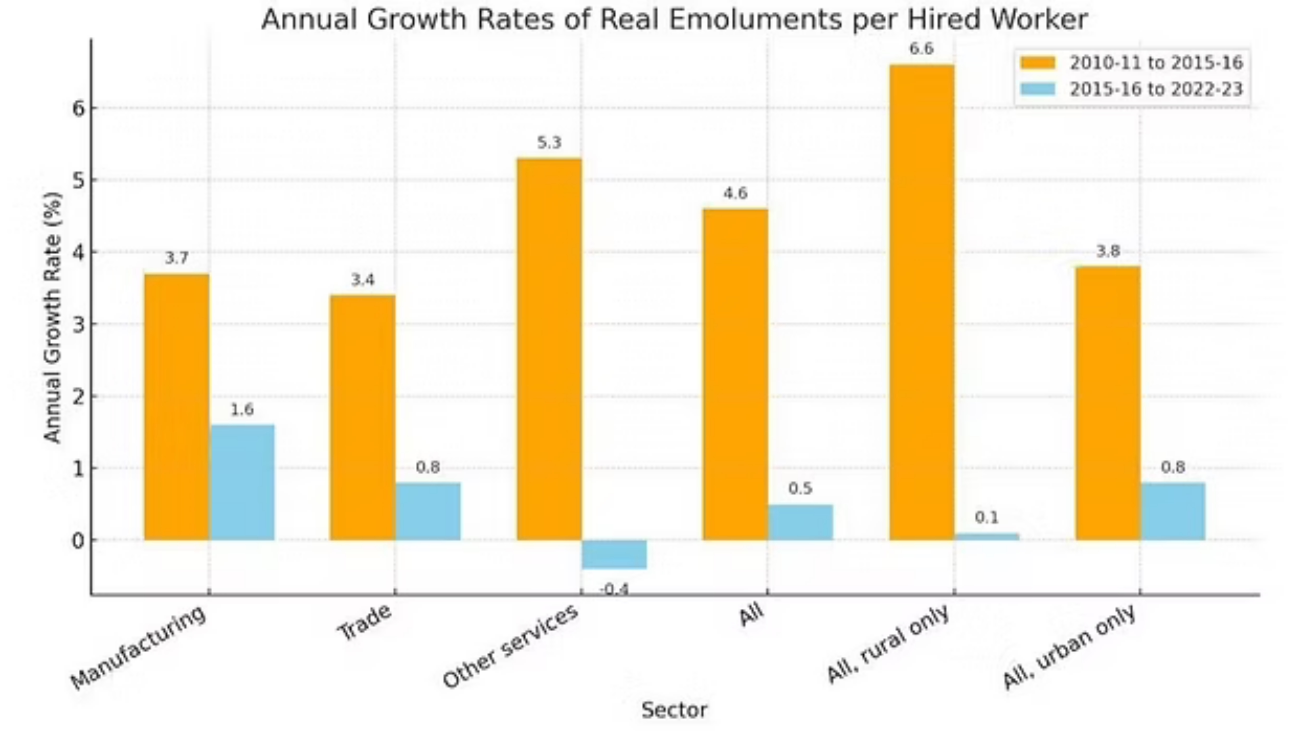
The so called upper middle class that fuels premium consumption largely works in these sectors. For the rest of India – especially the 42% still dependent on agriculture – wages have barely kept pace with inflation. Several national surveys and analyses show real wage stagnation since 2015-2016. Data from the Labor Bureau and the National Sample Survey (NSSO) indicates that real wages for rural laborers had near zero growth between 2015-2016 and 2022-2023. In contrast, the period before 2015-16 showed much faster wage growth.

NSSO Survey data compiled by Idea India Magazine

The Concentration of Savings and Spending Power

The report itself concedes that the top 20% of households hold around 85% of India’s total savings. That’s roughly 26 crore people (260 million) driving most of the premium consumption, while the remaining 104 crore (1.04 billion) share only 15% of savings – a stark reminder that aggregate growth often hides skewed realities. And this is why rural households and lower-income urban families, meanwhile, are facing tighter budgets and are actually cutting back on discretionary spending.

Gold as a Survival Cushion

The report romanticizes gold as a symbol of wealth, but in rural India, the precious metal plays a very different role. Gold is not an indicator of luxury and status, but a financial safety net. In villages around Tiruvannamalai City of Tamil Nadu State. Where I have surveyed about 50 families, average holdings are often below 40 grams. When harvests fail or cash flows tighten, this gold is pledged or sold to fund essentials like health expenses, education or seeds for the next planting season.

Yes, some towns in India have higher gold holdings and savings, sharply due to offshore remittances especially in States like Kerala and Gujarat. This remittance led prosperity fuels local real estate and pushes up rents, but it’s a localized story, not a national one. Most rural communities still depend on seasonal income and informal borrowing.

The Uneven Reality Behind Growth

Premium brands are growing faster, but this signals income polarization, not inclusive growth. The per capita income maybe rising, but it’s an average skewed by the top 10-20% who hold multiple assets. For most, consumption is fueled by rising debt. Until wage growth broadens and rural incomes strengthen, India’s  consumption boom will remain the affluence of a few – not the prosperity of the many.

postR181.1

Has a Great Selloff Begun? The Fed Holds a Crucial Card

Has a Great Selloff Begun? The Fed Holds a Crucial Card

Once upon a time the Federal Reserve caused a massive amount of fear to simmer and then boil over in the global market place but this is no fairy tale, the date was the 5th of August 2024 to be exact. However, the trigger causing events to unfold was pulled on Thursday the 31st of July. The Bank of Japan increased their policy rate to 0.25%, which was an increase of 0.15%. Then later on the same day the U.S Fed published a cautious sounding FOMC Statement followed by an inconclusive Press Conference, which left investors scratching their heads.

Nikkei 225 Three Month Chart as of 4th September 2024

Markets started to react with scorn on Friday the the 1st of August, particularly when the U.S jobs numbers showed a big miss with the Non-Farm Employment Change numbers, and also a lower than anticipated Average Hourly Earnings report was produced. Because Japan was essentially closed for equity trading when the U.S jobs data was released late on Friday, the Nikkei 225 responded with fury on the 5th of August. Global markets essentially crumbled over the next twelve hours as a massive selloff was sparked.

Some analysts noted the move lower in equity indices was an overreaction and the wild Forex trading would calm down, and this began quite predictably on the 6th of August. In essence the bad jobs numbers from the U.S proved the Federal Reserve was being too cautious and would need to begin sounding more aggressive regarding interest rate cuts. This dynamic played out when Fed Chairman Jerome Powell made his Jackson Hole Symposium speech on the 23rd of August and admitted the Fed would have to begin cutting interest rates – and he seemed to indicate the use of a plural regarding Federal Funds Rate cuts. This dynamic essentially confirmed what most financial institutions had bet on starting in late July via Forex. Equity indices which were able to recover plenty of lost ground after the 5th of August, also built up more momentum per Powell’s rhetoric at Jackson Hole.

USD Cash Index Three Month Chart as of 4th September 2024

However, Powell while sounding more dovish did not say how much the Fed would cut by in September. And based on the history of the Fed’s rather cautious and very passive monetary policy over the past handful of years, many financial institutions likely felt a cautious outlook should include a 0.25% cut on the 18th of September and then another 0.25% move lower in November. In the last week of August – yes, last week – equity markets started to show signs of nervousness again and the USD began to produce choppy trading before going into the Labor Day holiday.

Yesterday’s large selloff in assets has sparked more worries. While it is clear U.S inflation data has shown signs of erosion, the Federal Reserve has not indicated in any form that a Federal Funds Rate cut of more than 0.25% should be expected in two weeks. And perhaps not so coincidentally, the U.S Non-Farm Employment Change and Average Hourly Earnings data will be published this Friday. The outcome of these two reports will shake the ground for investors and financial institutions may be positioning for the drama.

Nvidia Three Month Chart as of 4th September 2024

An interesting three month barometer looking backwards has been created by Nvidia which has been choppy. While it remains only a ‘stock’, the company’s earnings and outlook are firmly on center stage for many investors. Nvidia has soared in value the past year. While some may feel that the asset is within a bubble, the company continues to post impressive earnings and its outlook appears bright as new software and hardware relies upon its products and development promises. Some analysts have said that earnings reports from Nvidia are now just as important as U.S economic data like inflation and jobs numbers. However, that is overstated, but let there be no doubt that Nvidia’s trading results over the next six months will probably tell us a lot about global market conditions and behavioral sentiment within financial institutions.

Day traders should not panic, they have the capability of watching from the sidelines if they choose over the next few days. The USD is still standing on weaker legs and Gold remains near 2,500.00 USD. Investors who have long-term holdings will certainly be nervous and want to make sure their mid-term yield perspectives are alright and their long-term targets are safe. Speculators small and large know the Fed will definitely cut the Federal Funds Rate in September. Yet, the trillion dollar question is if the Fed will only cut by 0.25%?

Gold Three Month Chart as of 4th September 2024

If the U.S jobs numbers this Friday come in below anticipated results once again, the Fed should strongly consider a 0.50% basis cut to the Federal Funds Rate on the 18th, that is what financial institutions would certainly like to see. They should also consider coming out with a brief statement this Friday to make sure investors know that a more aggressive stance will be taken if the jobs numbers are weak. However, as long time day traders and investors know, it is not in the Fed’s nature to grab the microphone loudly, unless a seismic event is taking place in the world and inflicting harm on the financial markets. Are investors now trying to warn the U.S Federal Reserve that they will ignite a major selloff unless the Fed becomes more aggressive?