postN63.1

Fed Rhetoric, U.S Consumers, and Fresh Concerns about China

Fed Rhetoric, U.S Consumers, and Fresh Concerns about China

U.S inflation data via the Consumer Price Index last Thursday met the anticipated result regarding the core number, and the broad statistics were only fractionally larger than expected. U.S Treasuries yields however jumped via quick reactions about stubborn inflation, then settled down. Equities via the major indices continue to show nervousness.

Day traders continue to get hit by choppiness, which means if they are not on the correct side of a trade initially, they can get knocked out of their positions quickly due to the use of too much leverage.

China produced another round of troublesome Consumer Price Index Producer Price Index reports last Friday, once again highlighting deflation is a legitimate concern for the nation.

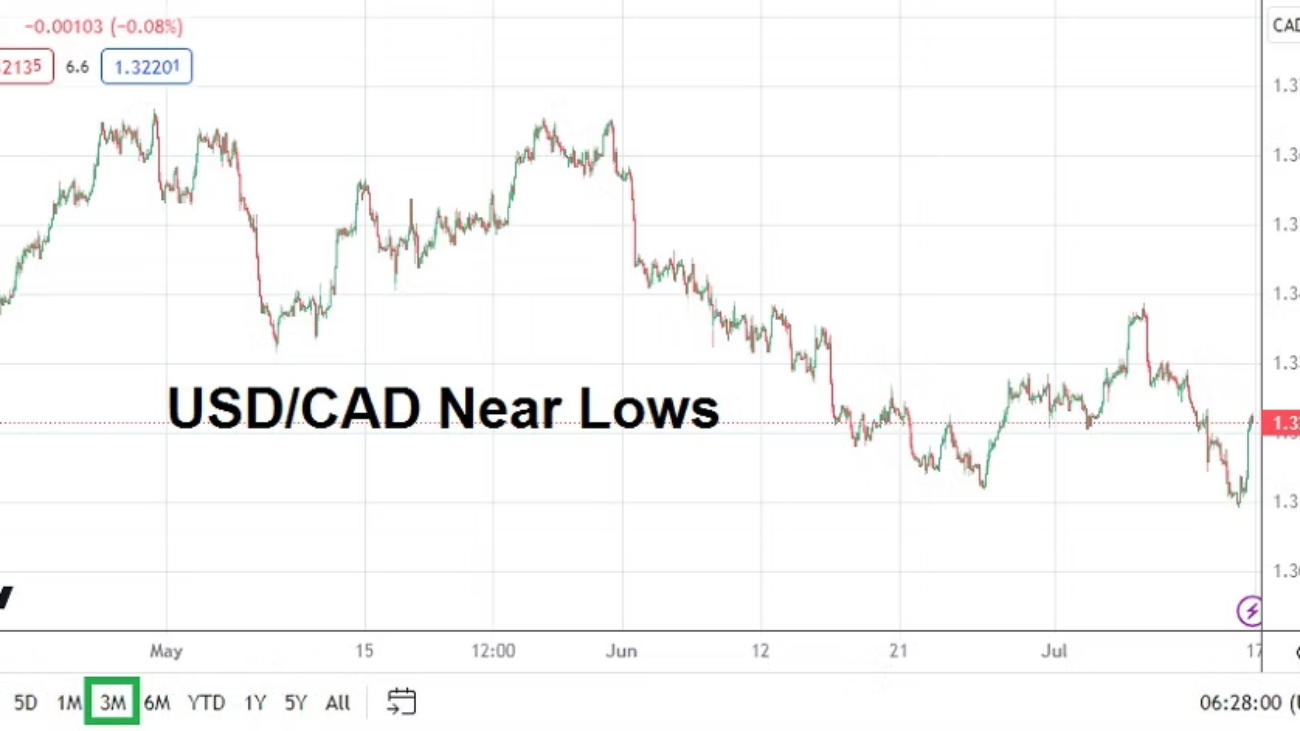
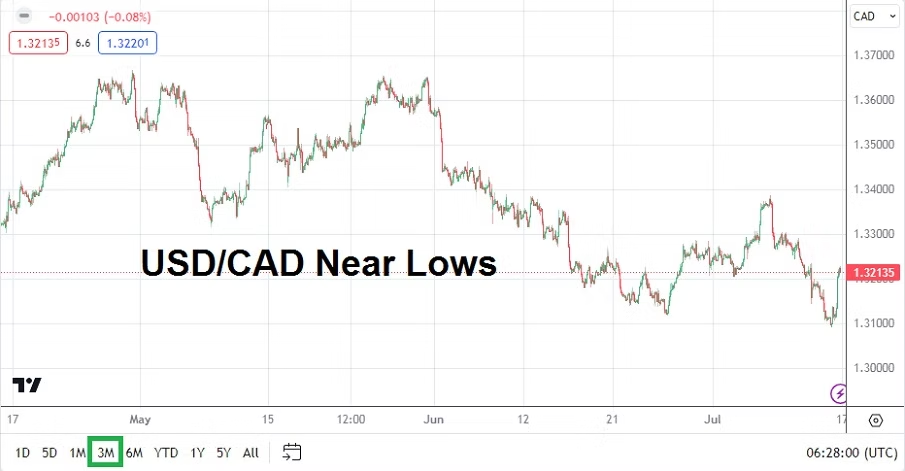
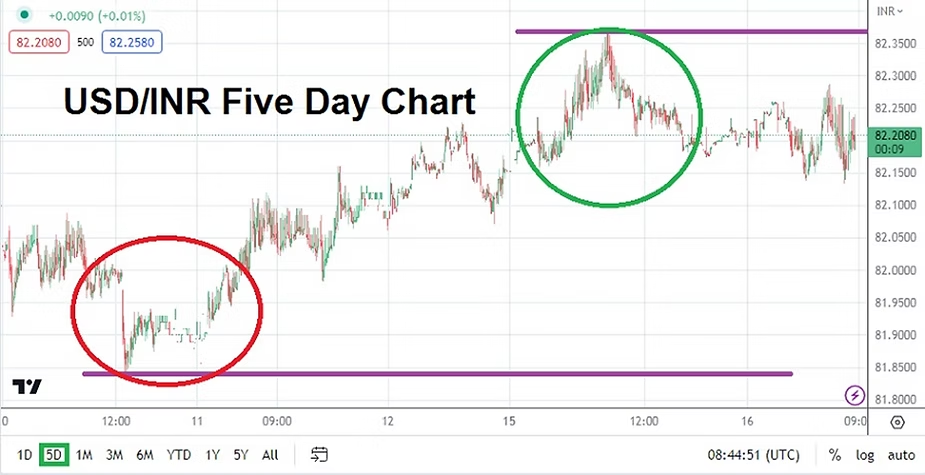
The USD began to weaken within many major currency pairs on late Tuesday and early Wednesday, and then began to prove difficult with sideways price action. However, many currencies held onto their slight gains against the USD going into the weekend. But before a massive bearish trend against the USD actually can be sustained, perceptions about the U.S Federal Reserve stands clearly in the way regarding behavioral sentiment.

Inflation numbers last week remained strong enough to suspect the Fed will raise interest rates again on the 1st of November. As a way to keep traders on their toes, U.S Federal Reserve officials will be speaking at many functions over the entirety of this week, offering crumbles of evidence for their less than spectacular rhetoric on the global economy no doubt.

Gold has produced a rather startling climb in the past ten days and its one month charts resemble a rather turbulent roller coaster. Traders who have been pursuing the precious metal during its strong reversals the past handful of weeks have hopefully been using solid risk management while taking a speculative ride.

Gold One Month Chart as of 16th of October

Monday, the 16th of October, U.S Empire State Manufacturing Index – the number has come in slightly better than expected, but has still produced a negative reading of minus -4.6. While many U.S officials will not state it publicly, a decline in the manufacturing index may pave the way towards a more tranquil Federal Reserve. But this may be wishful thinking too, particularly if inflation remains elevated.

Tuesday, the 17th of October, U.S Retail Sales – the data about consumer spending will affect Forex if there are surprises. Both the core and broad reports are anticipated to be weaker than last month’s numbers. Weaker results could create some USD weakness.

Wednesday, the 18th of October, China Industrial Production, Gross Domestic Product and Retail Sales – the Industrial Production results are expected to be slightly weaker than last months, while the GDP outcome is being estimated to show a significant drop. If the growth number comes in at the anticipated 4.5% mark it would be another signal that China is struggling while trying to jump start the economy. USD/CNY traders should be careful around these reports.

GBP/USD Six Month Chart as of 16th October

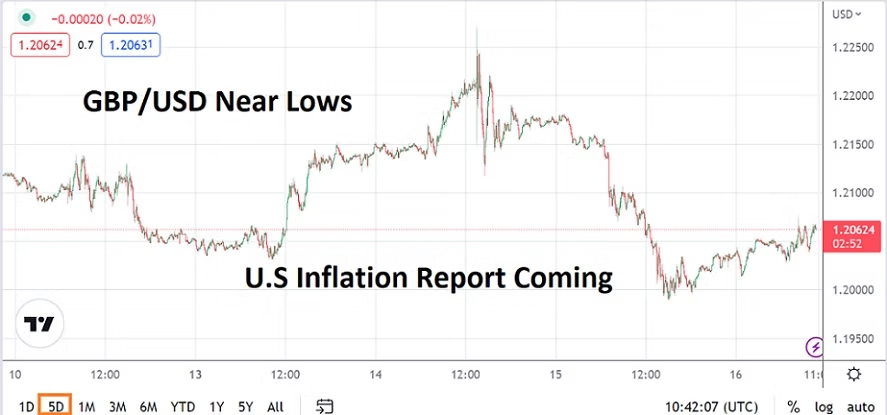
Wednesday, the 18th of October, U.K Consumer Price Index – the CPI data from Great Britain is expected to show a slight decline from the previous month. While last week’s GDP numbers met their rather lackluster expectations; Construction, Manufacturing, Trade Balance data came in much worse than anticipated. While no one from the U.K government is going to cheer on the bad economic numbers from last week, these figures will make these CPI inflation results important to monitor. Will the U.K inflation numbers remain stubborn like the U.S? The GBP/USD certainly needs to be watched in the aftermath of this CPI report.

Thursday, the 19th of October, China New Home Prices – the housing bubble within China is a thing of the past. Last month’s outcome produced another negative number and a poor report would not be a surprise this week. Negative housing values hurt the Chinese public which have largely quantified their personal savings via their real estate holdings.

Thursday, the 19th of October, U.S Unemployment Claims – the weekly report will give another small dose of evidence regarding the strength of the U.S economy for financial institutions to consider.

Friday, the 20th of October, U.K Retail Sales – the consumer spending report is expected to produce a decline of minus -0.3%. GBP/USD traders may use this report as another sphere of influence.

postN31

China and U.S Data Early and Important as Central Banks Fret

China and U.S Data Early and Important as Central Banks Fret

Monday, 17th July 2023, China GDP and Industrial Production – the economic numbers coming from China have shown steady signs of a downturn. Gross Domestic Product figures however are expected to increase this month, but some analysts may question transparency issues regarding the reported statistics. Industrial Production numbers are expected to fall, which on the surface may cause people to question any positive results from the GDP. Retail Sales will also be published on Monday. The housing market in China remains critically important in the nation and some borrowers appear to be suffering financial stress. While many global retail traders might not be invested in China, the nation serves as a good barometer for the world’s economy, particularly regarding consumer demand.

Monday, 17th July 2023, U.S Empire State Manufacturing Index – the New York based report is expected to have a negative reading. It should be noted June’s data came in stronger than expected. Another positive surprise outcome would continue to show economists are finding it difficult to gauge the U.S economy. Last Friday’s solid Consumer Sentiment reading from the University of Michigan highlighted the rather complex results from the U.S, weaker than expected inflation numbers are also factoring into a muddled sentiment. However, the Federal Reserve is still believed to be leaning towards another interest rate hike on the 26th of July. Day traders should remain alert.

USD/CAD 3 Month Chart as of 17th July 2023

Tuesday, 18th July 2023, Canada Consumer Price Index – the inflation numbers from Canada are expected to show a slight decrease in the velocity of rising prices. The numbers are likely to affect the USD/CAD which is trading near lows last challenged in September of 2022.

Tuesday, 18th July 2023, U.S Retail Sales – considering last week’s improved Consumer Sentiment numbers recently from the States, demonstrating better retail results compared to last month will not be a surprise. Earnings season on Wall Street gets underway this coming week and solid Retail Sales numbers may help mid-term outlook regarding equities. However, behavioral sentiment is fragile.

Wednesday, 19th July 2023, U.K CPI – the inflation numbers from Britain are expected to show a slight decrease in the rate of price expansion, but any result above 8% via the broad data will not make many folks feel better. GBP/USD speculators should monitor the reports.

Thursday, 20th July 2023, U.S Existing Home Sales – the rising costs of mortgages in the States is having an effect on the marketplace. Signs of stress in housing is an intriguing barometer regarding the outlook for the American economy. Better Consumer Sentiment and Retail Sales mixed with less than glowing numbers from the housing sector could make for a troubling diet for traders to consider and act upon.

Friday, 21st July 2023, U.K Retail Sales – recessionary results are shadowing Britain. Poor results from the retail sector would not help behavioral sentiment, particularly if inflation numbers have continued to show they are unrelenting two days before. The Bank of England is in an uncomfortable spot, this as the GBP/USD trades near highs it last saw in April of 2022.

post35.1

Sudden Bullish Momentum of Indian Rupee Raises Questions

Sudden Bullish Momentum of Indian Rupee Raises Questions

The past week of trading within the USD/INR has seen a bullish trend emerge, this while many speculators were likely starting to believe lower price realms and targets were possible.

The USD/INR is trading near the 82.2200 mark as of this writing, which is within the higher elements of its one month price range. Volatility within the USD/INR has been abundant the past week and has likely proven expensive for speculators who were pursuing the currency pair with visions of more bearish price action to target. Early May values of the USD/INR certainly tested lows and likely fueled the appeal of selling positions. However, the early May lows within the Forex pair tested the 81.6260 mark, while never actually hitting April’s lowest values which tested the 81.5500 ratio on a couple of occasions.

USD/INR One Month Chart as of 16th May 2023

One of the dangers of trading is always the potential for a sudden change in behavioral sentiment. The lows in the USD/INR seen on the 8th of May, which is only a little bit more than a week ago, highlights the price velocity the currency pair has demonstrated. While many speculators are trying to understand why the sudden shift in dynamics has taken place, it is important to remember the USD/INR was actually trading above its current values in February, March and early April of this year.

USD/INR Five Day Chart as of 16th of May 2023

The Difference between Day Traders and Financial Institutions

The outlook of speculators within the USD/INR is totally different than financial institutions. This is because most speculators are short and near-term traders. They do not have deep pockets like financial institutions – which can hold the USD/INR in a chosen direction for a long period of time and simply allow the currency pair to trade until they want to cash out of a position. Day traders are also using leverage a lot of the time, and the combination of leverage with limited available trading funds makes the daily gyrations of trading volatile and frequently dangerous.

Short-term traders look at the USD/INR with a technical viewpoint much of the time, financial institutions are likely maneuvering in the Forex pair with fundamental perspectives and inside knowledge based on known transactions they have to accomplish.

Many financial houses believe the U.S Federal Reserve will have to become less aggressive regarding its hawkish interest rate stance it has maintained the past year and a half. However there is enough nervousness within the broad Forex markets to make things very difficult for day traders, this as the potential for risk adverse trading based on economic data results move currency pairs including the USD/INR constantly, particularly if a financial institution needs to react quickly.

The ability of the USD/INR to move downward and hit support depths at the beginning of last week, may indeed be a sign that financial institutions have a belief the currency pair should be lower. However, the recent strength of the USD the past handful of days may have been brought on by the simple notion that financial houses grew momentarily nervous. There is also the possibility that large corporations made transactions in the USD/INR that moved the price higher. Day traders must understand there are forces within the USD/INR that are much stronger than their opinions. The USD/INR is not a widely traded currency pair in the open markets, it is difficult for instance to trade the currency pair in a speculative manner within India and traders in the nation face restrictions, which forces many Indian speculators who want to wager on the USD/INR to seek foreign brokers abroad.

Data and Rumors Can Sometimes be False Flags for USD/INR Traders

Some analysts have claimed the recent move higher in the USD/INR has taken place because of factors like a fear of the U.S debt ceiling not being raised in time and causing chaos in the financial markets, however this if true is likely only a short-term worry. It is very unlikely the U.S government is ‘idiotic’ enough to allow the U.S debt ceiling to not be taken care of within Congress. It would be very problematic for the U.S Federal Reserve and Treasury to have to explain why U.S bonds are suddenly difficult to repay. In other words, the U.S debt ceiling is likely to be taken care of and many financial institutions with a long-term view know this, although it is a possibility they could ‘punish’ the financial markets and act in a risk adverse manner in the short-term.

Data from the U.S yesterday highlighted another important aspect again regarding behavioral sentiment. The U.S Empire State Manufacturing Index reading came in with a negative number of minus -31.8. The expected result was -3.7, the report shows that New York business activity and outlook is worse than forecasted. This doesn’t mean the entire U.S manufacturing sector will have the same results, but it underscores the potential for a U.S recession to possibly occur. Today the U.S will release Retail Sales numbers. If these numbers come in with a negative result this could spur on bearish sentiment within the USD/INR in the near-term, particularly if financial institutions feel the results are more evidence the U.S Federal Reserve will have to pause interest rate hikes in June. USD/INR day traders should be ready for more choppiness. But there is reason to suspect resistance above in the currency pair may start to prove durable from a speculative point of view considering the trading results the past month in the USD/INR.

Traders wishing to pursue the USD/INR need to use solid risk management. Entry price orders will help traders get a ‘fill’ they are expecting and the use of stop loss and take profit tactics are highly encouraged. The past week of trading in the USD/INR has likely tested the nerves of many speculators and the assault on highs is alarming, but downside price action may be ready to reignite if U.S economic data continues to falter in the near-term.

post34

Economic Data and Underlying Factors this Week

Economic Data and Underlying Factors this Week

Monday 15th of May, U.S Empire State Manufacturing – N.Y manufacturing sector report regarding business conditions, which serves as a sentiment reading. A lackluster outcome could put a bit more pressure on the Federal Reserve to lessen their aggressive stance, and certainly point out nervousness among U.S corporations regarding profits.

Monday 15th of May, U.S TIC Long-Term Purchases – report shows results from between domestic and international purchases of U.S Treasuries. While not considered a major data release, this one could give an impetus to investors in U.S banking sector who may find intriguing potential correlations. An increase in the number of domestic purchases compared to international buyers would be of interest. Large dark shadows on the U.S mid and small size banking sector still exists, pressures boil as depositors are still considering parking their money elsewhere, and corporate share values remain fragile.

Tuesday 16th of May, China Industrial Production and Retail Sales – China economic results are a barometer of global health due to the fact the nation is a large supplier of worldwide products. Industrial Production results if they are lagging in China, would indicate decreasing demand and global economic weakness. Retail Sales figures from China is an indicator of consumer sentiment within the nation.

Tuesday 16th of May, U.S Retail Sales – results indicate buying power and confidence among U.S consumers. Underlying numbers also focus on how Americans are spending, in other words – are they paying the full price being asked or are they looking for discounted goods as inflation continues to hit wallets.

Wednesday 17th of May, Japan Preliminary Gross Domestic Product – No real surprises expected from Japan’s growth numbers, but the results are always appealing to economists who debate the nation’s ability to remain among the wealthiest without any truly outstanding GDP numbers produced in years. In other words a lot of noise for traders without much real impact.

WTI Crude Oil – One Month Chart as of 14th May 2023

Wednesday 17th of May, U.S Crude Oil Inventories – another report that seems important for commodities traders, but without any real surprises has limited impact. Many times even among WTI Crude Oil speculators, they are often looking at other data they have gathered like production numbers from OPEC, Mexico and Canada. And also oil tanker movements around the globe.

Thursday 18th of May, Australia Employment Change and Unemployment Rate – outcome from these numbers could factor into AUD/USD momentarily, but without a major surprise will likely have little impact on global speculators for more than a couple of hours.

Thursday 18th of May, U.S Existing Home Sales – housing numbers are under some scrutiny as they reflect behavior of current U.S home owners as they react to growing interest rate pressures on mortgages and stay within their current homes to avoid higher borrowing costs.

post14

U.S Inflation Data Ready to Rattle Markets and Traders

U.S Inflation Data Ready to Rattle Markets and Traders

Another Day to Prove some of us are Fools

The U.S will publish its PPI data in a few hours time. The outlooks from many experts regarding the Federal Reserve have been rather suspicious when contemplating the U.S central bank. However, the results of the Non-Farm Employment Change numbers on the 3rd of February, and this Tuesday’s rather stubborn Consumer Price Index reports have created doubt among the ‘experts’.

  • Forex and equities and their related indices will react to the publication of the Producer Price Index statistics today and create price velocity that day traders may find dangerous.

  • On the surface it appears many Forex pairs have begun to search for a calm middle ground leading up to the release of the PPI report. Perhaps positions are on hold until the release of the inflation data.

  • Traders should not be tempted and get stuck in tranquil waters that could turn into seas that drown their victims later.

Day traders who choose to wager before the reports are published today are essentially gambling with their money unless they have direct knowledge regarding today’s outcome. The rather comfortable mid-term bearish trend in the USD against most major currencies has been stopped cold since the 3rd of February.

GBP/USD Five Day Chart

Outlook regarding the U.S Federal Reserve has gone from scorn and mockery and become a rather more sedated acknowledgement that inflation is rather robust. Today’s PPI numbers will provide evidence and clarity. If the number via the Producer Price Index is stronger than anticipated it will certainly create a foundation for the ‘promised’ 0.25% rate hike in March, but also set the road for more hikes to potentially come.

Questions remain loud. The better than expected jobs numbers a couple of weeks ago was a cumbersome development for financial houses paying attention to recent layoffs from top companies and betting on weaker data. When hiring proved to be stronger than anticipated it could be pointed out that the employment numbers were looking backwards and not forward. Yet, the strong Retail Sales numbers and the improving Empire State Manufacturing reading yesterday are signs the U.S economy remains in a better place than forecasted. Recession may not be around corner.

Day traders need to be cautious and the ‘experts’ may want to look for their safe places today.