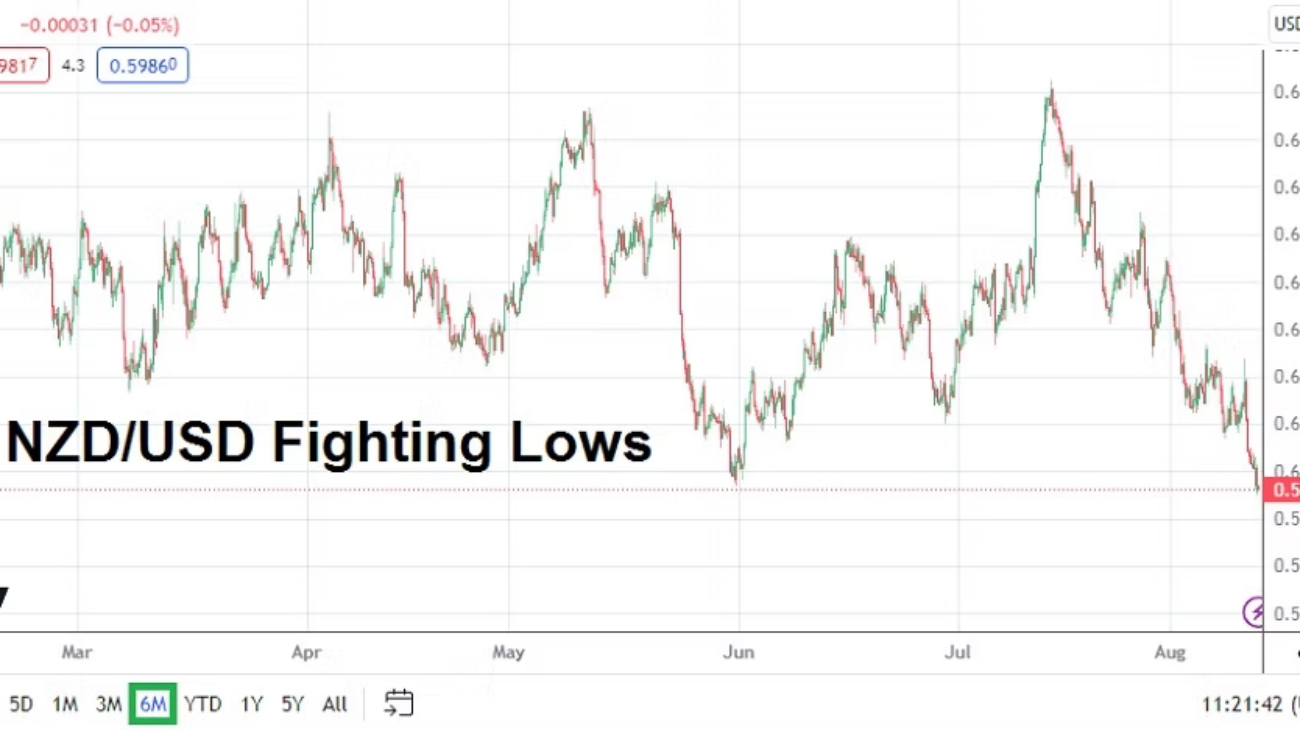
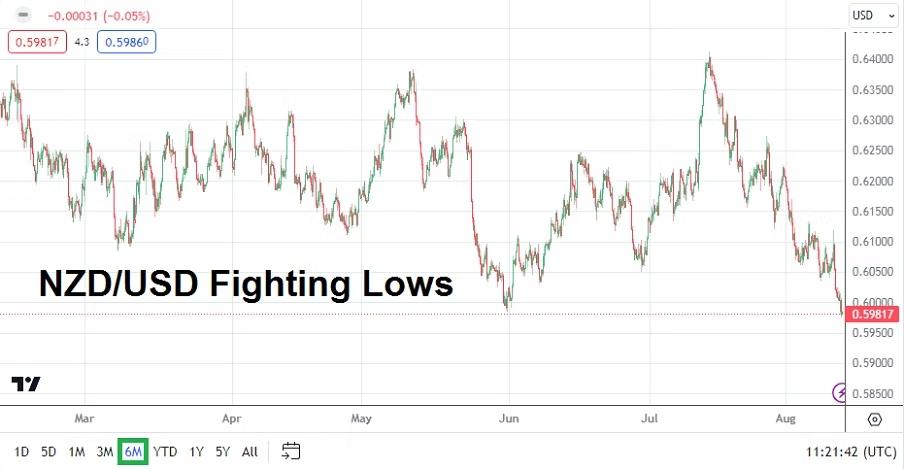
Stock Market Narrative and Looking for a Trump Silver Lining

U.S stock markets have been hit on the nose in recent weeks, the major indices have put in rather consistent declines since the 19th of February, and the selling frenzy and particularly noise have grown worse since the start of March. Narrative regarding tariffs and a lack of clarity have certainly had a negative effect. The notion that there is a part of the media that wants to see a downturn in the markets and blame President Trump could also be factoring into concerns and fragile sentiment among indices participants. I am not blaming the media for the downturn, just pointing out that there are some entities which are not unhappy about the recent selling in the stock markets, this because it fits comfortably into their narratives.
While the bearish decline on the S&P 500, Nasdaq 100, and Dow 30 have all been easy to see, defining the dynamics of the downturn, and reactions from day traders and investors are complicated. The stock markets are not guaranteed to always go higher. This may sound naive, but people have gotten so used to the notion that U.S indices always go up that they forget about the potential for downturns. Yes, the stock markets have turned negative, but a one month decline is not uncommon historically. And some of the folks rooting against Donald Trump may want to take that into consideration.
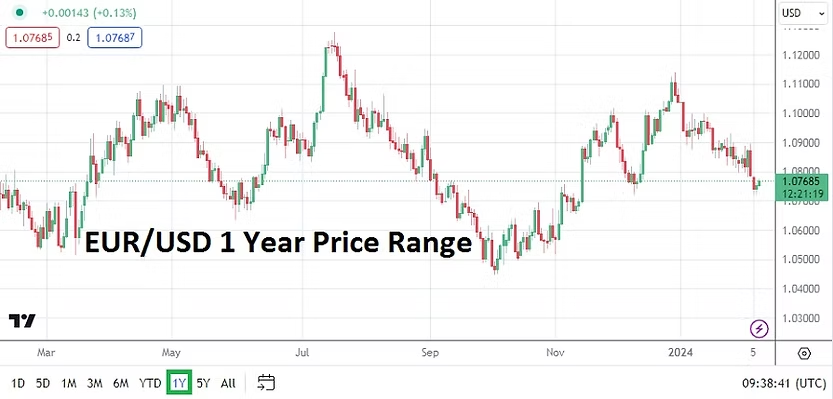
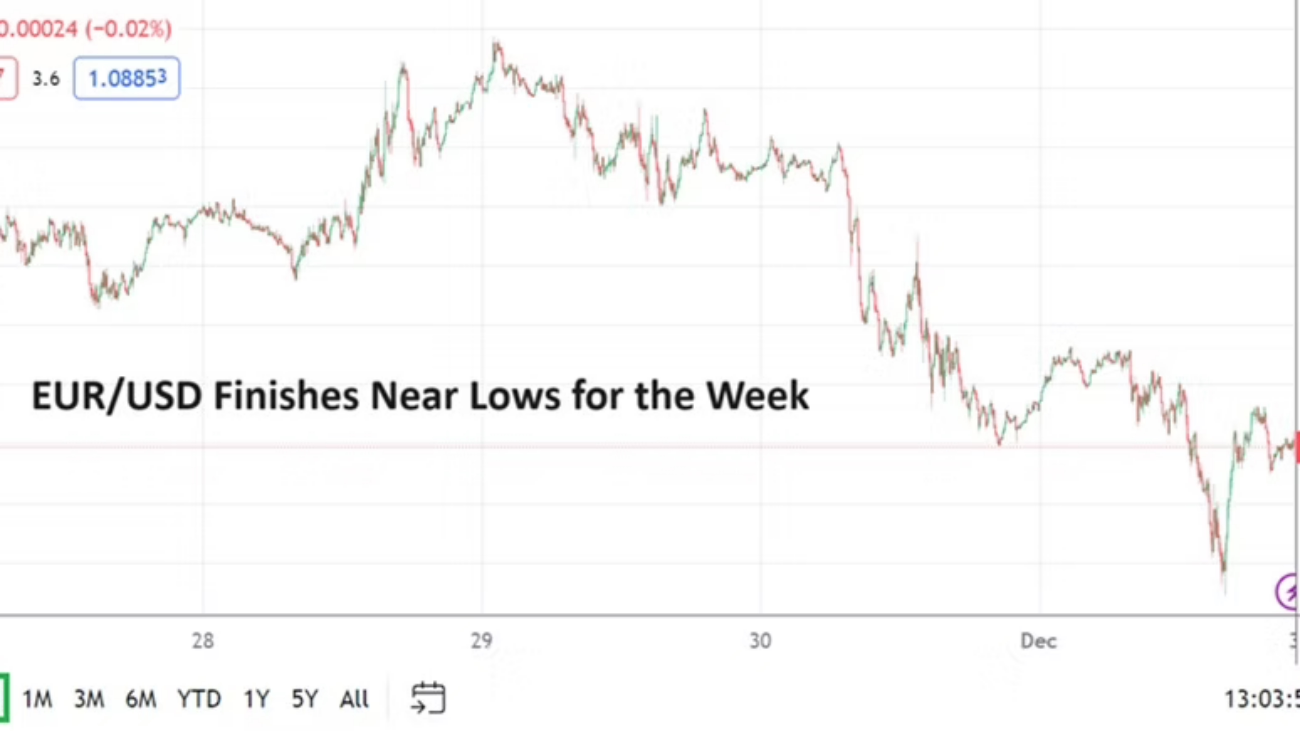
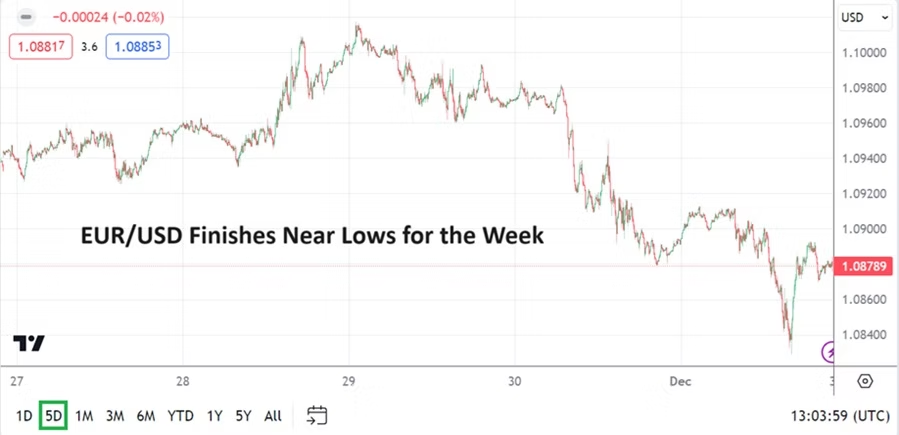
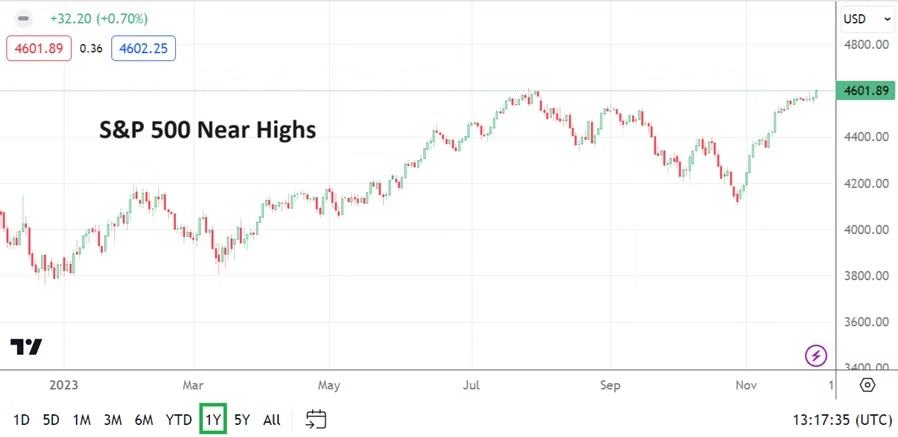
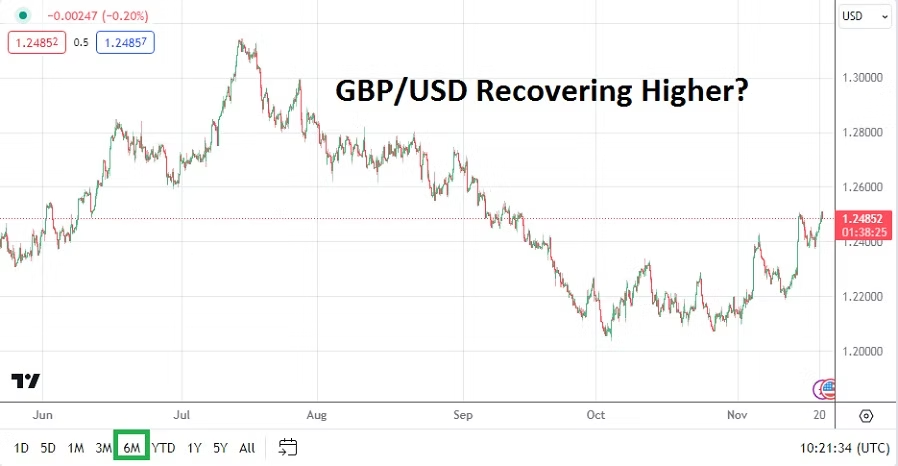
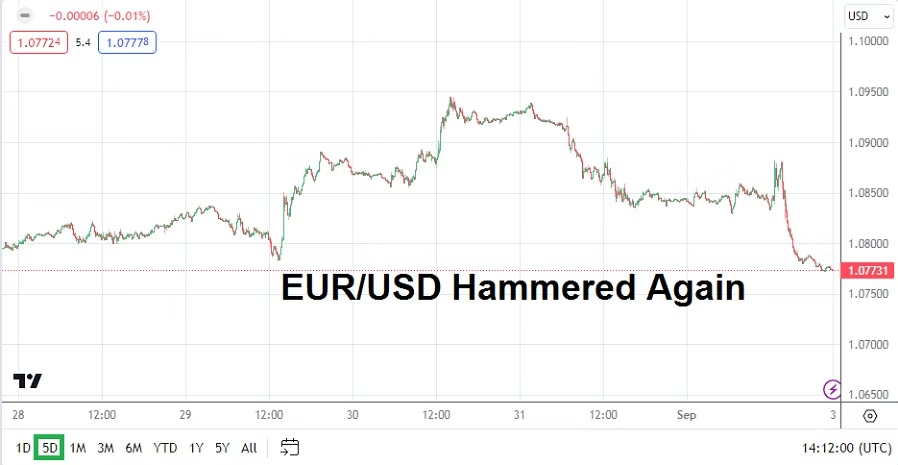
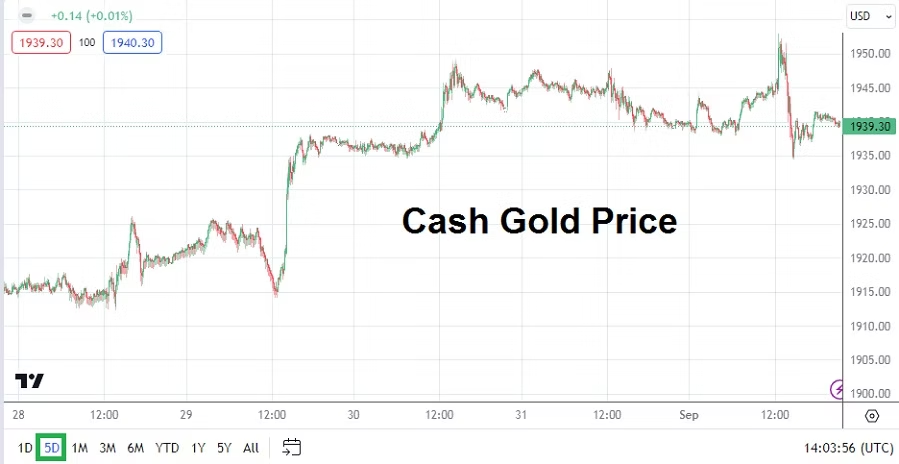
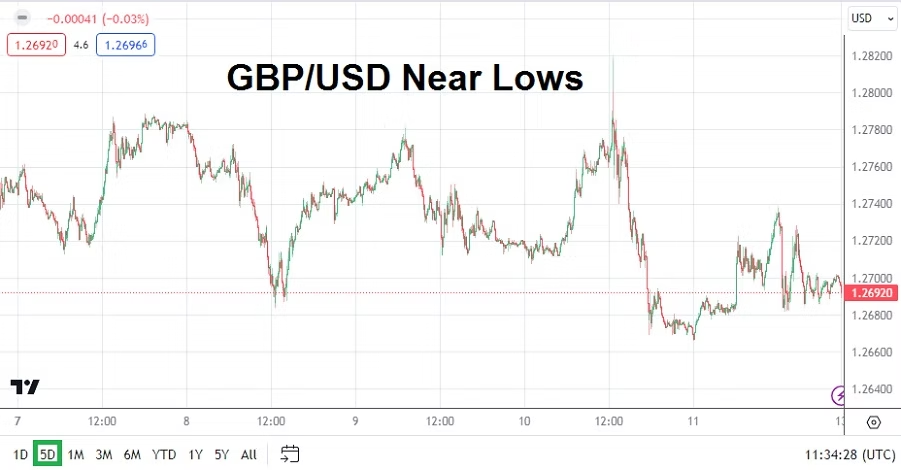
Risk premium has certainly been factored into the markets which has influenced equities, but has created forceful moves in Forex too. Risk adverse tension because of persistent rhetoric about tariffs and their impact on behavioral sentiment cannot be discounted. However, the stock markets are still higher over the past year.
The Trump Effect is certainly being pointed at by many as the cause for the sudden downturn, but it should be remembered that all-time highs occurred after Trump won the election. Yes, the selloff has definitely happened too, and stock markets are now traversing values seen before the election. And support levels are being looked at with caution and more selling could lead to a test of psychological ratios which pressure market confidence further. Yet, it should also be remembered the S&P 500 at this time last year was around the 5,150 ratio compared to its current mark near 5,565.
Day traders have been hard pressed to find momentum with solid wagering opportunities, particularly if they have been in search of a bullish trend in recent weeks. The belief that U.S indices always go up eventually is a solid reference, but in the short-term can cause expensive losses for stubborn betters. Investors certainly have an easier time with stock indices if they practice the long-game and do not worry about the daily and monthly gyrations when their money is parked in indices. The use of leverage when betting on the daily results of stock markets can become ultra expensive for speculators, particularly when upside bias is being counted upon.
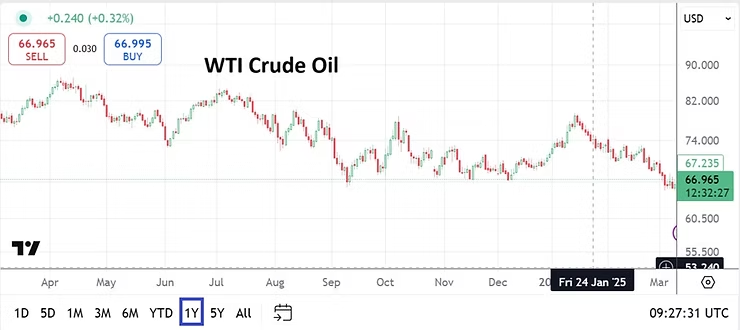
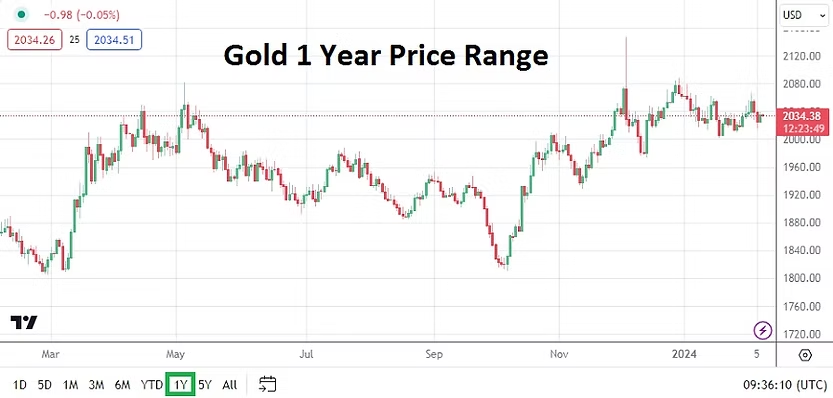
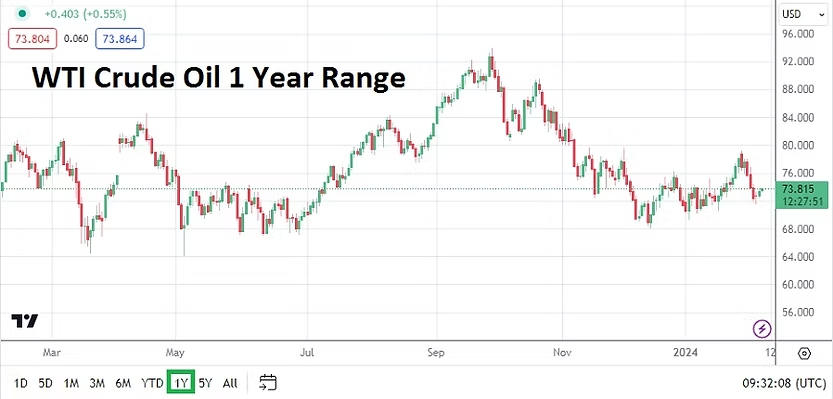
Data this week from the U.S has actually been positive regarding lower inflation, both the CPI and PPI reports released the past two days has shown a slow down in costs. Yet, these results have little to do with President Trump, since he has only been in power less than two months. However, the lower WTI Crude Oil prices being achieved at this moment will start to factor into weaker inflation and will benefit the U.S economy.
The U.S Federal Reserve will have to be watched, because Fed officials seemingly continue to be among the crowd worried about tariff knock-on repercussions. But it should be remembered during Trump’s first term in office, there were tariff concerns too and inflation was tame. It will take a few months to still see results via inflation under this Trump administration, but if energy prices remain stable and low, this can mitigate circumstances while the tariff winds blow and their effects are waited upon. Interest rates from the Federal Reserve, U.S taxes on the public will continue to come under scrutiny. The likelihood of Trump and the Federal Reserve locking horns regarding interest rates seems to be a certainty in the coming months.
U.S stock markets have proven dangerous for bullish perspectives the past handful of weeks, but the viewpoint that markets have been too discounted will certainly start getting the attention of large players. U.S Treasury yields remain a barometer, but short-term results do not always correlate. Speculators without deep pockets may want to continue to watch from the sidelines.
Traders should also remember there is the ability to short U.S indices, but this brings up the healthy question about when will price support start to become a factor. It is nearly impossible to pick the precise moment financial assets will stage a turnaround for day traders, but history does indicate that bullish sentiment will start to be seen. Betting on a continued downturn could prove more expensive in the end, compared to speculating on upside.
Trading is not easy. It takes a lot of stamina to endure price movements that do not go according to plans. The financial markets are proving difficult for many. We are likely not out of the woods yet because clarity remains problematic, investors who have longer timeframes are likely anxious too. Price velocity needs to be given attention, markets can certainly go lower. However, at some juncture equities will start to look cheap to important long-term players. Behavioral sentiment among investors will likely also start to acclimate to the Trump Effect.