post291

India Insider: Why is Gold Frequently Accumulated by Indians?

India Insider: Why is Gold Frequently Accumulated by Indians?

In a society like India in which I live gold hoarding is a fact of life. According to a recent report by the World Gold Council, Indian households are believed to hold around 25,000 tonnes of gold with a combined value of around $3 trillion USD.

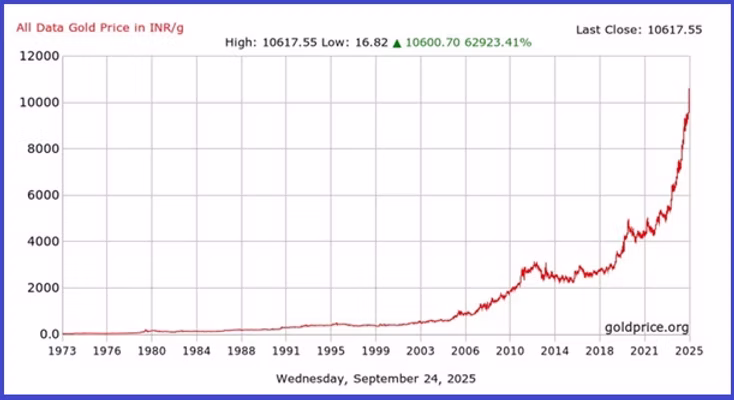
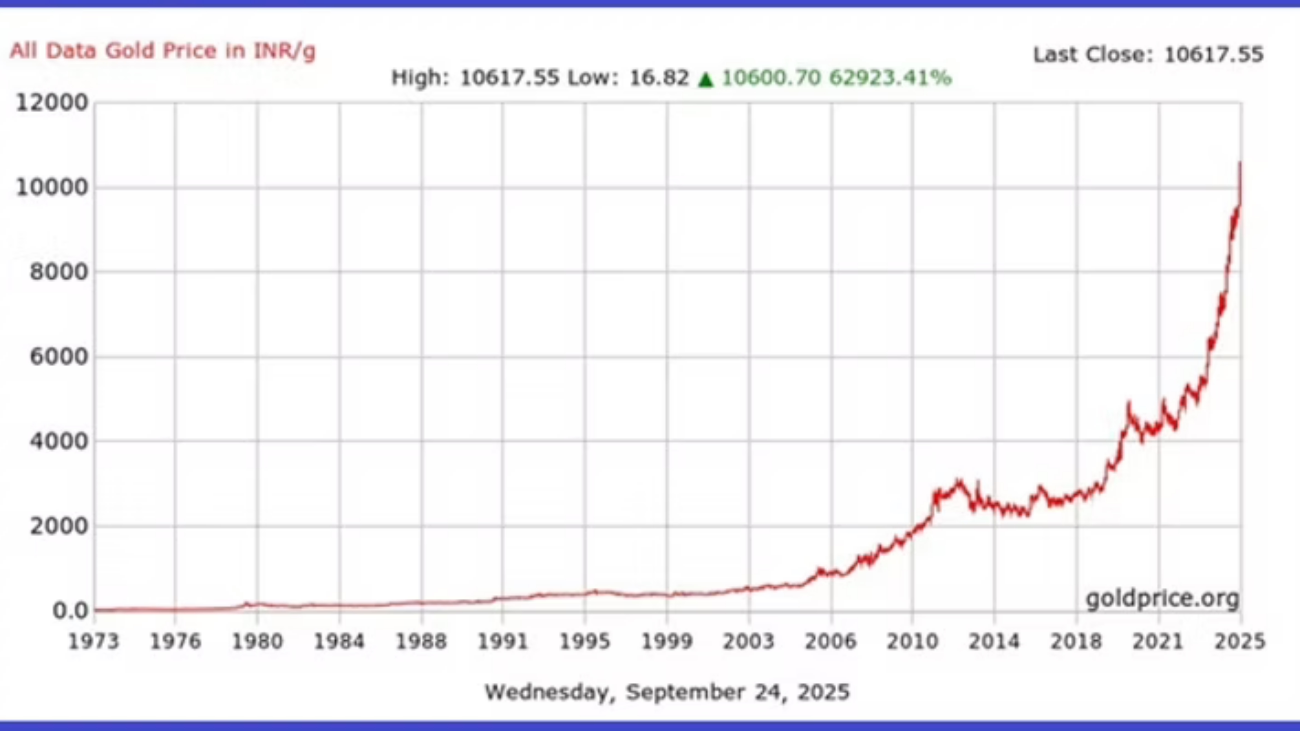
Billionaire banker Uday Kotak applauded Indian women when he said they are ”the smartest fund managers in the world”. The precious metal has gained 42% in 2025 alone, and returned 700% in the last 20 years in Indian Rupee terms. In India consumers have a habit of monitoring daily gold prices. There is a gold festival in India called Aksayatritiyai, when gold is bought frequently in small grams but often also includes large purchases for religious sentiments. In Northern India, gold is bought during festival times like Dhanteras and believed to bring prosperity and good fortune.

It’s almost unthinkable for marriages to occur in India without gold. Many marriages have been postponed and even stopped if the requisite dowry is not given by a girl’s family. And there was a time in India when some families didn’t want to have a baby girl due to the excessive gold dowry they would be responsible for and have to give a boy’s family at the time of marriage. 

Adam Smith’s Case Against Gold:

Smith lashed out at gold for its lack of productiveness. He wrote in the The Wealth of Nations, “labour was the first price, the original purchase-money that was paid for all things. It was not by gold or by silver, but by labour, that all the wealth of the world was originally purchased; and its value, to those who possess it, and who want to exchange it for some few productions, is precisely equal to the quantity of labour which it can enable them to purchase or command.”

The act of hoarding, whether it is money or gold, depresses economic activity, as demonstrated by John Maynard Keynes in his ‘paradox of thrift’. Indeed, it was the Europeans by spending all the precious metals taken from the Americas which boosted economic activity, and ultimately sparked the rise of modern capitalism whereas Asians by hoarding ended up falling behind.

Ancient China Example:

In the past, China’s reliance on silver gave short-term stability but stunted long term growth. With no domestic silver, it depended on inflows from Spain and Japan, making its money supply hostage to global trade. Wars or disruptions cut silver inflows, draining liquidity while crippling tax collection. Unlike Europe, China clung to silver as ‘real’ money, while neglecting credit, banking and bonds. This rigid system weakened the nation’s fiscal capacity, leaving China unable to mobilize resources or industrialize effectively. In the end, silver ensured stability, but strangled flexibility and growth. Indian growth has been strangled too often because of an over-obsession towards gold.

Why Gold Prices are Moving Up?

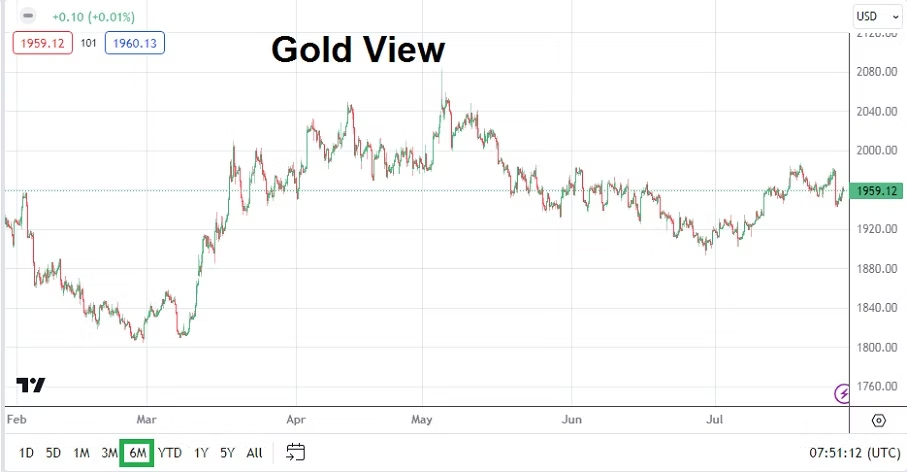
The price of gold was relatively stable until the 2008 financial crisis and it’s been rising steadily ever since, doubling in 3 years from 2009 to 2012. After some broad consolidation, gold has been in a higher value band if you scrupulously study charts. Arguably, it is an influence due to lower interest rates that have helped gold prices move up for 15 years as inflation has been attempted to be camouflaged by Central Banks.

Accumulation of Central Bank Holding of Gold into 2024

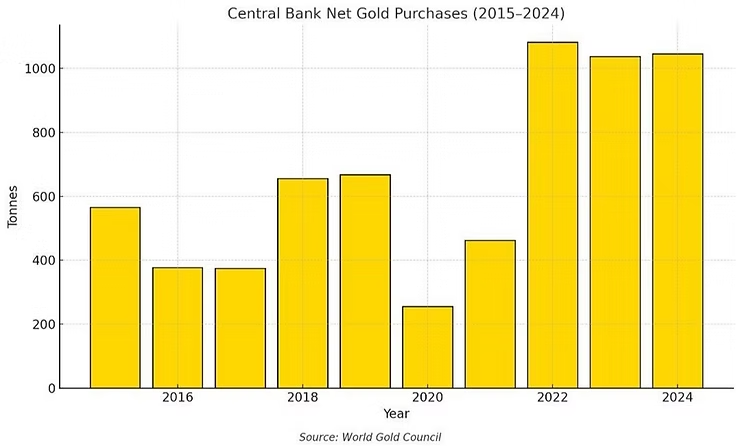
Central Banks also accumulate gold for many reasons. One reason for this are rising bond yields that make existing fiscal obligations underperform for governments. Central Banks buy gold to diversify and hedge against risk. As the Official Monetary and Financial Institutions Forum – an independent body – noted recently, many European national bank systems endure massive losses because of quantitative easing. When the institutions try to undertake quantitative tightening, they are forced to sell at market prices, which deepen their balance sheets losses. Thus, Central Banks diversify into gold as a sacrosanct hedge against losses incurred and allows them to offset many liabilities. Gold has a long historical track record of working as a safeguard against inflation.

It’s also true that gold is often accumulated by Central Banks when hedging against geopolitical uncertainty. The Russia and Ukraine war offers intrigue regarding the nation of Kyrgyzstan, which China uses as a route for its exports to Russia, this due to Kyrgyzstan’s inherent ability to conduct trade via accessible routes. There is high plausibility that Kyrgyzstan might be converting Russian Ruble surpluses into gold.

Monetary Policy Matters for Gold:

Gold will remain vital for many years to come as a store of value and a safe haven. Buying the precious metal delivers investors and businesses a needed hedge against inflation. Protections against the lose of purchasing power within their own fiat currencies remains important for all people.

The Indian public and other societies need to remember, the value of gold within their own currencies often lies within the interest rate valuations sparked by Central Banks mechanisms which sometimes amount to magic shows and influence demand. While public buying of gold is important, it sometimes equates into mere speculation and does not always help economic activity.

postN36.1

Anxiety and Surprising U.S Data for Day Traders to Consider

Anxiety and Surprising U.S Data for Day Traders to Consider

Global central banks stayed in their anticipated lanes last week as the Fed and ECB raised their key lending rates. The BoJ has admitted it is allowing its yield curve to increase, meaning the Japan government is cutting back on purchases of Japanese bonds. Forex produced anxiety and choppy results for day traders.

Gold 6 Months Chart as of 30 July 2023

Economic data from the U.S last week provided a strong Gross Domestic Product result on Thursday, and followed with weaker than expected Personal Consumption Expenditures and Personal Income statistics before going into the weekend. Meaning the U.S economy appears to be surprisingly solid, while inflation pressures do indicate they are in decline. The Forex market turned volatile on Thursday and Friday, gold which traded at nearly 1980.00 USD on Thursday went into the weekend near 1959.00.

VIX Index 1 Year Chart as of 30 July 2023

Stock markets in the U.S via the major indices continue to incrementally rise and folks waiting for a big sustained selloff are having their patience tested. Perceived volatility in U.S markets is very low and the VIX (Volatility Index) indicates many investors are not taking the time to hedge with options because their confidence is remarkably high. A cautious reminder for traders, one bad day could change all of the optimistic sentiment.

In the cryptocurrency world, folks should continue to keep their eyes on the Binance exchange and its Binance coin. Many digital assets seem to be suspiciously close to important support levels as this week begins and appear vulnerable.

Monday, 31st of July, China Manufacturing PMI – while U.S data surprisingly improves, China has not begun to show signs of a positive turnaround quite yet, and this reading is expected to be below last month’s outcome. China data is a solid barometer of global economic health and traders should give these results proper attention.

Monday, 31st of July, E.U Consumer Price Index Flash Estimates – the European CPI numbers are expected to come in slightly below the previous month’s reading. If for some reason these inflation numbers are higher than expected, this could cause some chaos briefly for the EUR/USD. A weaker number however offers no sound wagering basis for short-term day traders either. Behavioral sentiment appears to be ruling the EUR/USD landscape for the time being, and technical levels should be watched.

Tuesday, 1st of August, Australia Reserve Bank Cash Rate – the RBA is expected to follow in the footsteps of the Fed and ECB and raise its lending rate by 0.25%.

Tuesday, 1st of August, E.U Manufacturing PMI – Germany and France are anticipated to produce similar results to last month’s outcomes. Recessionary pressures are a concern in the E.U and better than expected numbers would be welcomed, but this may prove difficult to demonstrate as economic conditions remain challenging.

Tuesday, 1st of August, U.S ISM Manufacturing PMI – the results from the manufacturing sector in the States should be watched. A slight improvement is expected, but the reading is not expected to produce a wildly optimistic result. An outcome which slightly beats expectations, but is not too strong might make the USD slightly weaker. Global investment institutions are likely hoping for any signs that the Federal Reserve will have to become less aggressive. A lackluster to ‘fair’ ISM Manufacturing PMI result could be evidence larger Forex traders want to see if they are aiming for bearish momentum in the USD.

NZD/USD 3 Months Chart as of 30 July 2023

Wednesday, 2nd of August, New Zealand Employment Change – the jobs statistics are expected to show slightly weaker results from the nation. The NZD/USD remains within the lower elements of its long-term price range. There are many NZD/USD bullish traders waiting for a sustained reversal higher, but it is unlikely to be produced from these New Zealand jobs numbers.

Thursday, 3rd of August, U.K BoE Monetary Policy Summary and Official Bank Rate – the Bank of England remains in a difficult spot and it will likely raise interest rates by another 0.25%. Criticism of the Bank of England has been loud in Britain, but the BoE likely feels it has to remain in line with the Fed and ECB. Recessionary pressures continue in the U.K and inflation remains problematic. Concerns will be heard regarding property mortgages for home owners if the BoE hikes. The GBP/USD will certainly move depending on the rhetoric from the Monetary Policy Summary and talking points delivered by BoE Governor Andrew Bailey.

Friday, 4th of August, U.S Non-Farm Employment Change and Average Hourly Earnings – the jobs data parade will climax at the end of the week, this after starting on Wednesday via the ADP jobs numbers. Investors will watch the Non-Farm Employment Change data carefully and correlate them to the better than expected GDP results from the 27th of July. The wages data from the Average Hourly Earnings is expected to come in with a slight decrease. A weaker inflation result from the wages statistics could cause additional softness in the USD. However, recent data from the U.S has been hard to predict correctly, and day traders may want to sit on the sidelines until all the jobs numbers are digested.