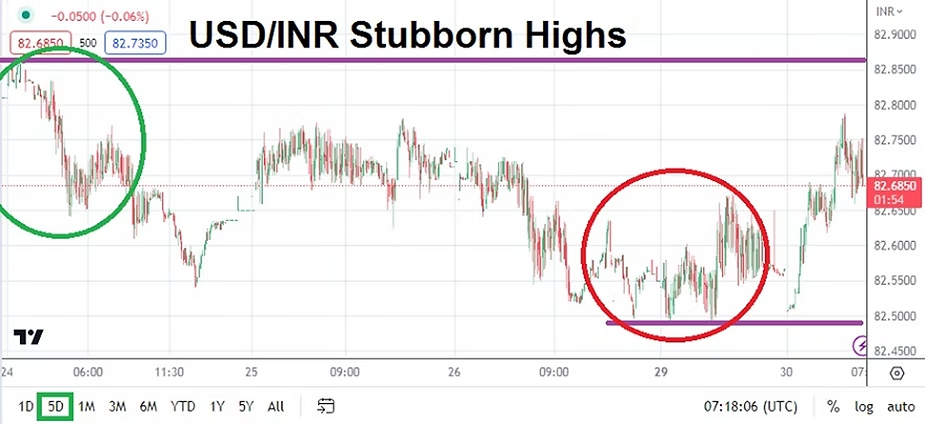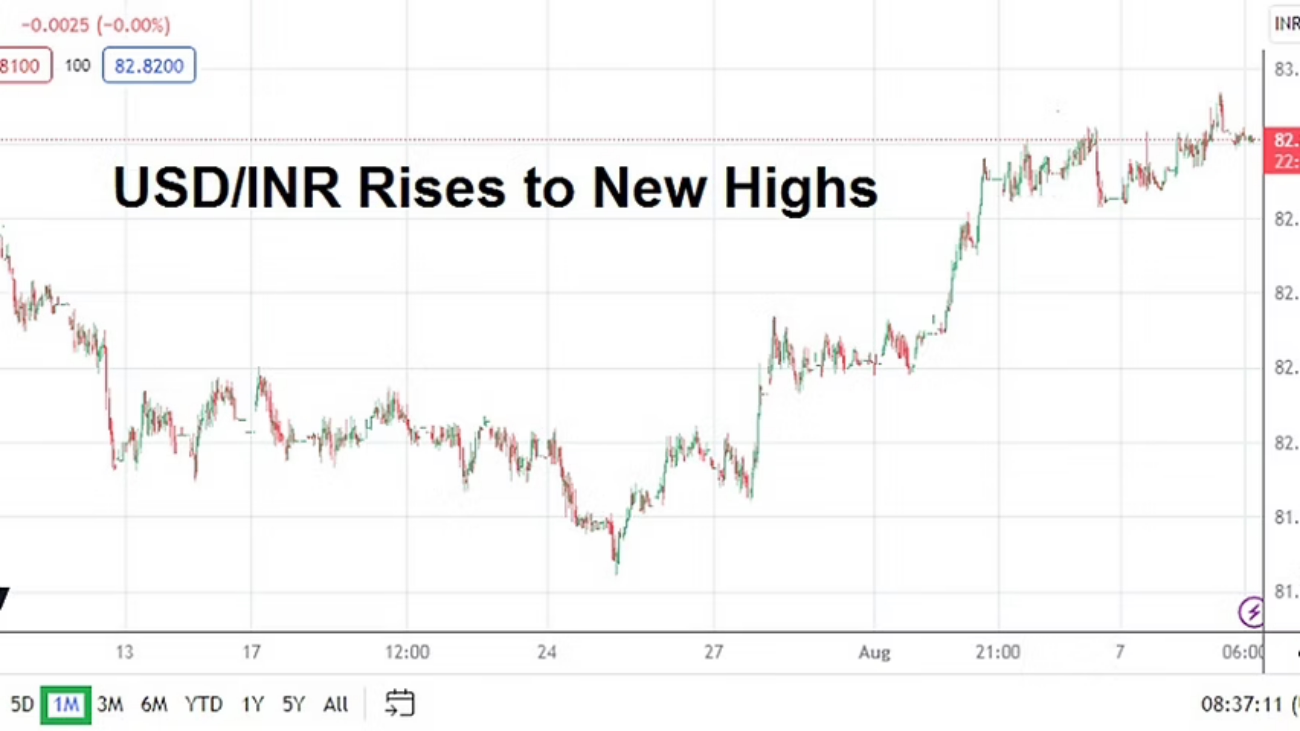
USD/INR: Higher Move Correlates and Political Shadows Loom
The USD/INR is near the 82.8150 ratio as of this writing the 9th of August, on the 25th of July the currency pair was near the 81.6500 level momentarily. Upwards movement of the USD/INR did produce price volatility in the last week of July, and on the 1st of August the Forex pair was near the 82.1700 ratio. Another dose of upwards momentum quickly occurred on the first day of August, and by the 2nd the USD/INR was trading around the 82.7650 mark.
From Wednesday of last week the USD/INR has essentially taken on a consolidated framework, speculators who are gambling on the USD/INR and need big movement to occur in order to facilitate profits have likely found the currency pair difficult to manage. Yesterday a high of nearly 82.9500 came within sight briefly, this as global risk adverse conditions arose because of the Moody’s rating agency downgrade of some U.S mid and small size banks regarding their fundamental ‘soundness’ and credit worthiness.
Rising interest rates from the U.S Federal Reserve have made it harder for many U.S banks to conduct their business, and loans have become more expensive for their clients struggling to keep up with the rising payments. Particularly if borrowers have the unfortunate position of holding ‘variable’ loans which cost more when interest rates are going up. This has also affected the housing sector in the U.S and in the U.K, as mortgages have become highly priced due to the Federal Reserve and Bank of England having aggressive interest rate policies which are affecting the cost of new home purchases.
The question USD/INR traders may be asking is what does this have to do with them?

The USD/INR Doesn’t Trade in a Vacuum
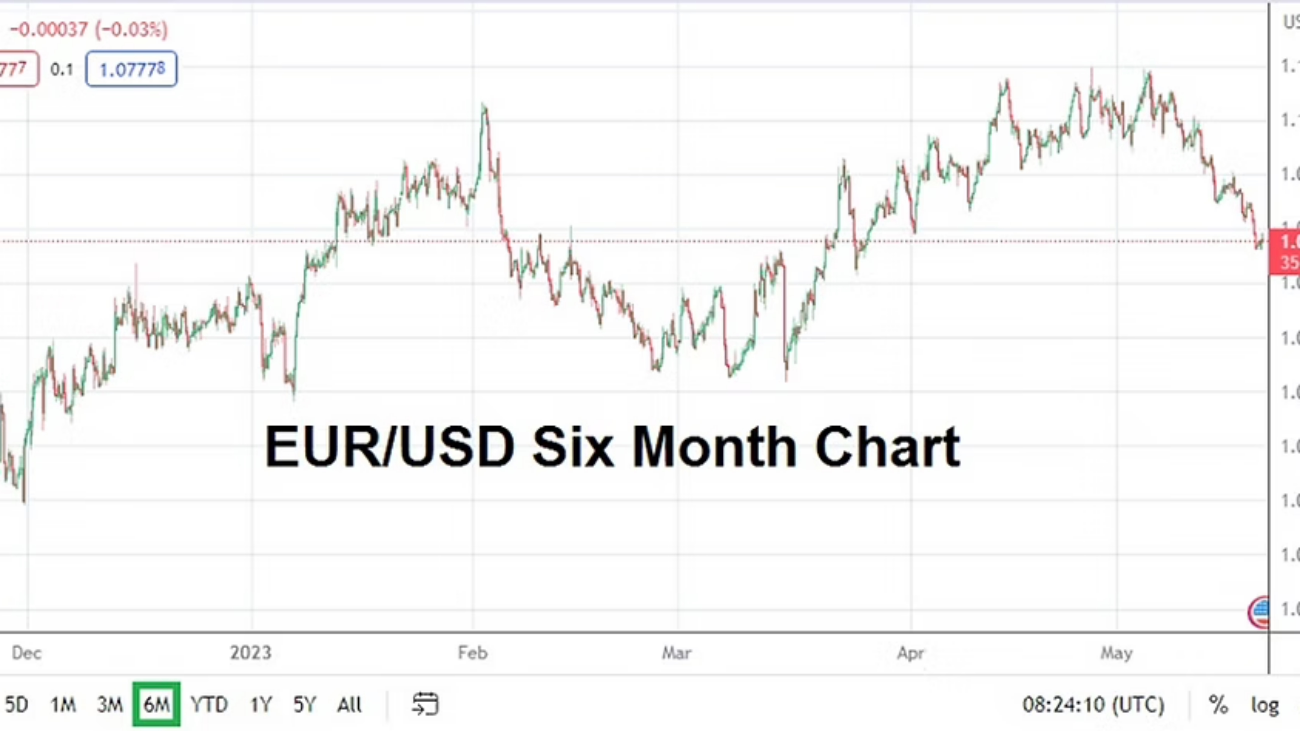
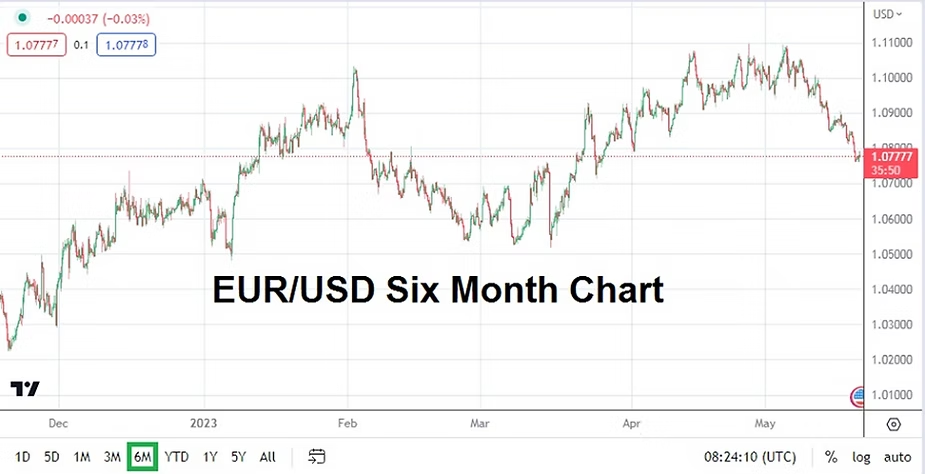
The USD/INR has risen in value the past two and half weeks as many other major currency pairs have suffered a similar fate. Nervous sentiment abounds in the global markets because financial institutions are wary of what the major central banks will do next. U.S economic data has been mixed recently, but this perspective depends on time frames regarding outlooks.
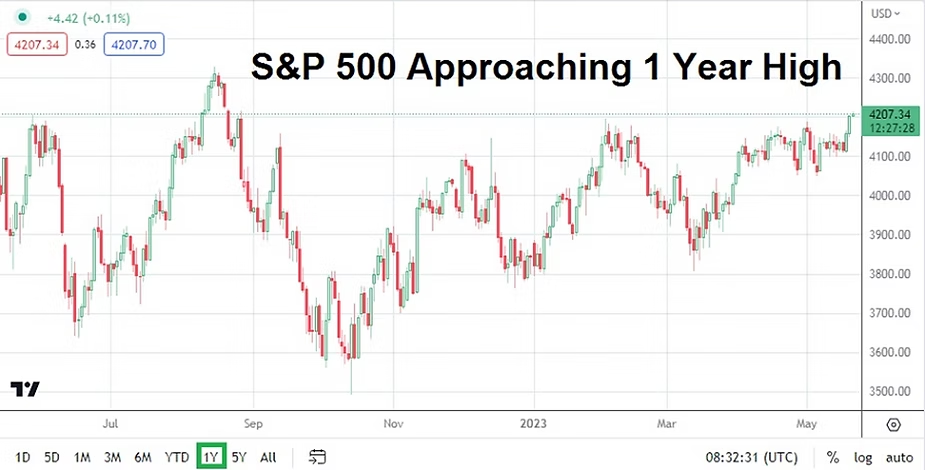
Short and mid-term viewpoints continue to point to complications regarding growth and inflation expectations and interpretations of U.S data. The ratings downgrade of some U.S banks from Moody’s yesterday, and early last week Fitch’s downgrade of U.S Treasuries all is related. Rating agencies are getting nervous, perhaps because they do not want to be blamed and held liable if the proverbial ‘fluff’ hits the fan over the mid-term. Rating agencies largely ‘missed’ the financial crisis of 2007 in a famously bizarre manner. The sudden emergence of rating agencies warning investors has made the USD stronger as global investors have become risk adverse temporarily. Yes, this might feel illogical, but the USD remains the world’s safe haven.
The USD/INR also certainly trades because of economic conditions affecting its value from within India. The Reserve Bank of India has a large hand in managing values and is known to be rather active regarding interventions. Yet the USD/INR is being ‘allowed’ to continue to trade near all-time highs. This as India’s status as a growing economic power has taken shape in the global financial markets the past year. The India government has not been aggressive regarding its interest rate policy, and has allowed inflation to seep into the domestic economy via a weaker Indian Rupee for a number of complex reasons. Purchasing goods from India abroad and the ability to invest in India by global financial institutions may be more attractive to those holding USD and needing to convert into INR only when the time is necessary.
Politics and the USD/INR Price Level as 2024 Elections Start to Lurk
From a political perspective too, let’s acknowledge a general election will take place in India in April and May of 2024. Economic decisions being made today and for the mid-term are certainly being affected by the ruling Indian government’s outlook and desire to remain in power. Having come off of yesterday’s highs in the USD/INR the currency pair does remain within sight of highs.
The 83.0000 level likely remains a key barometer for the USD/INR and the Reserve Bank of India is likely watching this value carefully. While it seems unlikely the India government wants the USD/INR to trace much higher because of the psychological implications, global risk adverse sentiment are making the higher values of the currency pair sticky. Tomorrow’s inflation data from the U.S will affect Forex and the USD/INR via the Consumer Price Index. Friday the U.S Producer Price Index will be published. A slight rise in the broad CPI results tomorrow is expected, while Friday’s PPI outcome is expected to match last month’s numbers.
If risk adverse trading remains evident today and the USD/INR holds its ground over the next 20 hours, the currency pair could find that its consolidated price movement from the past week suddenly changes. A higher tick in U.S inflation could be enough to cause the USD/INR to challenge the 83.0000 ratio. Speculators who are wagering on the USD/INR are cautioned to be pro-active regarding their risk management the remainder of this week.