post194

USD/ZAR Celebratory Parade Should be Put on Hold Awhile

USD/ZAR Celebratory Parade Should be Put on Hold Awhile

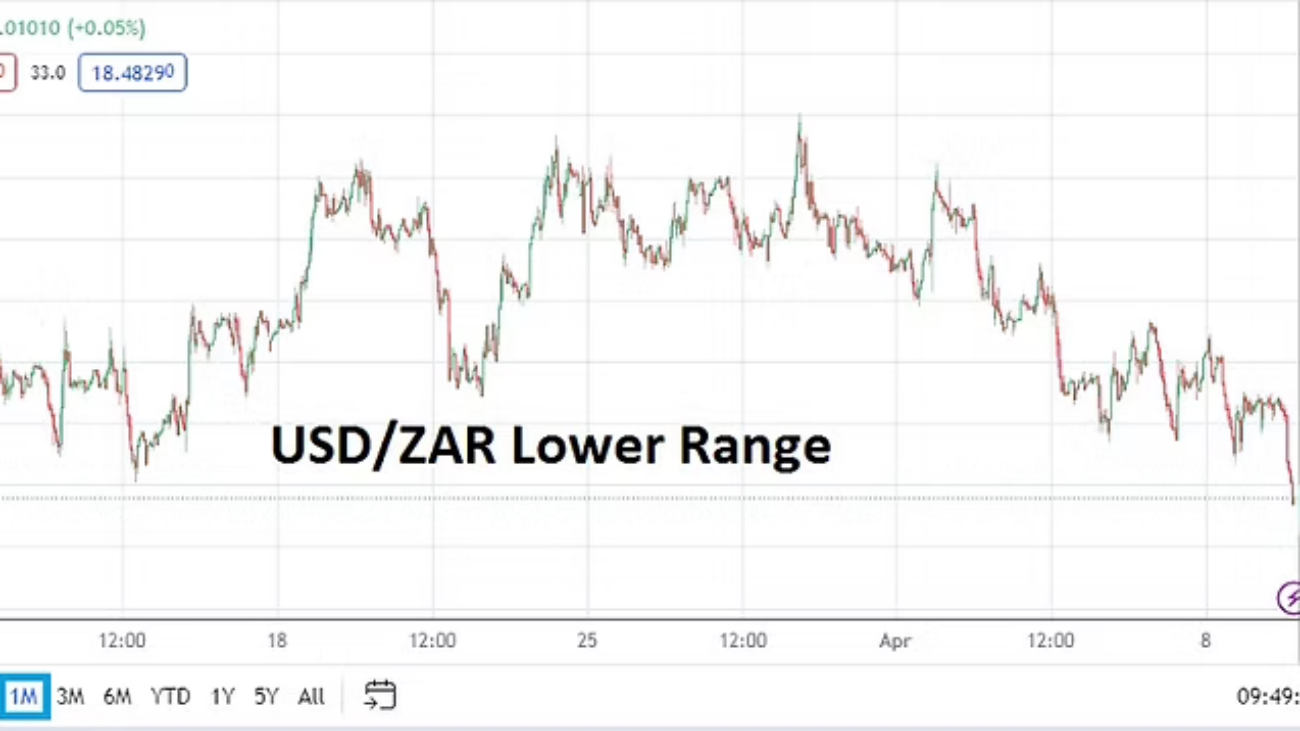
The USD/ZAR has produced a solid downward turn since the 1st of April when the currency pair was trading above 19.00000.

The value of the USD/ZAR as of this writing is near the 18.48000 mark as the currency pair fluctuates within Forex. The currency pair has produced a solid downturn since the start of April when it was above the 19.00000 level. The ability of the USD/ZAR to suddenly create a streak of bearish trading and make support levels look vulnerable is intriguing, particularly considering USD centric sentiment against many other major currencies the past week and a half has produced very choppy results in the broad Forex market.

The USD/ZAR is now trading at its monthly low via a technical perspective and the currency pair is testing values last seen at the start of January. The ability of the USD/ZAR to suddenly spark selling may be able to be explained because of the higher value of Gold which is trading at record prices while traversing near 2,360.00 USD currently. Mining makes up roughly 8% of the Gross Domestic Product value for South Africa.

USD/ZAR One Month Chart as of 9th April 2024

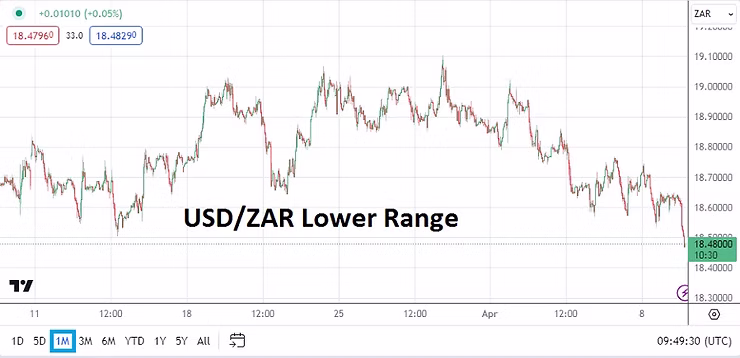
However, before a party is launched to start celebrating the reemergence of the South Africa Rand, traders should note the USD/ZAR was trading within its current value range on the 14th of December. Thus the South African Rand is simply taking up residence like many other major currencies including the GBP and EUR within known prices they were valued, when the U.S Federal Reserve ‘changed’ its monetary policy stance on the 13th of December to a more dovish outlook.

The choppiness within the USD/ZAR has been rather extreme over the past few months. On the 28th of December the USD/ZAR was trading near the 18.26000 ratio briefly, on the 23rd of February the currency pair was near the 19.40000 mark and testing values which had been last seen in October of 2023. While the price of Gold is at record values now, the worth of the precious metal might be a false correlation to the USD/ZAR, and technical traders may want to watch the currency pair’s support levels below as a place that reversals higher could be sparked.

U.S Data and Concerns in South Africa Regarding the Election

The U.S will release important inflation data on Wednesday and Thursday. Last month’s Producer Price Index numbers from the States sparked a wave of volatility in Forex and the USD/ZAR was not immune. The bearish cycle in the USD/ZAR has been noteworthy, but fundamental doubt exists regarding its ability to sustain lower price momentum. The U.S Federal Reserve does not appear any closer to cutting its Federal Funds Rate.

There is also a political shadow regarding South Africa elections. The nation’s vote will take place on the 29th of May. The results potentially could create instability and the need for a coalition government which may be difficult to attain without signing off on more costly social policies which the South African government cannot easily afford fiscally.

USD/ZAR Short Term Thoughts:

·         The 18.46000/18.47000 support levels in the short-term may cause reactions if challenged.

·         Traders are urged not to be overly ambitious, particularly if they still want to pursue downside in the USD/ZAR, the use of take profit and stop loss orders is appropriate.

·         Current price levels may spark volatility if financial institutions feel the price of the USD/ZAR has become unbalanced.

postN53.1

Anxious Results and Outlooks as Traders Brace for Week Ahead

Anxious Results and Outlooks as Traders Brace for Week Ahead

Speculators with visions of taking advantage of day trading perspectives often look for correlations within asset classes to help gain an outlook on another trading vehicle they may be considering. The problem with this like many things for day traders is that sudden gyrations in asset classes technically are often affected by positioning from large players who do not care what the ‘minnows’ are doing. Institutional trading is frequently done with long-term considerations.

S&P500 Index Future Three Months Chart as of 11th Sept. 2023

The Forex market has seen the USD grow stronger since the middle of July against most major currencies. At the same time charts via U.S Treasuries clearly demonstrate yields increasing. This is not a coincidence. Market behavior remains anxious as financial institutions look to lock in a certain amount of ‘guaranteed’ returns. Recent economic data has been lackluster from the U.S and this week important inflation numbers are certain to influence existing sentiment.

A side note for day traders who like to study economic data, ‘revisions’ via published data is starting to set off concerns among traders. Revisions to previous statistics reported are becoming a talking point among investors who believe the numbers they are looking at from many countries, including the U.S, need to be given a certain degree of skepticism. The Wall Street Journal published an article about this a couple of weeks ago.

WTI Crude Oil Three Months Chart as 11th Sept. 2023

In the coming days the price of Crude Oil may make headlines as the commodity enters this week near values last seen in November of 2022. The high price of Crude Oil will spark vocal warnings about potential inflation dangers. Speculative elements within the energy sector will be active and hope to take advantage of its trend. A sustained move above 90.00 USD per barrel would be intriguing.

Some analysts might try to correlate higher energy prices to increased demand from global manufacturing sectors, but this could be questionable considering many spheres are suffering from recessionary pressures. But again, the real facts and dynamics behind a potential sustained climb of Crude Oil prices are complex.

Smaller traders need to understand the news they are reading today was known by ‘insiders’ many days before and they have already acted on their knowledge to take advantage of prices.

The cuts in production from Saudi Arabia and other producers has sparked speculative influence, and perhaps the narrative that outlook for more Crude Oil demand could build if the U.S continues to demonstrate a ‘soft landing’. The chatter and explanations for changes to price are almost limitless and day traders need to be aware they will not be privy certain information.

This leaves the door open for day traders to consider trying to understand market behavior within the financial world. The answer for short-term speculators who are wagering on price direction is not a simple interpretation of technical charts, they should also consider fundamental knowledge of the asset mixed with an understanding of current market dynamics as sentiment shifts among institutional players.

In other news to look out for this week, traders who are active in the cryptocurrency space should continue to monitor the support levels that Bitcoin and Binance Coin are traversing. Incremental drops in value continue to be seen and a sustained reversal higher has been difficult to attain.

Monday, 11th of September, China New Loans – the amount of borrowing from businesses and consumers within China will provide insights regarding the strength (or weakness) of the domestic economy.

Tuesday, 12th of September, U.K Claimant Count Change and Average Earnings Index – the jobs numbers from the U.K will provide the GBP/USD with a bit of additional impetus. The U.K economy is in the spotlight and critics have become loud as many point to Brexit problems, which they claim are causing complications. However, within a global economy that is under pressure the fact that conditions in Britain are difficult doesn’t take a lot of time to find other correlations.

Tuesday, 12th of September, Germany Economic Sentiment via ZEW – the reading is expected to show a negative outlook again from the responses of institutional investors based in Germany. A result of minus -15.0 is the forecast. The report could shake the EUR/USD a bit momentarily.

Wednesday, 13th of September, U.K GDP – growth numbers will certainly get plenty of attention for Britain. The anticipated number is minus -0.2%. If the result is worse than the recessionary estimate it could spark more negative sentiment.

Wednesday, 13th of September, U.S Consumer Price Index reports – inflation statistics will be studied carefully and impact Forex immediately if the published results do not meet expectations. The Federal Reserve, institutional investors and the broad financial markets will react to the CPI data.

Thursday, E.U European Central Bank Main Refinancing Rate – the ECB is not expected to make any changes to borrowing rates. The European Central Bank is also anticipated to warn that economic conditions remain challenging and they are monitoring inflation and growth. Anything more than these words via the ECB Monetary Policy Statement and Press Conference could spark some EUR/USD price action.

Thursday, 14th of September, U.S Producer Price Index – like Wednesday’s inflation numbers, the PPI statistics will affect market sentiment regarding outlook and interpretations regarding the potential responses from the Federal Reserve.

Thursday, 14th of September, U.S Retail Sales – this data will give traders insights regarding the spending habits of U.S consumers, which is a key barometer for equity traders regarding consumer driven stocks, and also because an increase would underscore solid economic sentiment from the public.

Friday, 15th of September, China Industrial Production and Retail Sales – these two reports will provide additional insights about the Asian giant. Global investors continue to be concerned about the direction of the Chinese economy. Slight gains are forecast for both publications.

Friday, 15th of September, U.S University of Michigan Consumer Sentiment – the preliminary report is expected to have a reading of 69.2 which would be below the previous reading.