USDJPY 20260505

Our Friend the Japanese Yen and Forex Opportunities

Bank of Japan's 'Do As We Say' A USD/JPY FX Advantage Technically

Forex traders who have been keen on trying to venture wagers on the USD/JPY certainly cannot be faulted. As of this writing the USD/JPY is near the 157.720 vicinity, this after falling to lows around the 155.750 mark and below momentarily last Thursday, Friday and briefly yesterday. 

The Bank of Japan let it be known in the middle of last week that speculators should not be buying the USD/JPY because they – the BoJ – could and would intervene with strong selling to kill off the momentum higher. The ‘do as we say’ approach from the BoJ is a contrarian trader’s dream, but one that needs as always a strong dose of risk analysis.

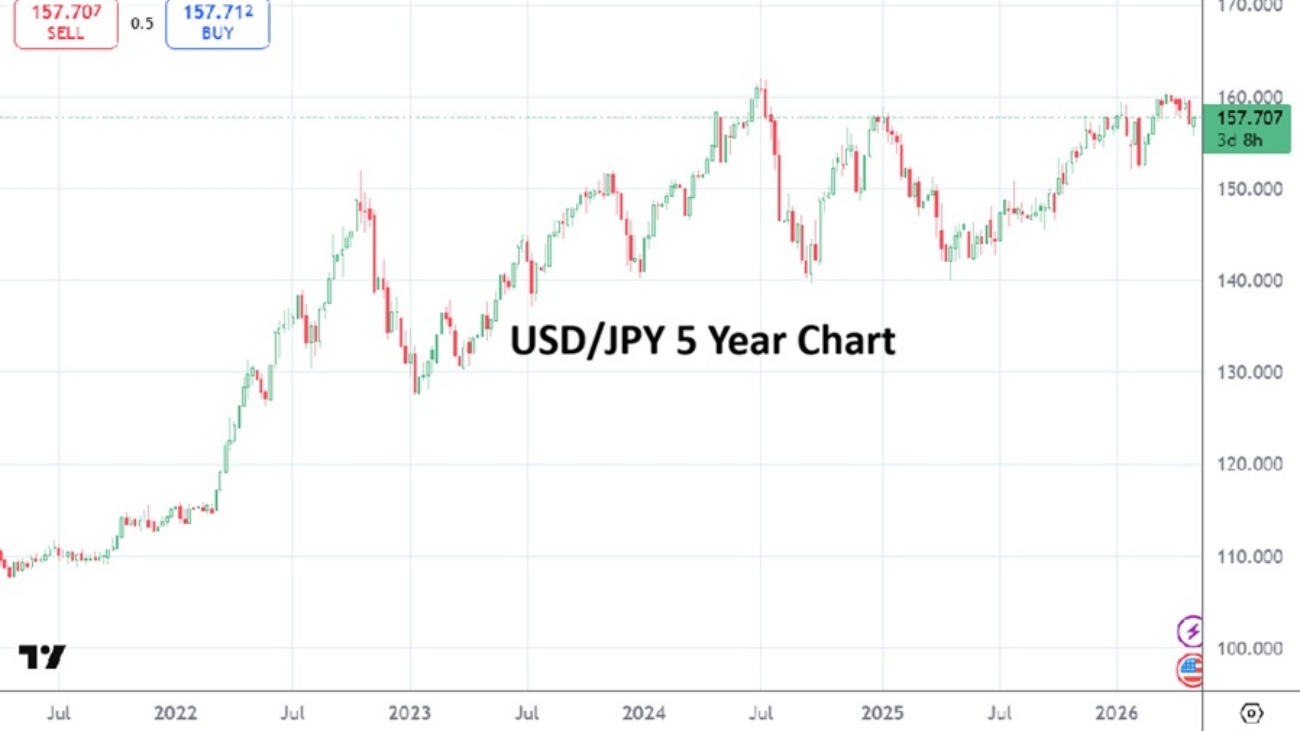
USD/JPY Five Year Chart on the 5th of May 2026

And this is where it gets properly intriguing for USD/JPY traders, because the Bank of Japan is literally setting the table for two different types of Forex trades when they threaten or actually intercede with interventions. One is a selling notion per the warnings, the second is a buying excursion for the emotionally stable after they think the intervention has run out of power.

A five year chart shows the immense pressure the Japanese Yen has been under as it has lost value against the USD. However, it is all about perspective depending on how a trader wants to chase momentum shifts. 

Technical traders can easily see that when higher vicinities are approached the USD/JPY is sometimes met with spikes downward. And then technically it is rather evident that support levels tend to spur on buying. The problem for buyers seeking support levels after Bank of Japan selling is to know when it is safe to become a buyer again.

If a trader has courage and wants to bet against the large players and financial institutions leaning into long positions of the USD/JPY, a selling position at higher marks is a solid choice. Yet, the other question then arises – where is resistance going to actually translate into a warning sounded by the BoJ in order to create the desired landslides lower in the USD/JPY?

Bank of Japan policy regarding interest rates has only been in question for over 3 decades now from outside observers who like to be critical. Yet, the conservative (and questionable) policies of the Japanese government via fiscal and monetary policy is a looking glass into practicalities for Forex traders. 

10-Year Japanese bond yields are now at twenty-nine year highs. The rate as of this writing is above the 2.50% level. The Bank of Japan Policy Rate remains low at 0.75%. While many analysts believe borrowing costs from the BoJ should be higher, what some might be missing is that the Japanese people are already being penalized via a weaker Japanese Yen. Higher borrowing costs and a weak Yen would likely not go over well with many Japanese citizens.

The Bank of Japan is in a difficult place regarding outlook as it tries to help keep exports strong, while also having to consider the higher costs of energy which is certain to hit Japanese industries over the mid-term. These considerations may cause some financial institutions to continue leaning into a buying outlook regarding the JPY, but near-term considerations must also be weighed as nervous sentiment cascades throughout the broad Forex market shifting abruptly. 

USD centric price action has been choppy, but overall the USD has also been weaker against many major currencies and even emerging market currencies. Yet, the USD/JPY remains within its higher realm. All of the Bank of Japan warnings to speculators telling them not to pursue buying the USD/JPY continues to make the BoJ sound weak and this doesn’t help sentiment surrounding the JPY. While the Bank of Japan can certainly intervene with massive amounts of buying the Japanese Yen – selling the USD/JPY – the central bank also is probably quite keen on making sure the JPY doesn’t get too strong. 

And this is where confusion must be put to the side, economics are wonderful when studied in a textbook, but the reality of trading the USD/JPY lives in the real world. Fiscal and monetary policies do not always work out the way governments intend.

The BoJ probably has a polite trading range they would like to see for the USD/JPY between 154.000 to 158.000 currently, but getting financial institutions to help achieve this realm remains difficult. The range between 156.000 to 159.000 likely remains a practical area for the BoJ as of now, one in which they believe their policies can work properly. 

Opportunities need to be viewed with a proper lens by day traders. Participating in the USD/JPY is a dangerous place because the currency pair has massive volume and the BoJ and U.S Federal Reserve often work together to gear valuations – even if they frequently disagree on techniques. Price velocity in the USD/JPY will continue to prove dynamic in the near-term and speculators need to practice patience and keep their risk taking tactics strict.

Copy and paste the text from AMT that you want to share

postN93

Leverage and the Holidays Often Leads to Costly Volatility

Leverage and the Holidays Often Leads to Costly Volatility

This may seem like an unfriendly reminder for this time of year, but holiday trading can lead to dangerous storms for traders. Keeping a realistic viewpoint regarding your ambitions during Christmas and New Year’s is important.

Most day traders cannot afford to have an outlook that is beyond the short and near-term. This is an ugly fact many speculators with less than deep pockets have to acknowledge if they are new to speculating. While large traders and financial institutions can maintain mid and long-term outlooks, day traders who do not have the funds to keep overnight positions need to operate in an entirely different fashion.

Trends via technical charts and fundamentals are crucial for all traders. Behavioral sentiment is a key ingredient too for all participants chasing assets. However, day traders also need to understand unique risk management limitations. The use of leverage is a vital dynamic, and can cause devastation fast when too much money has been wagered. The use of leverage by day traders effectively raises the probability that a trade will lose money.

Incremental changes in value to a Forex pair, commodity and equity share being traded on a brokers platform by a speculator using ‘borrowed’ money via an account that allows for margin often leads to quick outcomes that fail. Many brokers offer traders ‘polite’ leverage ranging from 10% to 100% in extra funds, this while enticing the speculator to the potential of profiting in a quicker and more robust manner. It should also be noted that when a broker is offering vast amounts of leverage, they are knowingly increasing a traders likelihood of losing. The use of leverage beyond 10% leads to plenty of expensive mistakes.

Unfortunately, the simple truth is if you can make fast money trading, you can lose fast money while trading. The use of the word speculating is simply a gentle way of not using the word ‘gambling’.

Traders tempted to pursue wagers during the next couple of weeks should remember a lack of normal volumes make many asset classes more volatile, meaning the use of leverage by speculators often leads to dangerous gyrations within their accounts.

Risk appetite has taken on a optimistic tone globally because of the upside U.S equity markets have been producing, while U.S Treasury yields are decreasing, but dangers still lurk. Day traders need to remain realistic regarding their pursuit of quick hitting trades during the holiday season, and make sure they use solid tactics while pursuing their outlooks. The trend may appear to be your friend, but short-term reversals in the wrong direction can cost money.

No one wishes for bad things, but speculators should also note that if risk adverse events occur during the holidays, that ‘negative news’ can often become amplified this time of year and cause more volatility. Speculative positions in Forex, Crude Oil and gold can produce rather wild results, and thin trading volumes can add to the swift changes in values.

postN69.1

USD/INR and the 83.3000 Resistance Level is Not an Illusion

USD/INR and the 83.3000 Resistance Level is Not an Illusion

Traders of the USD/INR for those who remain short-term speculators of the currency pair, as opposed to financial institutions which position holdings for corporations and large investors, may be perplexed about values and momentum over the past three months. It is abundantly clear the USD/INR faces a rather strong force when it approaches the 83.3000 mark. Yes, sometimes the Forex pair has traversed above this level, but the moves have been momentary and have been pushed back.

USD/INR Three Month Chart as of 8th of November 2023

It is not a conspiratorial thought to simply look at the three month chart of the USD/INR and see that when the 83.3000 level has come into play that selling pressure mounts. And it is not news the Reserve Bank of India is involved in the durability of this resistance level. Simply put the USD/INR doesn’t trade in a ‘free’ market manner, the constraints and persistence of the Reserve Bank of India to maintain a structured resistance value for the USD/INR is evident. The past month, and last five days of trading via technical charts shows the same dynamic. And it is important to point out the resistance level of 83.3000 has been sustained over the mid-term when global risk adverse trading has seen the USD gain strength against many other major currency pairs, meaning the USD/INR should have traded at higher levels.

USD/INR Five Day Chart as of 8th of November 2023

The Indian government is managing the USD/INR with a philosophy which allows the currency pair to remain within its weaker elements regarding the Indian Rupee, but not allow it to lose too much value. And it must be pointed out that the USD/INR does show an ability to trade lower and the Reserve Bank of India doesn’t appear to mind if this happens. The 83.0000 was challenged from about the 20th to the 24th of October rather consistently and even traded at a low of 82.9300 very briefly.

As global risk conditions remain fragile the USD has shown an ability to remain strong against most major currency pairs, but risk appetite has picked up over the past handful of days. The 83.2000 to 83.2500 range of the USD/INR has been tested with momentary bursts lower. Last week’s U.S Federal Funds Rate was held in place as expected at 5.50%, and financial institutions are starting to believe the Fed has reached the end of its interest rate cycle which has seen consistent hikes. Yes, the U.S is likely to keep its higher interest rates in place over the mid-term, but U.S Treasuries yields are starting to show signs of an incremental decline. If U.S bonds start to decrease via their yields this will help soften the USD.

Gold One Month Chart as of 8th November 2023

Gold has started to come of its highs, but still remains within an elevated range per its one month chart. If the precious metal continues to trade around its current values, this can be taken as a sign risk sentiment wants to shift. The key word is ‘wants’ and there are no guarantees. While financial institutions have shown the ability to digest the escalated concerns because of the Middle East crisis there is always the possibility developing news can escalate quickly. But will it?

Unfortunately, the media and pundits largely control the narrative that is given to the public. Most traders are not privy to the inner workings of the ‘temples’ in which governments work. The Reserve Bank of India doesn’t issue a statement every time it makes a move within the USD/INR. Nor do the governments of the world which may say one thing publicly and say something else behind closed doors.

Day traders want to be told what to do and how they should react. First off risk management is essential, entry orders are crucial so fills meet expectations. However, achieving the direction desired and wagered upon is a gamble. Take profit and stop losses orders are urged as protection.

If the Reserve Bank of India had not intervened in the USD/INR it is likely the currency pair would have reached the 84.0000 level and higher over the past three months. The question is if risks will decrease now that the U.S Federal Reserve seems prepared to potentially take a less aggressive stance. While it seems logical the USD/INR should have been trading at higher values, the control the government of India has practiced has kept the currency pair within a ‘safe place’ while risks were heightened.

If behavioral sentiment conditions start to turn more tranquil and risk appetite increases it is possible the USD/INR could actually continue to show some selling momentum. However, traders looking for declines in the USD/INR need to be conservative and they might want to wait for the currency pair to come within sight of resistance levels to wager on short and near-term movements lower. Overly ambitious selling is likely to remain an expensive mistake until the U.S equity markets show sustained buying and U.S Treasury yields are no longer threatening long-term highs. Until there is a legitimate shift in behavioral sentiment, looking for quick hitting changes of value in the USD/INR needs to remain the focus for day traders.