post265

Trading Thud Ending Last Week and Early August Insights

Trading Thud Ending Last Week and Early August Insights

The EUR/USD is near 1.15650 early this morning. The USD/JPY around 147.850. Forex has provided fast reversals and most major currency pairs are within well established known realms, but caution prevails. Friday’s U.S jobs numbers before going into weekend provided additional mud to filter through for those seeking clear outlooks. Were the employment numbers rigged by the Bureau of Labor Statistics?

EUR/USD Three Month Chart as of 4th August 2025

Questionable economic statistics have become an open sore spot for some analysts in the U.S, this has been a problem since the financial crisis of 2007/08 and ensuing years when politically expedient numbers were rumored to be in use so the Federal Reserve and U.S Treasury could work in a more comfortable manner. Let’s just say there are actual reasons why and how economic statistics could be used to hurt and help policies. For some evidence take a look at the art of revisions that has been practiced with key economic data the past handful of years. Financial institutions now need to consider the possibility that numbers cannot be trusted, interpret reports, try to decipher reality and consider impact.

Effect on the Federal Reserve is a big question. Fed Chairman Jerome Powell continues to preach uncertainty and say a wait and see approach is needed because of implications regarding tariffs. However, conspiracy theories are also somewhat blown out of the water regarding the recent jobs numbers, because the lackluster results will actually put pressure on the Fed to cut rates in September in order to help spur on a better jobs market. So in other words, financial institutions, big investors and day traders are back to square one.

The ISM Services Purchasing Managers Index stats will be published tomorrow for the U.S, but this report is likely to be a mere ingredient that affects the marketplace. Behavioral sentiment will remain the cornerstone in Forex, equity indices, Treasuries and commodities. August is typically a rather calm month of trading taking into consideration that holidays are being taken by many market participants, but as the S&P 500, Nasdaq 100 and the Dow 30 remain elevated and capable of achieving new record highs, the USD creates chaos regarding outlook influenced by a Federal Reserve that is now in a difficult spot, and tariff implications are contemplated it would be wise to keep an eye on all near-term outcomes.

Technical trading and computer generated algos will factor into conditions as psychological levels are challenged and perceptions are debated. Has the global marketplace grown comfortable to the tactics used by President Trump? While it is easy to say yes, there are still plenty of reasons to remain concerned, this because White House policy seemingly has the ability to shift without notice.

Which has helped produce what may be the golden rule that develops under the current circumstances. Stay alert, stay optimistic but practice caution. Financial institutions have always practiced the art of realpolitik behind closed doors to chase profits, but they must remain vigilant to fast reactions caused from the potential sudden fear of shifting doctrine. President Trump’s rather swirling mix of laissez faire enterprise, and his stark ability to express anger at those who stand in his way or disagree with him do make for a new trading reality. Cautious optimism is likely to rule the world of investment and speculation going forward.

post258

The Fed: Beating a Dead Horse as the Bulls want to Run

The Fed: Beating a Dead Horse as the Bulls want to Run

Yesterday’s lackluster and underperforming GDP results from the U.S highlights our often discussed doubts surrounding the Federal Reserve. While Jerome Powell definitely has a right to be ‘uncertain’ and express his concerns regarding sudden inflation emerging, he has also proven to be wrong. The Fed should have begun cutting the Federal Funds Rate three months ago.

10-Year U.S Treasury Yields Three Month Chart as of 27th June 2025

Although Powell may not be a fan of President Trump, the Fed Chairman and the FOMC has the ability to be more nimble in this era. Instead of being passive about interest rates, the Fed could have lowered borrowing costs and helped spur on the U.S economy months ago instead of watching GDP numbers falter.

For all of the consternation regarding potential tariff pratfalls, the effect from President Trump’s policies have not caused massive inflation. The Fed can begin cutting rates even before the next FOMC meeting in late July, but they will not. In fact, the Fed should now cut the Federal Funds Rate by 0.50% in late July, but again they won’t. We will be lucky to get a 25 point basis cut.

The Federal Reserve remains too passive and acts as if it doesn’t have data technology which can be more proactive. Instead, Fed Chairman Powell chooses to act as if cutting the Fed Funds Rate is an academic exercise and can be done via a polite semester like manner akin to a report card. Dangerously, the U.S is paying an exorbitant amount of interest on long-term Treasuries and short-term Notes. Lower borrowing costs would also help U.S consumers. Jerome Powell doesn’t seem to care about these factors, which raises the consideration regarding his loyalties.

U.S Dollar Index Five Year Chart as of 27th June 2025

In recent weeks there have been at least two FOMC members who have suggested that interest rates need to be cut sooner rather than later. And there are some financial institutions who are clamoring for aggressive interest rate cuts throughout the calendar year and into 2026 in order to jumpstart the U.S economy, this includes Goldman Sachs and UBS. Signs of evidence that interest rate cuts will develop can be seen in the 10-Year Treasury yields which have been eroding recently. Some may claim this is a false narrative and that it is merely risk premium starting to be discounted. Nevertheless yields have lowered in the past month.

Yes, President Trump speaks loudly and delivers brawling negotiations. July 9th is another deadline for tariff agreements. However, financial institutions and many governments have learned to cope with President Trump’s backstreet tactics, which academics like Jerome Powell are not fond of particularly. U.S stock markets are hovering near highs, but still cautious because they are waiting on impetus from the Federal Reserve.

If the Fed fails to deliver an impactful FOMC Statement in late July this will not be greeted well by investors. Many believe the Fed needs to react, and it is quite apparent the S&P 500, Nasdaq 100 and even the Dow 30 are positioning for gates to be opened allowing for a bullish stampede. The USD has been weaker too the past few months as large commercial players anticipate lower U.S borrowing costs. The time for the Fed and Chairman Powell to act is now, making it clear that cuts to the Federal Funds Rate are coming.

post240

Market Volatility Shelf Life Doesn’t Have an Expiration Date

Market Volatility Shelf Life Doesn't Have an Expiration Date

Updated: Apr 11

An associate in the financial world just wrote to me that “all bets are off”. Perhaps that is a solid way to think about the present speculative and investment situation. The tumultuous wave of hysteria in equity indices, Forex, commodities and U.S Treasuries are evident to everyone. President Trump’s tariff policies released last week lacked precision via perspectives for many investment institutions who suddenly had their mirage of calm destroyed. The realization that President Trump was undertaking what he had promised caught many by surprise who thought he was bluffing. Trump’s ‘Art of the Deal’ tactics are now being confronted by middlegame chess strategies from opponents.

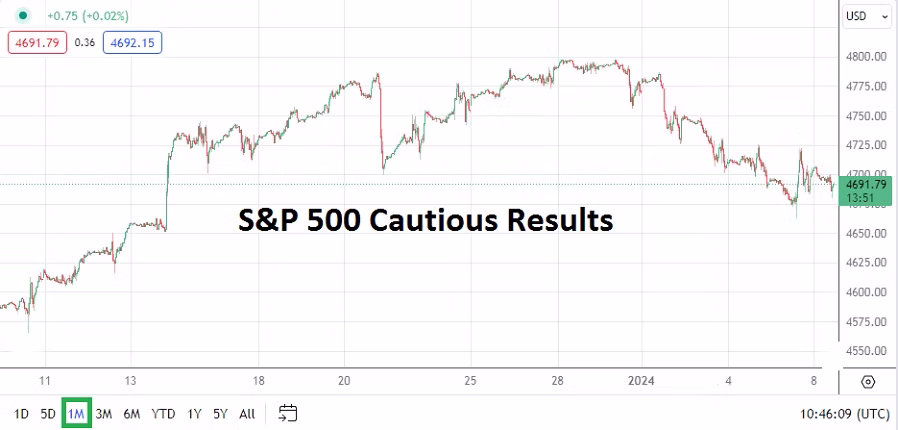
While the broad markets have boiled and folks look for calm to return, the prospect that current volatility has the potential to carry a long shelf life with no expiration date has to be considered. Yes, the financial world will become serene again. The return of semi-tranquil trading has been seen in the Nasdaq, S&P 500 and Dow 30 the past couple of days – only because the losses and gains depending on the index have been moderate compared to last Thursday’s and Friday’s results.

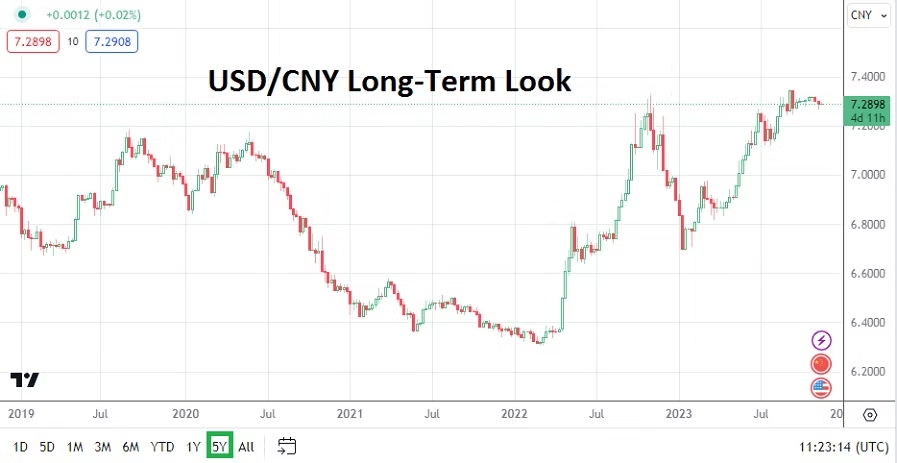
Yet the shadow of more violent trading remains crystal clear. China and the U.S are now exchanging loud threats which include higher tariffs and retaliatory measures. The USD/CNY is under scrutiny as devaluation by China appears an evident threat. And U.S Treasuries are being watched as some contemplate that China is undertaking a selloff of U.S bonds. Higher U.S yields on long-term Treasuries will create pressure via the amount of debt the U.S will be obligated to pay.

Vice President J.D Vance’s peasant comments about China were not helpful on Tuesday. Why must a hornets nest must be stirred up? China has now been hit with a 104% tariff from the U.S, this while China has vowed to ‘fight till the end’ in its media. Asian markets are selling off cautiously this morning as tensions reignite. Forex pairs such as the USD/SGD, USD/ZAR and USD/BRL should be watched as a barometer not only by currency traders, but by those who want metrics regarding how global economic sentiment and credibility of policies are being contemplated. Risk adverse trading in emerging markets will cause harm and has the earmarks of looking like a stiff penalty for nations trying to develop and raise their standards of living.

While the start of this week has been smoother in relative terms compared to last week, the lack of a comprehensive end game is still missing. There is merit to treat current circumstances with cautious respect. The mid-term outlook remains highly questionable as President Trump and his negotiation gambits are tested publicly.

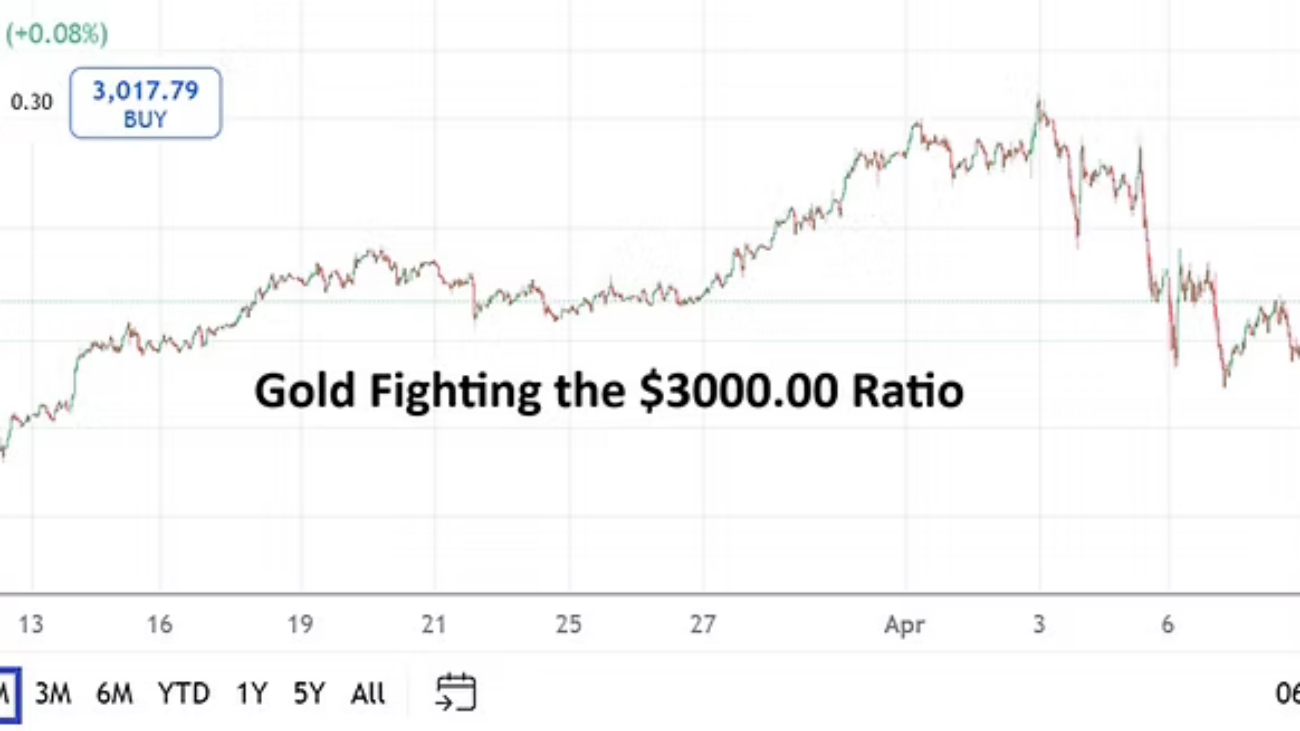
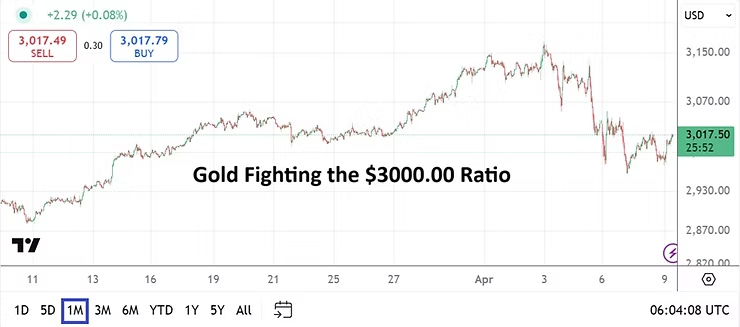
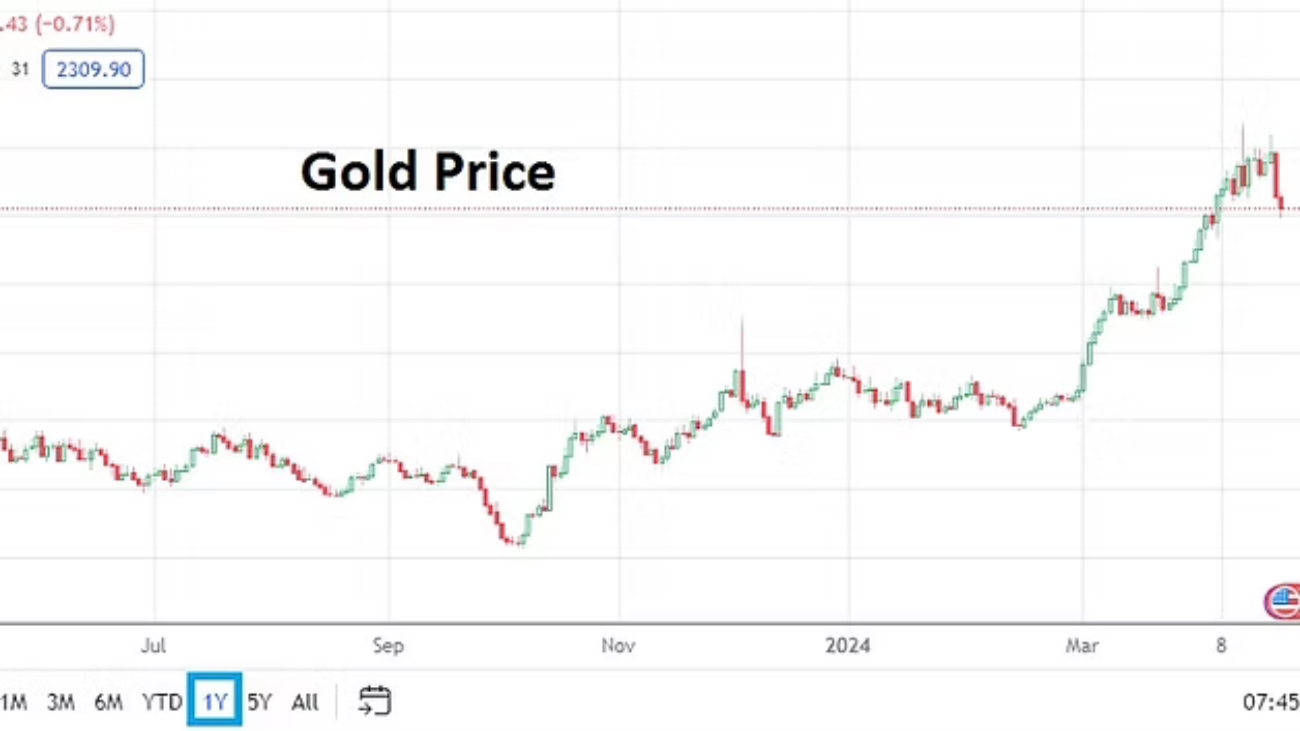
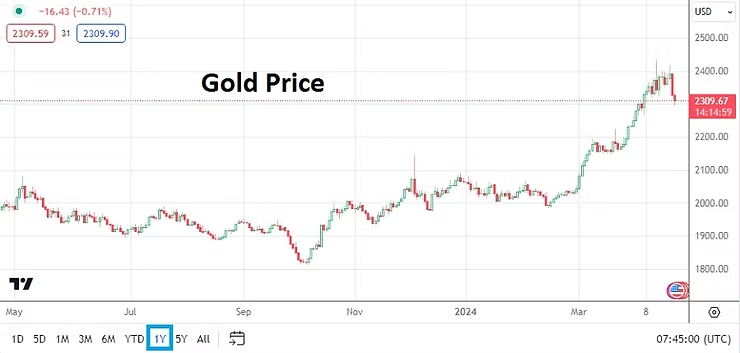
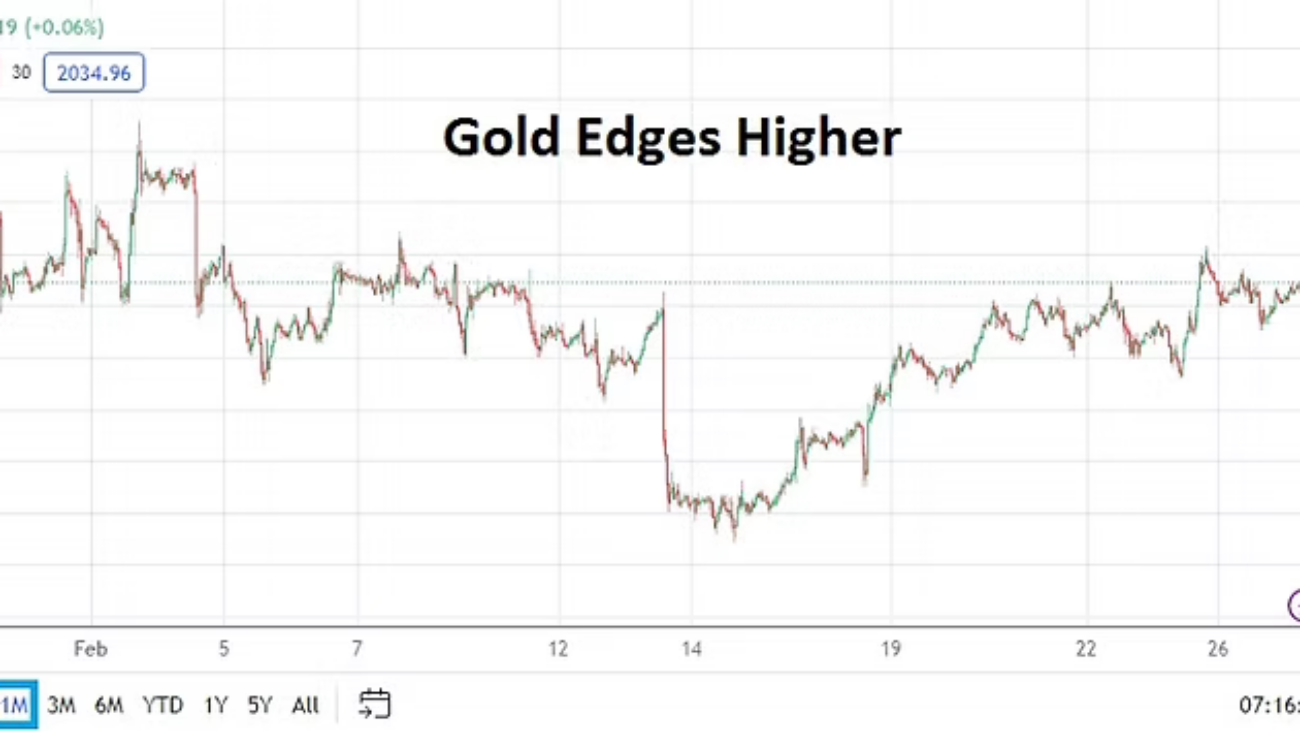
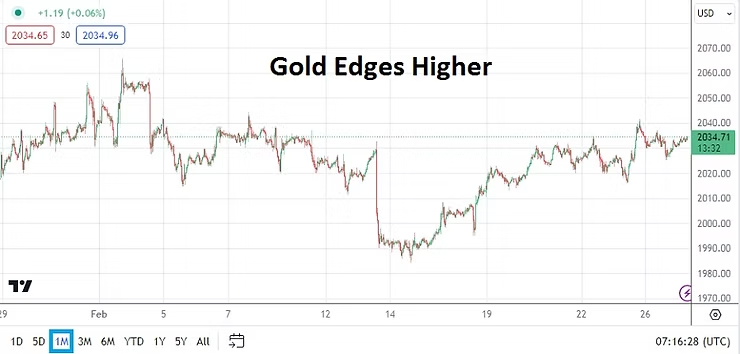
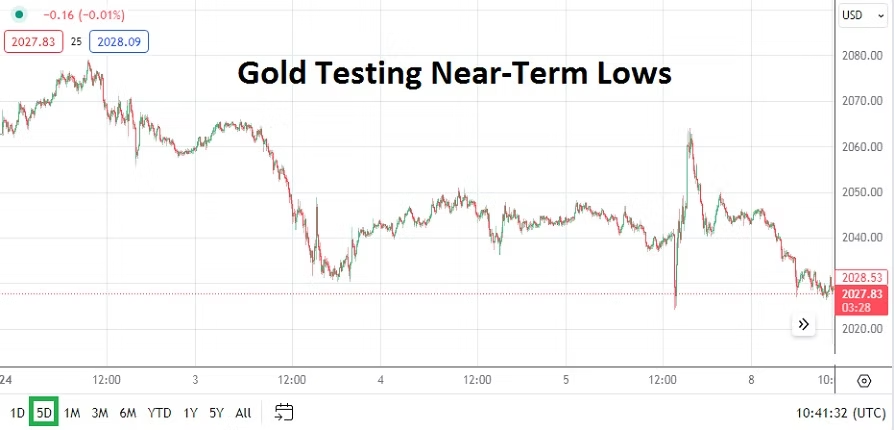
Gold One Month Chart as of 9th April 2025

Gold has stumbled back to the 3000.00 USD level, WTI Crude Oil is down and these two commodities are intriguing as a looking glass into the hearts of large players. Are people selling gold short-term because they believe inflation will lessen because of a recession which some are forecasting, or is it merely a speculative move? Gold certainly carries an important risk adverse power and its lower move showed be looked upon skeptically.

WTI Crude Oil One Month Chart as of 9th April 2025

Is WTI Crude Oil selling off because there is a belief there will be less demand due to fear tariff policies will influence a stumbling global economy? This viewpoint is plausible, the price of the commodity falling below 60.00 USD is a warning that large players are not comfortable with their outlooks and view downside risks as legitimate. The energy selloff in the past couple of hours is a negative barometer for what potentially is in store the remainder of the day in the broad markets.

The lack of finesse exhibited during these tariff negotiations is not palatable, the taste in the mouths of financial institutions has them worried. And outlooks via talking heads and analysts must be treated carefully by traders, this as they try to digest the onslaught of information and complex economic scenarios. Importantly, day traders should avoid getting caught up in the deleveraging talks surrounding the notion that large financial institutions will now pull money out of their U.S based investments in companies via stocks and Treasuries. Traders need to consider the bias of the people they are listening to and reading, and consider the scope and might of the U.S economy mid and long-term. There will be value found after the massive selloffs.

As a side note Warren Buffett has let it be known for a while he is sitting on a large amount of cash via Berkshire Hathaway. And folks should note that the annual meeting for Berkshire Hathaway is on Saturday the 3rd of May, which means people should get ready for insights from Buffett and his legions of admirers in the coming weeks. Certainly, Buffett’s comments and potential actions will be watched carefully.

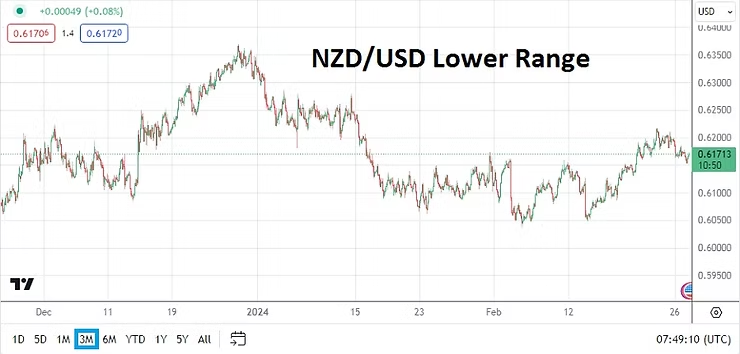
The U.S Federal Reserve has taken a wait and see approach to the Trump tariff implications. Calls for an immediate cut of the Federal Funds Rate have not caused Fed Chairman Jerome Powell to shift his cautious stance yet. The coming days could bring a different attitude from the Fed if equity markets and U.S Treasuries perform badly. In the meantime some central banks have said they might become more proactive – the Reserve Bank of New Zealand cut its interest rate by 25 basis points this morning to 3.50% and said it will continue to cut their Official Cash Rate if tariff policies create more negativity.

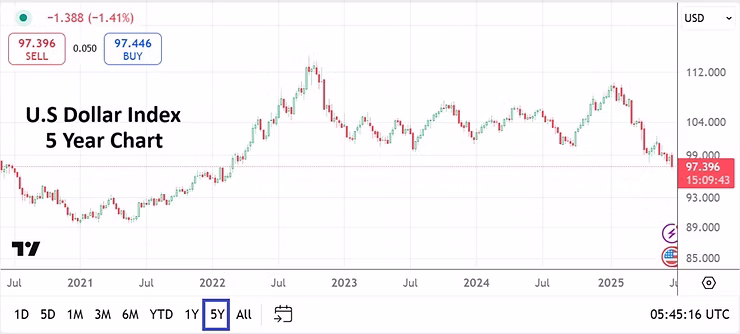
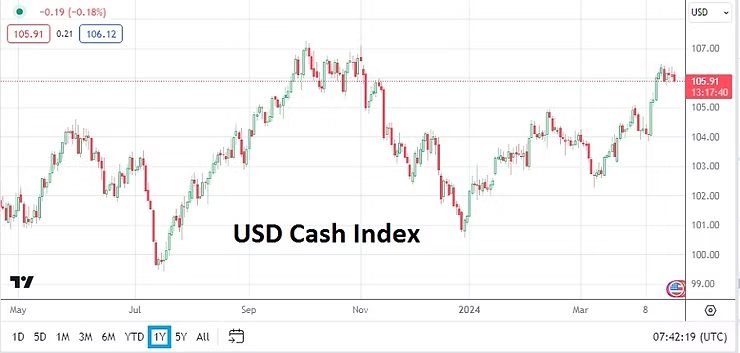
The consideration by financial institutions regarding the beginning of a paradigm shift of the global economy is justified. However, the ramifications of the Trump tariff policies have a long way to go before these present days will be able to be pointed to as the moment the world decided that it no longer wants to participate in the U.S marketplace. That notion seems farfetched. The USD remains the world’s reserve currency, its corporations remain extraordinarily large and valuable, and U.S Treasuries as they absorb current volatility and see yields moving higher in the 30 Year bonds cannot be viewed as an economic apocalypse – yet. Yes, the warning signs are meaningful and the Trump White House will need to respond diligently.

Again, the past week of trading has seen vast disarray, but we have been here before. It is important to recognize that current circumstances however do remain dangerous, this because we are still in the midst of the crisis. At some point, egos will have to be put to the side. The Trump White House will have to negotiate with China. China may be vulnerable, but so is the U.S. Why be belligerent and show no respect to each other? The remainder of this week’s trading will produce more whipsaw results. Selling looks to be in vogue once again this morning. Behavioral sentiment and understanding its power need to be contemplated as folks await sunnier days.

postR178.1

Tranquility: Forex, Equities and Treasury Yields Drama-Free

Tranquility: Forex, Equities and Treasury Yields Drama-Free

Sometimes no news is welcome. The markets though not devoid of drama, have been relatively tranquil. It is obviously summer in the northern hemisphere which helps bring about quiet, this since many ‘active’ market participants are off vacationing having been allowed to go on holiday. The implosion in the markets on the 5th of August after the dangerous riptides created by the combination of the Federal Reserve and Bank of Japan have certainly eased and evidence of the chaos is fading. Retail traders who are always looking at charts and for opportunities may have even been able to rest too the past week and a half.

USD/JPY Three Month Chart as of 20th August 2024

The USD/JPY as of this moment is near 147.185. The Nikkei 225 has recovered lost ground from over-reactive selling on the 5th of August. The value of the Japanese equity index is within extremely intriguing territory as financial institutions are clearly taking a wait and see approach regarding more BoJ and Fed rhetoric, combined with fundamental analysis of Japan’s economy and their companies in consideration. It is a healthy market dynamic, particularly via a notion the Nikkei 225 having reached an early August equilibrium is a solid result, this if you have a long-term viewpoint.

Nikkei 225 Three Month Chart as of 20th August 2024

The GBP/USD, EUR/USD, USD/SGD have all seen better results for traders who have been wagering on USD centric weakness. Even the USD/ZAR has produced a solid trajectory. U.S Treasuries yields are falling.

Gold Six Month Chart as of 20th August 2024

Yes, day traders definitely have different approaches compared to long-term investors, but if a speculator who is accustomed to quick trades synthesizes an outlook using the behavioral sentiment of long-term institutional players, they might find it helps build some foundations which help perceptions when deciding what to pursue. The use of barometers is always good too, this often gives a trader insights regarding market mood even if it is not an asset class they want to pursue. Gold is within record territory as it hovers around 2,500.00 USD per ounce.

Investors can argue all day and night about interpretations regarding results. The trading within gold the past six months, even since November of 2022 opens doors to a vast amount of complex explanations and narratives. They are too numerous to argue here, but the ability of the precious metal to march higher should continue to be watched. The recent surge higher since the end of June suggests – but it is again, only an explanation after the results have been seen – that gold traders believed the Federal Reserve would have to eventually capitulate and stop behaving hawkish about interest rates.

And this brings us squarely to this weeks events. Yes, the DNC is underway in Chicago and hopefully it provides a rather calm atmosphere free of political chaos via unwanted demonstrators. If investors can focus on the Fed’s FOMC Meeting Minutes report which will be published on Wednesday this would be good.

Because the Fed refused to sound dovish in their last FOMC Statement this created the potential for massive retaliation by institutional traders, and when coupled with the BoJ hike and their rhetoric, market turmoil in Japan and globally promptly ensued for a few days. However, because of recent inflation data again highlighting U.S prices via Producer Price Index are stable and decreasing in some sectors, and CPI has continued to come in below anticipated results, investors again firmly believe the Federal Reserve will definitely cut the Fed Funds Rate by at least 0.25% in September, and may be in a position to cut in November. Thus, the weakness and volatility of the USD which is clear to see via the USD Cash Index results.

USD Cash Index Three Month Chart as of 20th August 2024

Yet and potentially amusing tomorrow, the Fed’s FOMC Meeting Minutes may simply restate the cautious and very passive rhetoric from the last FOMC Statement. This because the Meeting Minutes are a reflection on thoughts shared at the Fed meeting, and we know what that outcome was already. Meaning tomorrow’s publication may scare some investors, but it shouldn’t. Tomorrow’s Fed paper may prove to be a non-event.

This sets the table for the Jackson Hole Symposium in Wyoming which starts on Thursday to produce a myriad of central banker statements led by Jerome Powell and his counterparts from the European Central Bank, Bank of Japan and Bank of England. The event is likely going to be important, but much of the talk which occurs in closed meetings is unlikely going to be made public.

post202

Speculative Notions: Gold and the USD as the Casino Lives

Speculative Notions: Gold and the USD as the Casino Lives

Notes on speculation via the prism of Gold and the USD, with questions about value as short-term wagers versus long-term investment are considered.

Speculative forces eventually run out of power, leaving investors and businesses to conduct their affairs via the assets they are using to proceed with enterprise as they judge fair market price.

Assets like Gold (commodities) the USD (Forex) and equities (corporate shares) are a battleground for those who are trying to make short term profits from price action movement (sometimes – volatility) versus those who are holders of the assets in order to run their lives (corporations, private businesses, finance).

Perhaps the speculative forces are not a Las Vegas environment completely, but it is a strange mix of risk management and gambling. And because of the price changes in these assets as supply and demand are transacted – the realization that the potential of hedging against sudden gyrations in price is used as insurance, but also as a dangerous speculative tool needs to be considered.

Futures, options and cash markets combine and are mixed like a stew consisting of trillions of USD value as global enterprise and financial casinos flourish.

Let’s take a look at Gold as an example. There is only so much physical Gold on the planet earth – a finite amount. There is only so much that can be taken out of the ground in a year. There is only so much Gold an individual can safely store in their home, before they have to use other secure venues. Central banks may have backed away from the ‘gold standard’ but they understand the importance of the precious metal as proven and tested by thousand of years of commerce. Gold can be used as the exchange of value for a good and this will likely remain the case for long time.

Gold One Year Chart as of 23rd April 2024

The price of Gold serves as a hedge against inflation. The value of Gold today roughly buys you the same things it bought you a thousand years ago, when compared to monetary units which fluctuate like the wind. Because cash in many cases throughout history becomes weakened, losing its value because of bad government policy which causes the people holding the ‘paper’ to lose confidence; and then creates the desire for the precious metal which has almost entered our conscious DNA as a source of value which doesn’t change.

We can speculate on what the Gold price will be today, tomorrow, next year, but we know the fluctuations will roughly equate into what our consciousness – logic – tells us what the main reserve currency that rules the land will be worth – in this case the USD.

For the time being, the USD acts as the reserve currency of the world and is weighed against the value of Gold – literally – remember Gold is valued per ounce in USD.

The ability of Gold to climb to record highs recently was put into question, because at the same time the USD was getting strong. This signaled to traders that a known speculative force in Gold was at play; yes, it could be said a speculative force was at play in the USD too, because of Forex and the Federal Reserve, but Gold rose the past month and a half dramatically while the USD also was gaining value.

USD Cash Index One Year Chart as of 23rd April 2024

Thus, suddenly the inverse correlation of Gold and the USD which are literally weighed against one another was suddenly off balance. The USD was gaining and gold was rising, and one of them was likely ‘full of hot air’ – an imbalance.

Meaning Gold had become inflated in value perhaps, because of speculative forces. While folks could point to geopolitics, and central banks such as China and Russia and maybe Iran wanting Gold because they are ‘angry’ at the U.S and want to signal they do not believe in the USD. There is only so much money these speculative forces have, and they hold the USD as a store of value too, which means if they bet too much on Gold they can find their positions – weight – imbalanced.

The USD remains the world’s reserve currency, and the value of the greenback particularly as the Fed has come under pressure, via the weight of inflation, and had to admit they cannot cut interest rates until inflation erodes has made the reserve currency stronger again. The use of the USD is easier than using Gold. There is not enough Gold in the world to transact business to business, person to person physical exchange everyday. Thus Gold becomes a ‘store of value’ via inventories not only in secure facilities but our minds too.

The past couple of days have seen Gold perhaps lose value again as the counterweights have come back into focus. It was bound to happen as long as the USD remains the world’s reserve currency in which value can be distinguished versus the commodity.

Speculative forces do run out of power, and now after Gold flirted with the 2,400.00 plus level recently, maybe Gold should return to its values which were seen in late 2023, which is where the USD Cash Index is essentially standing technically. Lets also remember where U.S Treasury yields were during this time, long-term bonds are a measure of interest rates and outlook via the Federal Reserve – used as an insurance and investment vehicle by those looking to lock in ‘returns’. Yes, Treasuries can be speculated on too, but their values coincide with USD legitimacy and the Federal Funds Rate.

It is a thought, a speculative notion, let’s see what happens. What should the speculative price of Gold be now compared to the USD? Should it be lower, closer to the 2200.00 to 2100.00 USD levels? The casino will give us the answers.

postN51

AMT Top Ten Miscellaneous Wonders for the 12th of April 2024

AMT Top Ten Miscellaneous Wonders for the 12th of April 2024

10. Free Press: Brazil and the Lula de Silva government are cracking down on dissent in social media. ‘X’ – formerly Twitter – led by Elon Musk is fighting back and refusing to cooperate as Brazilian ‘leadership’ attempts to intimidate the ‘loyal opposition’ in the legislature.

9. GROOT: Nvidia is working on ‘humanoid’ robotics. Project GROOT was presented by Jensen Huang at the GTC Conference. The synergy between machine learning, semiconductors and robotics is an evolution taking place before our eyes. Tesla is involved in similar research as it works on Optimus.

8. Hot Chocolate: Speculation in Cocoa has brought the commodity above 10,400.00 USD per metric ton as of this writing. Questions about gravity and hypersonic speculative values are logical at this juncture.

7. Seclusion: Do humans still need each other? People are relying on their mobile devices for social interactions. Robotics with AI capabilities will make our existence potentially more lonely. Open source software DOBB-E will be part of this future as household chores are taken care of by ‘machines’.

6. Iran: Those with holiday excursion plans which include Teheran this weekend may need to check on ticket availability due to the possibility of flight cancellations.

5. Fed Liberty: President Joe Biden this week spoke about an interest rate cut coming from the Federal Reserve this year, yet Consumer Price Index statistics are demonstrating escalating expenses. Current U.S government leaders may want to spend less on ‘vote buying’ via student loan forgiveness and think about conservative fiscal practices. Why should Americans who choose not to attend universities pay for those who did via higher taxes? Are Fed and Treasury officials still independent?

4. Risk Averse: Gold is within sight of 2,400.00 USD this morning. In the meantime U.S bond yields have inverted completely except for the 30-Year issue. Financial institutions are showing nervous behavioral sentiment.

3. USD Centric: Forex has seen reactive trading this week as financial institutions begin to conclude the U.S Federal Reserve’s monetary policy ‘over time’ will remain disturbingly difficult and full of doublespeak.

2. Caution: Mixed results are flourishing in the major U.S stock indices as the Nasdaq 100 and S&P 500 touch late March values, and the Dow Jones 30 has returned to February levels. Higher than anticipated interest rates are causing turbulence.

1. Energy Illusions: As the prices of food, transportation and housing escalates isn’t it time governments start to question their ‘green’ policies which are making the costs of energy production more expensive? We all want a clean planet, but logical strategies must be applied to create efficient use of resources.

post 189

Forex and Equities Storm: Crucial Data will Impact Markets

Forex and Equities Storm: Crucial Data will Impact Markets

Today will start out with a rather important consumer report from the U.S and day traders should stay alert. It is easy to point to every day and week as being a crucial circumstance for speculators, because that is what gets their juices moving and gets them to wager in the markets.

However, given the rather choppy conditions in Forex seen since the last week of December and pointing to the results of the Consumer Price Index on the 13th of February and the storms created in FX, traders hopefully have enough muscle memory to remember how they felt in the midst of the whipsaw conditions which were experienced only two weeks ago.

Central bank outlooks are fragile among analysts and financial institutions. Simply put this week’s data could prove to be more important than the CPI numbers. Consumer sentiment, GDP, and inflation statistics are all on the U.S roll call this week.

Other geographies will make news too and impact global markets. Last week’s impressive results from Nvidia created another massive wave of positive momentum in equity indices. The Nasdaq 100, S&P 500 and the Dow Jones 30 all have hit record values. Japan’s Nikkei 225 has surpassed record heights.

Yet, other barometers do highlight caution abounds too, U.S Treasuries yields have edged upwards and are touching values which show there is nervousness regarding monetary policy from the U.S Federal Reserve. This week’s data will deliver more insights for investors, and Treasuries are certainly going to react to the economic reports.

Gold One Month Chart as of 27th of February 2024

Gold has edged higher in the past week and is around the 2034.00 USD mark as of this writing. The slight climb above the 2020.00 ratio which has worked like a magnet recently, indicates some traders may be leaning optimistically towards a weaker USD mid and long-term. These folks may be proven correct, but day traders should note that the 2030.00 ratio in gold is below highs seen in December, January and early February – which indicates nervousness. If day traders do not believe gold acts as an inverse barometer for the USD, simply look at the results of trading when the stronger than expected CPI numbers were released on the 13th of February. Gold fell to a low near 1985.00 on the 14th, this was not a coincidence.

Again, while it is easy to sound alarms and jump up and down and proclaim every week important for day traders, the acknowledgement that this week’s economic data is significant should not be treated as hyperbole. You have been warned.

Monday, 26th of February, U.S New Home Sales – yesterday’s results showed another decline in the housing market, and the previous month’s number was revised downwards. The outcome may point to concerns about U.S mortgage rates which remain stubbornly high for those considering purchases.

Tuesday, 27th of February, U.S Durable Goods Orders – a rather large drop of minus -4.9% is expected. The Core data however is expected to produce a rise of 0.2%. These numbers will be a good precursor for the important consumer sentiment which will follow one and a half hours later.

Tuesday, 27th of February, U.S Consumer Confidence via the Conference Board – the results of the important readings have shown intriguing gains since late fall in 2023. While improvement in sentiment has been recorded, revisions lower have also been seen in the previous three reports. The outcome of today’s report should be treated carefully. If another higher reading is produced this may create some positive momentum in the USD momentarily.

NZD/USD Three Month Chart as of 27th February 2024

Wednesday, 28th of February, Reserve Bank of New Zealand Official Cash Rate and Monetary Policy Statement – while many Forex traders will be sleeping when the RBNZ makes its important pronouncement, New Zealand inflation data has remained strong and a conservative government is in charge politically that is pro-business. The question is if the Reserve Bank of New Zealand will go against the grain of other global central banks and actually increase their interest rate while others seem to be adamant about trying to become less aggressive. While many analysts believe the RBNZ will sit on its hands and act according to the whims of others, if an interest rate hike is announced global Forex traders should take note because it would be a signal that central bankers are uneasy regarding their rhetoric and not in agreement.

Wednesday, 28th of February, U.S Preliminary Gross Domestic Product – a gain of 3.3% is the expectation from many analysts. The previous reading was stronger than anticipated. If growth numbers in the U.S come in higher than estimated the USD will react with strength. The Federal Reserve would like to see the outcome meet the expectation or come in below, this so the U.S central bank can consider reducing the Federal Funds Rate late this spring or in early summer. However, if a significantly strong growth number is demonstrated this would cause turmoil in Forex.

EUR/USD Six Month Chart as of 27th February 2024

Thursday, 29th of February, Germany Preliminary Consumer Price Index – a slight gain is expected in the inflation number. The EUR/USD has been struggling as stagflation concerns shadow the European Union. A higher inflation result will not be welcomed by the ECB, which would prefer to cut interest rates sooner rather than later. The German number should be watched and it will cause an impact if there is a surprise. The EUR/USD has been turbulent and is likely to produce more choppy conditions depending on the parade of data results this week.

Thursday, 29th of February, U.S Core Personal Consumption Expenditures Price Index – traders who have felt the previous economic reports already have caused intense reactions this week should brace for this inflation report. A result of 0.4% is expected. The Federal Reserve admits this is one of the most important publications that it monitors. This means financial institutions react to this report too. If inflation were to come in higher than expected, like the CPI results from two weeks ago, this would essentially kill off expectations of a May interest rate cut from the Fed. The USD will react to this report and so will U.S Treasury yields, which means equity indices will also be affected. A weaker inflation report is being wished for by many market participants, but will this be the result?

Friday, 1st of March, China Manufacturing PMI – not to beat a dead horse, but China’s economic data has been poor and this report will be viewed as important. Another negative outcome is expected. Transparency regarding economic numbers from China is a worry for investors. Conditions in China are being watched and it is important for traders to eliminate bias regarding their perspectives. China may be struggling, but its importance as an economic power is still very much in evidence. Foreign direct investment into China is diminishing, but plenty of investors still have ‘skin in the game’ and will be affected by the manufacturing reports.

Friday, 1st of March, U.S Manufacturing PMI via ISM – a slightly improved manufacturing reading is expected. However, because of the U.S data releases from the previous days, the results may be looked at only momentarily and not cause much of a reaction from market participants. Traders may be looking forward to the weekend after this week’s economic publications in order to rest.

postN87

AMT Top Ten Miscellaneous Flakes for 19th of January 2024

AMT Top Ten Miscellaneous Flakes for 19th of January 2024

10. Music: Come On, Come Over performed by Jaco Pastorius. The bass playing on this song is magnificent.

9. Cybersecurity: Prospect of quantum computing is making Central Banks nervous, quantum development will impact blockchain and make current payment systems vulnerable and perhaps obsolete. Post-quantum cryptography development is vital.

8. Frigid Weather: Tesla owners have dealt with battery power failures as winter temperatures have plummeted in Chicagoland and elsewhere. EV energy solutions need to improve.

7. China: Over the past 11 months FDI (foreign direct investment) has dropped more than 10% in the nation, an estimated short fall of 145.51 billion USD. China’s Foreign Direct Investment release has seemingly been pushed off to next week. Shanghai Composite (SSE) near 2832.28.

6. Energy Sector: WTI Crude Oil still priced politely as ‘interactions’ with Houthis flare. Natural Gas values remain near lows while North America suffers from a deep freeze.

5. Risk Assessment: Iran and Pakistan, although expressing ‘brotherly love’ for each other, have exchanged missiles across their respective border aimed at extremists.

4. U.S Treasuries: Inversion has almost ended completely, 5-Year Notes up to 30-Year Bonds yields have returned to ‘norms’.

3. Gold: Price of the precious metal near 2027.00 USD having bounced higher after challenging the 2000.00 vicinity on Wednesday.

2. Data: Consumer Sentiment reading via University of Michigan on the schedule today, this could provide impetus to markets that appear to be waiting for the next big push.

1. FX Volatility: USD strength has pushed the greenback towards important mid-term resistance in Forex as many day traders are likely still fighting the trend.

postN97.1

Cautious Trading as Key Data and Outlooks Await Impetus

Cautious Trading as Key Data and Outlooks Await Impetus

The start of trading this week could prove to be slightly adventurous for speculators as financial institutions return to the markets and start to take positions for their clients. Having survived the past two and a half weeks of holiday season trading, market action will now focus on immediate, mid and long-term goals and outlooks depending on time frames and targets. Slightly nervous trading was on display last week, but some traders may believe their is plenty of room for more optimism and may be suspicious of the results delivered.

Gold Five Day Chart as of 8th of January 2024

Day traders should look at some barometers before they participate in the near-term. Gold has come off highs seen late last week, but remains within the higher elements of its six month price range. Its selloff from apex values last week perhaps correlates to U.S equities and USD turbulence which has also been experienced.

Last Friday’s reaction to the U.S jobs numbers was fascinating. The numbers delivered an initial shock to folks who wanted to react quickly. Hiring the last month increased more than expected, which might have caused the momentary bullish surge in the USD. Only to be confronted swiftly by further investigation of the jobs data which showed previous months statistics had been revised downwards. This acknowledgement set off selling of the USD and technical whipsaw results.

Day traders participating in Forex this past Friday likely experienced a range of emotions. If the market correlations are correct regarding the USD and the reactions seen, trading in gold also seemed to mirror the price action. Interestingly, gold touched a low of nearly 2024.00 USD on Friday in the wake of the jobs report, surged higher to around 2064.00 and then reversed lower again.

The notion that gold is trading within sight of Friday’s lows is interesting for both the precious metal and trying to understand where USD sentiment will lean early this week.

Behavioral sentiment remains rather optimistic, however nervous headlines during the holiday season may have caused cautious shadows to grow darker, particularly as light trading volumes affected results. Today and tomorrow will prove interesting in the broad markets, this as financial institutions return in full and as they brace for U.S inflation numbers later this week.

S&P 500 One Month Chart as of 8th of January 2024

Nervous short term trading is likely today and tomorrow as price equilibrium is sought. U.S equity indices have backed away slightly from their flirtations with all-time highs, but even as selling developed the past week highs are still in sight and are likely still being dreamed about by many institutions. U.S Treasury yields will also be a good indicator for Forex traders early this week regarding how comfortable financial institutions are with their current outlooks.

Monday, 8th of January, Germany Factory Orders – a slight gain of 0.3% was reported today, which was below the 1.1% expectation. The German economy is starting to show signs of economic growth, but has major hurdles to still climb. The lackluster German numbers may keep the ECB in a rather neutral stance for the mid-term. Which might help a bullish EUR/USD outlook if the U.S Fed is seen as the first major central bank which will have to cut interest rates.

AUD/USD Three Month Chart as of 8th January 2024

Tuesday, 9th of January, Australia Retail Sales – the anticipated climb of 1.2% is significantly higher than the negative -0.3% result from last month. A good outcome via the Retail Sales could help the Australian Dollar reignite some positive momentum. CPI data will come from Australia on Wednesday, which will certainly affect the AUD/USD too.

Wednesday, 10th of January, U.S Ten-Year Bond Auction – though day traders may not be too involved regarding the sale of U.S Treasuries, the results from the auction will have an affect on Forex. U.S Treasury yields should be monitored.

Thursday, 11th of January, U.S Consumer Price Index – a slew of CPI results will get the attention of financial institutions. The inflation data is expected to show a slight decrease in the Core CPI result, but show a slight gain in the broad number. This will likely be the most heavily traded day since the third week of December. There will be a reaction from the inflation reports. If the numbers come in around the estimates this may help the bearish mid-term outlooks for the USD. If the results are shockingly stronger, the USD would turn bullish. Day traders need to be careful in the midst of the Consumer Price Index publications because volatility is expected.

Friday, 12th of January, China CPI – a decrease is expected from the Asian giant. Deflationary concerns are shadowing China’s economy. The expected number of minus -0.4% would actually be an improvement compared to the last reading which was minus -0.5%. The USD/CNY has been rumored to have been experiencing some ‘hands on’ management from China. Investors continue to be nervous about China’s economic outlook and would like to see signs of improvement.

Friday, 12th of January, U.K Gross Domestic Product – a gain of 0.2% is being anticipated. Any growth from the U.K GDP would be welcomed considering the recessionary data which has been lingering. The GBP/USD will react to the results and bullish momentum in the currency pair could be sparked by a better than anticipated number.

postN51

AMT Top Ten Miscellaneous Musings for the 17th of November

AMT Top Ten Miscellaneous Musings for the 17th of November

10. Book: The Art of War by Sun Tzu.

9. Music: Pablo Casals playing Bach’s – The Six Cello Suites.

8. Cricket: India and Australia will meet in the World Cup Final this Sunday in a match between two of the world’s best squads.

7. Gold: The precious metal is trading within sight of its October highs and may find speculative buyers looking for potential upside via wagers.

6. Commerical Real Estate: WeWork bankruptcy knock on effects will cause additional strains in U.S market, this as the sector struggles with vacancies in this era of ‘remote’ employees.

5. Risk Appetite: U.S equity indices are at three month highs, U.S Treasury bond yields at one week lows as optimism grows in the outlooks of long-term investors.

4. Data Watch: Retail Sales numbers from the U.K, and U.S Housing Starts and Building Permits statistics will be released today.

3. USD: Dollar Index futures are trending lower and near values last seen in the third week of September as financial institutions brace for a weaker USD mid-term.

2. U.S Treasuries: Yields are incrementally declining, helping push the USD lower, and creating positive equities momentum, this as U.S bonds appear ready to sustain a cycle lower if investors can remain tranquil.

1. Federal Reserve: Inflation data via the CPI and PPI were weaker than anticipated, and the U.S Fed’s December FOMC Statement should begin to sound less agressive.

postN70.1

Yields, Credit Worthiness, Trading and Geo-Political Risks

Yields, Credit Worthiness, Trading and Geo-Political Risks

Traders participating in Forex and equity indices this week may want to consider finding a very quiet room and avoiding the loud conjecture which is certain to be heard. U.S bond yields will remain a focal point the entire week, and Moody’s new negative label regarding U.S credit worthiness issued late on Friday will not help the Federal Reserve and Treasury as the size of U.S debt is called into question once again. Forex markets provided speculators velocity and volatility last Thursday and Friday, and this week’s risk events are certain to cause behavioral sentiment turbulence.

USD/CNY Five Year Chart as of 13th November 2023

Added to the ‘fun’ for speculators this week will be the APEC Summit gyrations which will be held in San Francisco, and includes a scheduled meeting with President Joe Biden and President Xi Jinping this Wednesday. The meeting comes at a critical time as geo-political and economic concerns come from Asia, the Middle East and Eastern Europe.

However, traders should not allow their emotions to grow too nervous, financial institutions actually showed a taste for U.S equity indices last week and the price of gold has declined, while the value of Crude Oil per barrel has also eroded. This shows that even in the midst of carnival like barking from pessimistic naysayers, that investors are still participating in the broad markets and makeing bets on the notion that optimism will continue to show sparks of light.

Monday, 13th of November, U.S Federal Budget Balance – this report is certain to be rather negative if studied closely. However, investors already know this story, and last week’s Moody’s downgrade of U.S credit accountability has already rang alarms. Thus, this report will likely fall on deaf ears today.

Tuesday, 14th of November, E.U Flash GDP – the numbers from the European Union are exected to be negative. However, last week’s slightly better than expected Germany Factory Orders may help the European Gross Domestic Product results limit the capability of a surprisingly bad decline. An expectation of only minus -0.1% is awaited.

Tuesday, 14th of November, U.S Consumer Price Index – the inflation numbers from the States will get the attention of most global investors. The results are sure to affect the USD, Treasury yields and equity markets. A weaker than expected outcome could propel the USD lower. Stronger than estimated statistics could ignite buying of the USD based on the notion the Fed will feel compelled to remain aggressive via its monetary policy rhetoric.

Wednesday, 15th of November, China Industrial Production – while the APEC Summit is highlighted by the media, it is economic data from China which remains important. Data from the nation continues to be lackluster and demand for commodities, the USD/CNY, domestic real estate and conusmer spending are all being watched and questioned by financial analysts. A gain of 4.5% is expected.

GBP/USD Three Month Chart as of 13th of November 2023

Wednesday, 15th of November, U.K CPI, the inflation numbers from Britain will be important and will follow Tuesday’s Average Earnings Index publication. The GBP/USD has found choppy terrain and the results of the combined numbers from the U.K will affect Forex, even if USD centric considerations remain key.

Wednesday, 15th of November, U.S Producers Price Index, Retail Sales, and the Empire State Manufacturing Index – these reports will be issued at roughly the same time and will factor into sentiment created from the U.S CPI data seen the day before. The combination of all these outcomes will play into the broad markets, and the USD within all major currency pairs. Weaker than anticipated numbers would be welcome by USD sellers. However, until the reports are published wagering on the USD will prove volatile and risk management is encouraged.

Thursday, 16th of November, U.S Federal Reserve Officials – at least 4 U.S Federal Reserve members will be speaking at various conferences. They are sure to give their opinions on the Federal Funds Rate outlook and will be asked to comment on the week’s data already published in the U.S regarding inflation and consumer spending.

Friday, 17th of November, U.K Retail Sales – a gain of 0.3% is expected compared to last month’s negative results. Speculators will react to the consumer driven data and the GBP/USD will again come under the influence of risk sentiment regarding outlook. However, traders need to understand these numbers are largely a result of looking backwards and not forwards regarding outcomes.

Friday, 17th of November, U.S Housing Starts and Building Permits – the American housing industry is being closely monitored and the high costs of mortgages is affecting the U.S marketplace. The Building Permits number is expected to be slightly lower than last month’s outcome. Traders should also keep their eyes on the potential of revisions to suddenly emerge from previous reports.