Is India Still 'The Country of the Future'?
In 1991, when India’s foreign exchange reserves had dwindled to barely three weeks of import cover, the government pledged its gold to the Bank of England. It was a moment of humiliation and, paradoxically, of liberation as the crisis forced an opening that three decades of socialist planning had resisted. Fast forward into 2025: India is a $4.1 trillion USD economy, the world’s most populous nation, with a moon rover, a thriving startup ecosystem, and a digital payments infrastructure the developed world now studies with envy.
This article asks if India is still ‘the country of the future’ using the same growth determinants framework applied by Professor Manoel Bittencourt to Brazil, and argues that the answer lies not primarily in corruption (though it matters), not in policy failure (though that matters too), but in two structural features that resist easy reform: the vast informality of the Indian economy, and the depth of its inequality.
Does Growth Matter? The 70/g Rule Applied to India
Before diagnosing India’s problems, we must appreciate what it has already achieved. Using the 70/g rule which tells us how many years it takes for income per capita to double at a given growth rate – India’s average GDP growth of roughly 6.5% since 1991 implies a doubling of income every 11 years. That is extraordinary by historical standards.
But averages mask distributions. If growth accrues predominantly to the formal sector – the top 10% of earners who hold formal employment, own financial assets, and participate in the organized economy, then the 70/g rule tells a story of elite enrichment, not a broad based development. This is India’s core dilemma.
The Eight Growth Determinants: India in the Data
Bittencourt’s framework identifies eight standard growth determinants: savings, fertility, rule of law, government consumption, trade openness, education and health investment, inflation, and finance. Let us examine some of each through Indian data, with Brazil as our comparator.
Savings & Investment
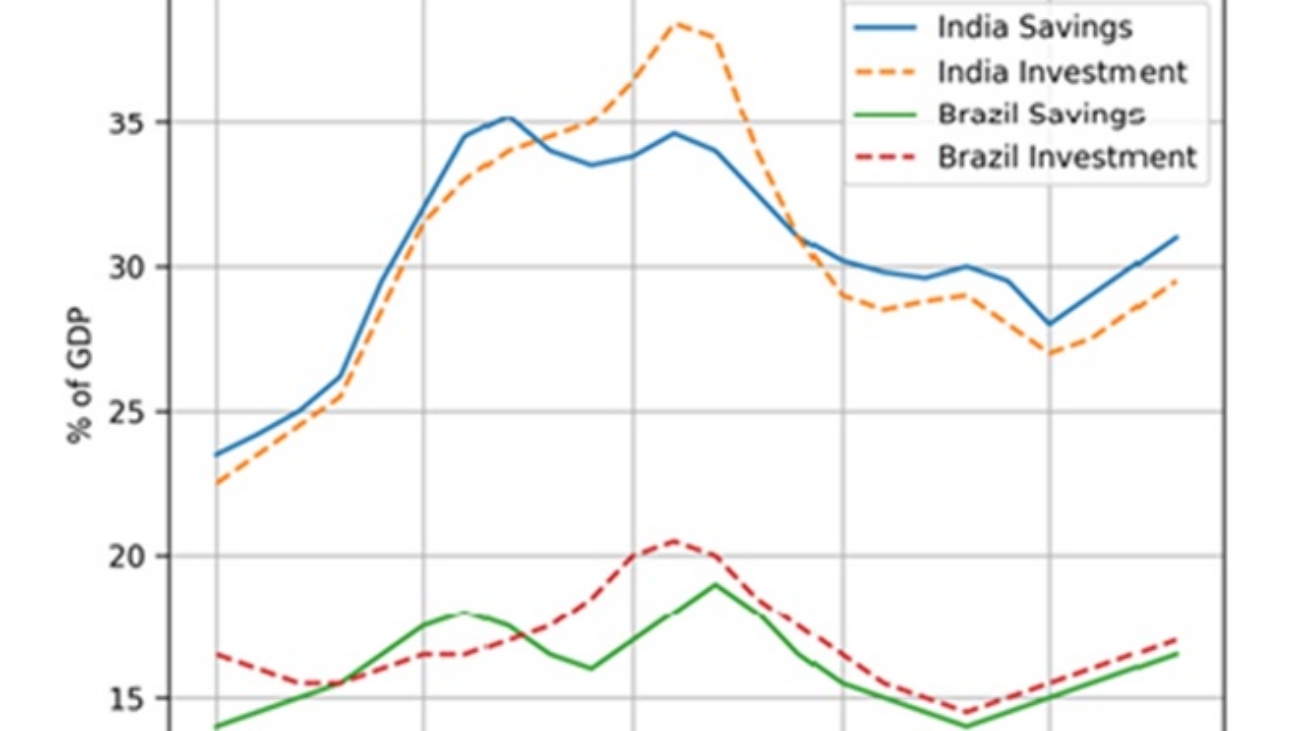
India’s gross savings rate has historically been a strength hovering around 30–32% of GDP through the 2000s and 2010s. But the investment picture is more troubled. Fixed capital formation has declined since its peak around 2011–12, driven by a stressed banking sector, weak private investment appetite, and an infrastructure gap. Brazil shows a similar pattern of savings-investment divergence but India’s gap has widened more sharply in recent years.
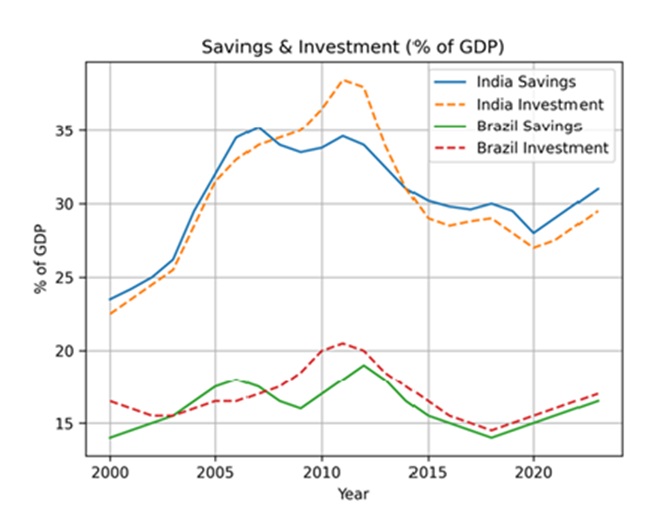
Gross Domestic Savings and Fixed Capital Formation. India vs Brazil. 2000-2023
Education & Health Spending
Perhaps nowhere is India’s “policy-delivery gap” more apparent than in social spending. India spends approximately 4.5% of GDP on education and just over 3% on health, and both figures are well below what comparable middle income countries invest. Brazil, despite its own fiscal struggles, consistently outspends India on health as a share of GDP. The consequences are visible in learning outcomes: the Annual Status of Education Report (ASER) consistently finds that a significant share of Indian schoolchildren cannot read a simple paragraph or perform basic arithmetic.
This matters enormously for growth. An economy hoping to absorb millions of workers into formal, productive employment each year needs those workers to arrive with usable skills. When they do not, informal low productivity employment becomes the default and cycles of informality perpetuate.
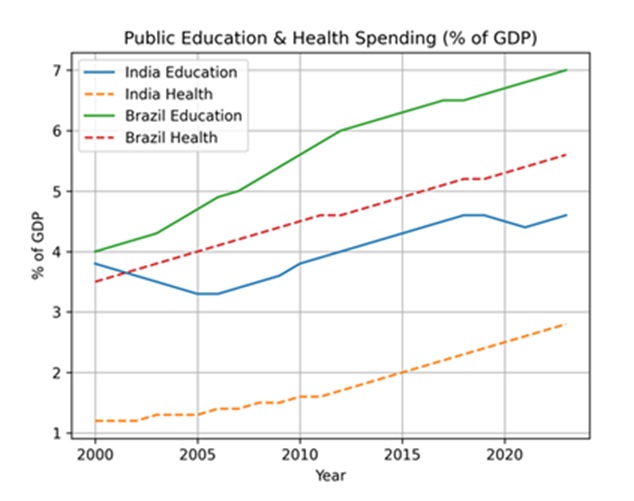
Government Spending on Human Capital. India vs Brazil. 2000-2023
The Thesis: Informality as Structural Trap
Bittencourt identified corruption as the growth killer in Brazil. For India, the more precise diagnosis is informality and the inequality it both reflects and reinforces.
Consider the arithmetic: approximately 80% of India’s workforce is informally employed who are working without contracts, without social protection, without access to formal credit, and largely invisible to the tax system. This informal mass produces perhaps 50% of GDP. The productivity gap between the formal and informal sectors is staggering, and it does not shrink naturally with overall growth.
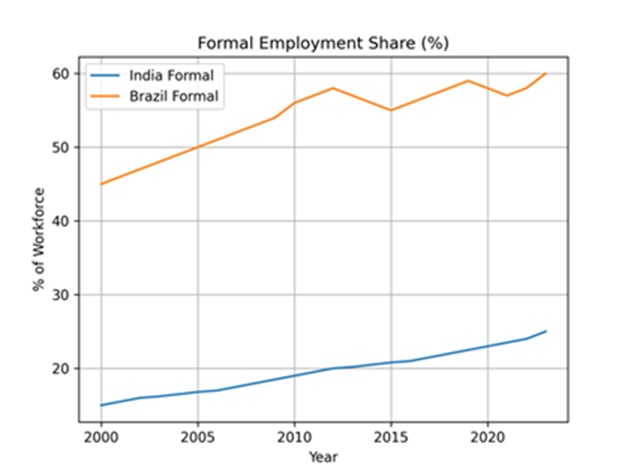
Share of Workforce in Formal Employment. India vs Brazil. 2000-2023
Brazil is itself a country with significant informality, but its formal sector share has grown meaningfully since the early 2000s, driven by the expansion of the Bolsa Família program, minimum wage policies, and labor formalization drives. India, by contrast, saw its already small formal sector shrink as a share of total employment after demonetization in 2016 and the disruptions of COVID-19. The gap between the two countries on this metric is instructive.
Inequality: When Growth Passes People By
India’s Gini coefficient – a standard measure of income inequality – has risen over the reform era even as aggregate poverty has fallen. It shows the signature of unequal growth. The bottom quartile has seen real income gains, but the top decile has captured a disproportionate share of the growth dividend. Recent estimates suggest that India’s top 1% now hold a larger share of national income than at any point since Independence.
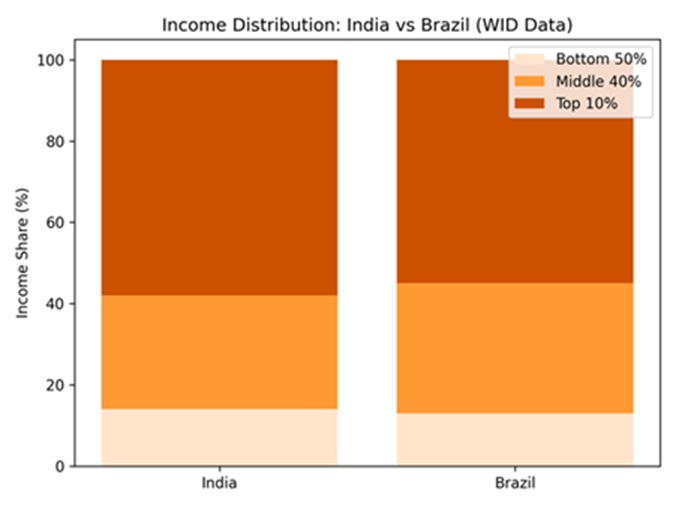
Income Distribution India vs. Brazil.
Compare this to Brazil, which, despite its own severe inequality, pursued deliberate redistributive policies through the 2000s with Bolsa Família reaching 14 million families at its peak and a concerted minimum wage policy. India’s equivalents – the MNREGA rural employment guarantee, PM-Kisan farm payments are larger in coverage but smaller in benefit size at this stage, and reach informal workers imperfectly.
The Structural Complications
A purely data driven analysis, as Bittencourt himself acknowledged for Brazil, understates the depth of the challenge. India’s informality is not simply a policy failure, it is rooted in structures that predate modern economics.
The caste system, legally prohibited but still socially persistent, has historically sorted populations into occupational roles and those at the bottom of the hierarchy were systematically excluded from property ownership, formal education, and credit. Colonial de-industrialization destroyed the artisan economy that might otherwise have been a pathway to formal employment. The fragmentation of the federal system with 28 states running effectively different labor markets, land acquisition regimes, and social programs means that a policy that works in Tamil Nadu may fail in Uttar Pradesh.
These are not excuses. They are explanatory variables that any honest growth analysis must include.
What Does Growth Theory Tell Us to Do?
The prescription is not mysterious. If informality is the barrier, then the priority is to make formal employment more accessible through labor law simplification, portable social insurance that follows the worker rather than the employer, and a genuine skill based learning infrastructure that reaches the rural poor.
If inequality is the barrier, then the priority is redistribution that enhances human capital at the bottom – not cash transfers alone, but the quality of the school your child attends and the clinic your mother can access. India has the architecture of such systems; it does not yet have substantive results.
The demonstrators on India’s streets – whether farmers in 2020-21, or youth protesting paper leaks, or contract workers demanding permanence – know this intuitively. They are not asking for charity. They are asking to be absorbed into the formal economy that has prospered around them.
Conclusion: Is India Still the ‘Country of the Future’?
The answer to the question is Yes, and it is both an achievement and an indictment. India has built a moon program and yet cannot reliably staff a primary school. It has produced the world’s most used digital payments system and left 200 million people without bank accounts until recently. It exports software engineers to Silicon Valley, while its domestic labor market cannot absorb graduates at scale.
Brazil, our comparison, has struggled with its own version of this duality longer. But Brazil’s welfare state, however fiscally stressed has created a floor. India’s floor is thinner, and the drop beneath it steeper.
Informality is not the destiny for any developing economy. South Korea was deeply informal in the 1960s, China was an overwhelmingly rural agrarian nation in 1980. Both made transitions through deliberate, state led investment in human capital and formal employment creation. The path is known. The question for India in 2026 is whether the political will exists to progress via focused programs, or whether fifty years from now someone else will write another article illuminating the same structural problems.
Article Notes:
Data sources include the World Bank World Development Indicators, ILO Labour Statistics, Transparency International Corruption Perceptions Index, ASER Centre (India), UNESCO Institute for Statistics, and IMF World Economic Outlook. Growth determinant categories follow Barro (2008) as synthesized by Bittencourt.