post37.1

Nervous Contradictory Trading Winds for Behavioral Sentiment

Nervous Contradictory Trading Winds for Behavioral Sentiment

Behavioral sentiment in the broad financial markets is nervous, and mixed results in the major asset classes are likely causing retail traders to feel uneasy. Most day traders try to perceive which direction they should lean based on price momentum while looking for fast profits. The current state of the broad markets are making decisions difficult for retail traders.

A healthy dose of nervousness at this moment might be a good thing for speculators and keep them conservative. Swirling results in Forex and commodities are causing plenty of problems for traders who instinctively like to pursue buying positions because of the human tendency to be optimistic.

Federal Reserve Causing Headaches for Smaller Banks and Forex

Forex markets have been choppy since the beginning of February 2023, when the U.S Federal Reserve surprised many people with continued aggressive rhetoric. The U.S central bank has backed up its ‘tough’ talk as it ‘fights’ inflation with more interest rate hikes. Clarity regarding a potential June hike from the Fed remains problematic with no certain answer yet. For the moment there seems to be a belief there will be a genuine pause, which may be fueling better returns for U.S equity indices, but there are no guarantees. Behavioral sentiment remains fragile.

The detrimental effect from higher interest rates on mid and small size banks in the U.S remains harmful. Mid and smaller corporate banks continue to struggle with the increased Federal Funds Rate. Bad business decisions within these banks have made it difficult to make profits in an environment when money is no longer ‘free’, this as many of their depositors look for better returns.

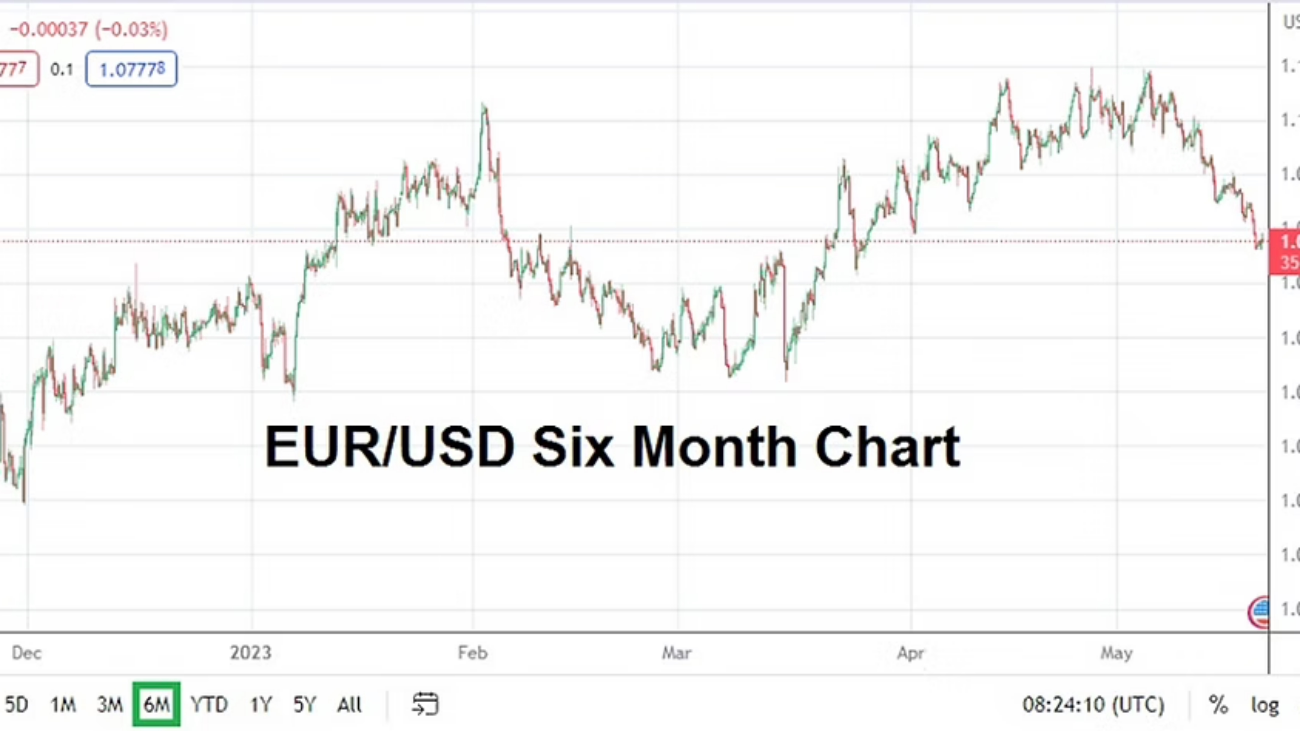
A six month chart of the EUR/USD below shows how the EUR started to climb in the fall of 2022, but then began to run into headwinds when financial institutions started to reconsider the seriousness of U.S Federal Reserve policy earlier this year. Analysis regarding the timing of the Federal Funds Rate forecast to actually start becoming dovish has proven problematic.

While the EUR/USD still maintains plenty of its gains, the current price of the the currency pair is below early February highs. The EUR/USD was trading near 0.95700 in late September of 2022, and the price as of today near 1.07800 is a vast improvement for the EUR. However, the choppiness of the Forex market the past few months has not been easy for day traders who have suffered from sudden reversals frequently in many of the major currency pairs.

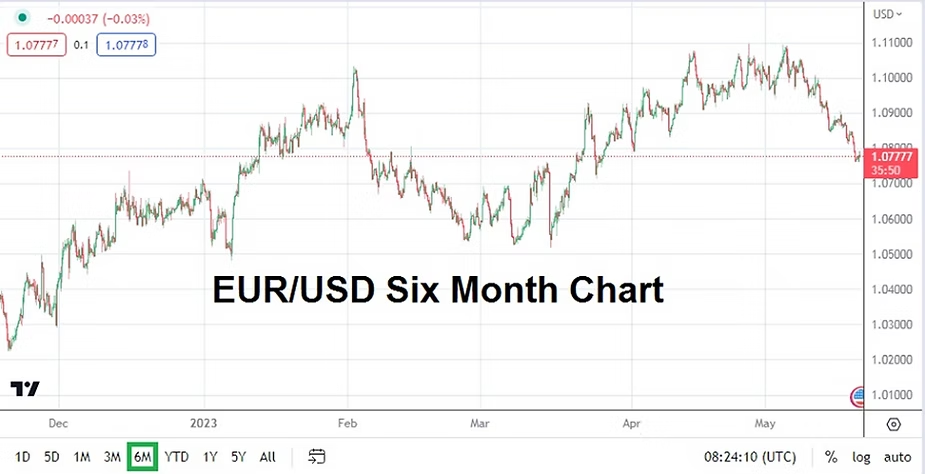
EUR/USD Six Month Chart as of 19th May 2023

The KRE regional bank index below shows the dramatic drop in value of the mid and small size banks in the U.S the past year, and the sector certainly still has financial concerns and shadows which are causing pressure on their corporate share values. Stubborn inflation remains and the desire of the U.S Federal Reserve to attack rising costs with higher interest rates remains a serious concern.

KRE Regional Banking Index One Year Chart as of 19th May 2023

Stock Markets Suddenly at One Year Highs as Investors Seem to Return

Is the S&P 500 a harbinger of things to come or are investors in the index being too optimistic? Day traders likely stay away from the S&P 500 many times because they are mostly trading the index via CFD’s and this can prove expensive regarding transactions, they are not long-term investors – meaning they do not like to make bets that take awhile to materialize. The results from the past year and a half in the stock markets have made speculators nervous regarding bets on equities.

However, institutions and long-term investors buy and hold the S&P with a vision towards the future; they also reap the rewards of its dividends. The ability of the S&P to be trading at nearly one year highs is curious. The improvement in equity values in the indices may be a sign that ‘smart money’ continues to invest in the stock market for the long-term, even during what is perceived as a fragile period of behavioral sentiment. Financial institutions may also be betting on the U.S Federal Reserve having to become more dovish regarding interest rate policy in June and looking forward.

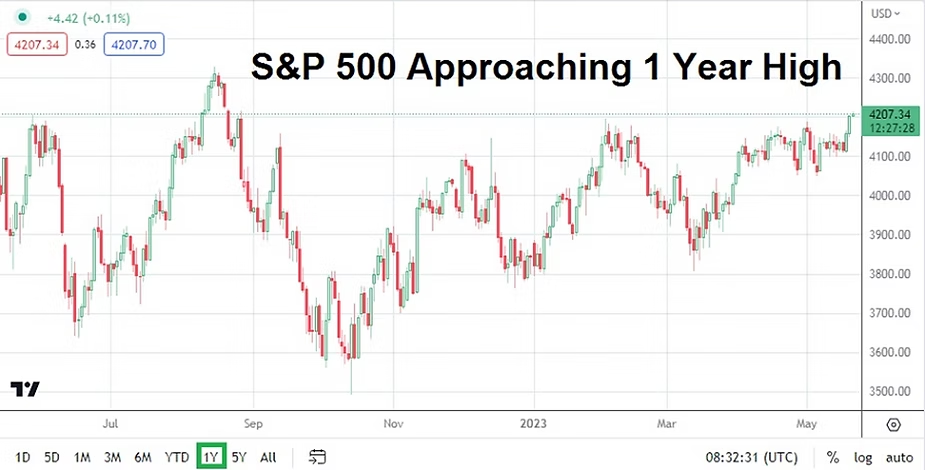
S&P 500 Index One Year Chart as of 19th May 2023

Results on the NASDAQ 100 may be surprising to many and the index is trading at one year highs, and though like the S&P it is still under all-time highs from late 2021 and early 2022, investors have shown a taste for investing in the ‘hi-tech’ index again. While this may contradict the behavioral sentiment of Forex and the results in the mid and small size banking sector, the NASDAQ 100 does point out money is still being invested and might be an indication that day traders need to be more patient, more optimistic about the coming months and year.

While a recession might be looming, large companies have started to lay off workers and scale back on bonuses in an effort to fight against reduced profits. The narrative from the media may be negative in many cases, but many long-term investors tend to look at more conservative fiscal policy in companies as a good practice and a sign they should invest.

Perhaps the market is going through a needed case of the jitters and the U.S indices are showing that brighter days are ahead, even if there are storm clouds that still must be dealt with regarding inflation and possible recession.The long-term horizon tends to always be more optimistic. Day traders may not be able to take advantage of quick hitting trades, but what about changing perspective and looking for more patient results by being more conservative as a speculator? Or maybe investors in the stock market are wrong and another violent selling surge will return into equities, but what if it doesn’t.

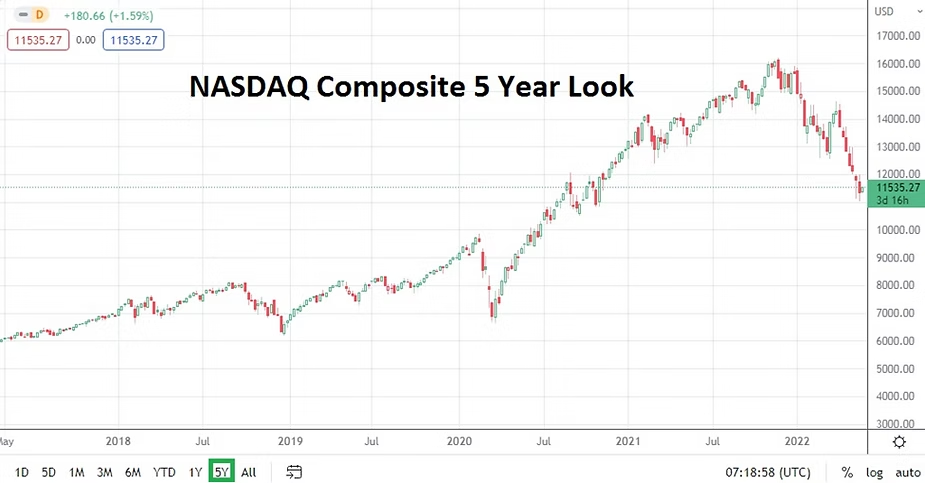
NASDAQ 100 Index Five Year Chart as of 19th May 2023

There is a fear among mid-size brokers that trading volumes in many sectors are dropping. Showing cautious investor sentiment on the retail front – which may be a healthy reaction in many respects because it is hard to read momentum right now. Day traders tend to get killed by the daily gyrations of Forex and equities in choppy markets because they are using too much leverage. However, historically when retail traders have turned cautious, this is when institutional trading houses have tended to do remarkably well. Investment houses can take on more risks in markets that are perceived as nervous and fragile, because they have a longer time horizon and more cash to absorb momentary losses.

Commodity prices are also intriguing because after hitting highs nearly one year ago in May and June of 2022, the ratios of many broad commodity indices have come down and values are traversing near late 2021 levels. Which brings us to the consideration that global demand for physical resources are limited because corporations are not making large purchases of commodities, this as they wait on better manufacturing demand for their products. This may appear contradictory and create nervous behavioral sentiment for traders, but cautious business practices are a way to make sure there is enough money for the future when conditions turn optimistic again.

post35.1

Sudden Bullish Momentum of Indian Rupee Raises Questions

Sudden Bullish Momentum of Indian Rupee Raises Questions

The past week of trading within the USD/INR has seen a bullish trend emerge, this while many speculators were likely starting to believe lower price realms and targets were possible.

The USD/INR is trading near the 82.2200 mark as of this writing, which is within the higher elements of its one month price range. Volatility within the USD/INR has been abundant the past week and has likely proven expensive for speculators who were pursuing the currency pair with visions of more bearish price action to target. Early May values of the USD/INR certainly tested lows and likely fueled the appeal of selling positions. However, the early May lows within the Forex pair tested the 81.6260 mark, while never actually hitting April’s lowest values which tested the 81.5500 ratio on a couple of occasions.

USD/INR One Month Chart as of 16th May 2023

One of the dangers of trading is always the potential for a sudden change in behavioral sentiment. The lows in the USD/INR seen on the 8th of May, which is only a little bit more than a week ago, highlights the price velocity the currency pair has demonstrated. While many speculators are trying to understand why the sudden shift in dynamics has taken place, it is important to remember the USD/INR was actually trading above its current values in February, March and early April of this year.

USD/INR Five Day Chart as of 16th of May 2023

The Difference between Day Traders and Financial Institutions

The outlook of speculators within the USD/INR is totally different than financial institutions. This is because most speculators are short and near-term traders. They do not have deep pockets like financial institutions – which can hold the USD/INR in a chosen direction for a long period of time and simply allow the currency pair to trade until they want to cash out of a position. Day traders are also using leverage a lot of the time, and the combination of leverage with limited available trading funds makes the daily gyrations of trading volatile and frequently dangerous.

Short-term traders look at the USD/INR with a technical viewpoint much of the time, financial institutions are likely maneuvering in the Forex pair with fundamental perspectives and inside knowledge based on known transactions they have to accomplish.

Many financial houses believe the U.S Federal Reserve will have to become less aggressive regarding its hawkish interest rate stance it has maintained the past year and a half. However there is enough nervousness within the broad Forex markets to make things very difficult for day traders, this as the potential for risk adverse trading based on economic data results move currency pairs including the USD/INR constantly, particularly if a financial institution needs to react quickly.

The ability of the USD/INR to move downward and hit support depths at the beginning of last week, may indeed be a sign that financial institutions have a belief the currency pair should be lower. However, the recent strength of the USD the past handful of days may have been brought on by the simple notion that financial houses grew momentarily nervous. There is also the possibility that large corporations made transactions in the USD/INR that moved the price higher. Day traders must understand there are forces within the USD/INR that are much stronger than their opinions. The USD/INR is not a widely traded currency pair in the open markets, it is difficult for instance to trade the currency pair in a speculative manner within India and traders in the nation face restrictions, which forces many Indian speculators who want to wager on the USD/INR to seek foreign brokers abroad.

Data and Rumors Can Sometimes be False Flags for USD/INR Traders

Some analysts have claimed the recent move higher in the USD/INR has taken place because of factors like a fear of the U.S debt ceiling not being raised in time and causing chaos in the financial markets, however this if true is likely only a short-term worry. It is very unlikely the U.S government is ‘idiotic’ enough to allow the U.S debt ceiling to not be taken care of within Congress. It would be very problematic for the U.S Federal Reserve and Treasury to have to explain why U.S bonds are suddenly difficult to repay. In other words, the U.S debt ceiling is likely to be taken care of and many financial institutions with a long-term view know this, although it is a possibility they could ‘punish’ the financial markets and act in a risk adverse manner in the short-term.

Data from the U.S yesterday highlighted another important aspect again regarding behavioral sentiment. The U.S Empire State Manufacturing Index reading came in with a negative number of minus -31.8. The expected result was -3.7, the report shows that New York business activity and outlook is worse than forecasted. This doesn’t mean the entire U.S manufacturing sector will have the same results, but it underscores the potential for a U.S recession to possibly occur. Today the U.S will release Retail Sales numbers. If these numbers come in with a negative result this could spur on bearish sentiment within the USD/INR in the near-term, particularly if financial institutions feel the results are more evidence the U.S Federal Reserve will have to pause interest rate hikes in June. USD/INR day traders should be ready for more choppiness. But there is reason to suspect resistance above in the currency pair may start to prove durable from a speculative point of view considering the trading results the past month in the USD/INR.

Traders wishing to pursue the USD/INR need to use solid risk management. Entry price orders will help traders get a ‘fill’ they are expecting and the use of stop loss and take profit tactics are highly encouraged. The past week of trading in the USD/INR has likely tested the nerves of many speculators and the assault on highs is alarming, but downside price action may be ready to reignite if U.S economic data continues to falter in the near-term.

post31

Economic Data that needs Attention this Week

Economic Data that needs Attention this Week

Tuesday 8th of May, U.S FOMC Member Speaks – N.Y Federal Reserve President John Williams will talk at the New York Economic Club. N.Y Fed is important regarding monetary policy particularly for financial institutions. Williams words should be given merit. Williams will also be likely listened to for any comments regarding U.S corporate banking health regarding mid-size and smaller institutions.

Wednesday 9th of May, U.S Consumer Price Index reports – three key inflation consumer price statistics will be published including monthly, annual and core monthly changes. The results will be important taking into consideration the manner the U.S Federal Reserve conducted its ‘sitting on the fence’ rhetoric last week, as if looking for an accuse to continue to raise interest rates if inflation remains stubborn or worse continues to climb.

Thursday 10th of May, U.K BoE Monetary Policy Summary and Official Bank Rate – which is expected to produce another increase of 0.25%.

GBP/USD One Month Chart as of 7th of May 2023

Friday 11th of May, U.K Gross Domestic Product – growth numbers from the U.K are expected to demonstrate economic conditions remain challenging.

Friday 11th of May, U.S Preliminary University of Michigan Consumer Sentiment – a rise in consumer sentiment from this report could add to the confusion and ‘concern’ that financial institutions have regarding the U.S Federal Reserve’s short term monetary policy regarding the prospects for a June increase to the Federal Funds Rate. If the number is weaker than expected this could help ‘pause’ outlooks.