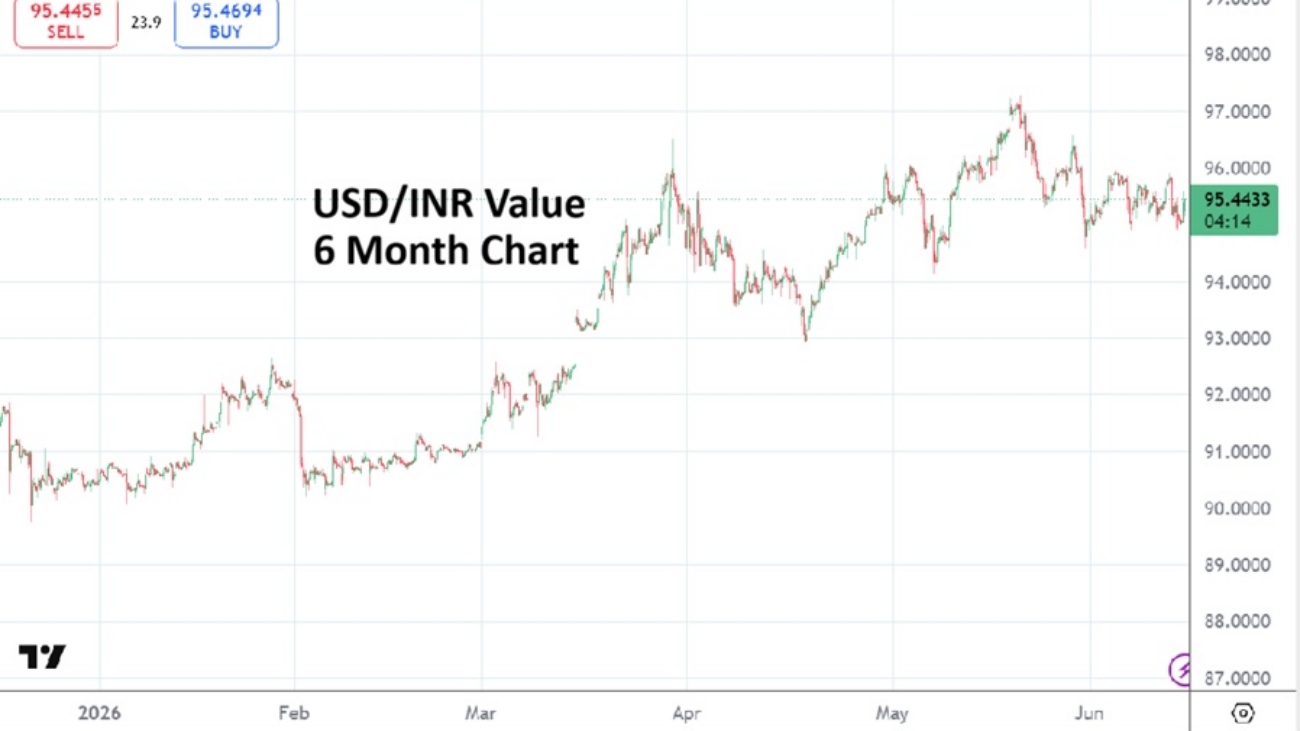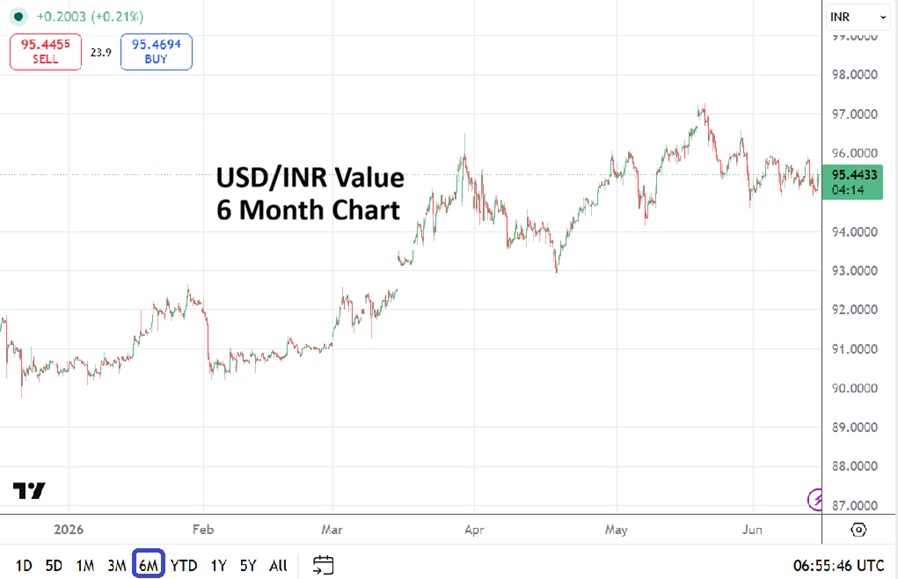
Change of Policy Could Create a Stronger INR
RBI Governor Sanjay Malhotra says, Rupee depreciation doesn’t reflect weaknesses in the underlying economy. He says that the external factors due to geopolitical tensions induced by oil prices rising has created a Dollar demand and created Rupee weakness.
While it’s true the Rupee has depreciated because of foreign capital fleeing and oil importers’ persistent demand for USD when buying oil and gas, this doesn’t answer the entire issue regarding INR vulnerability.
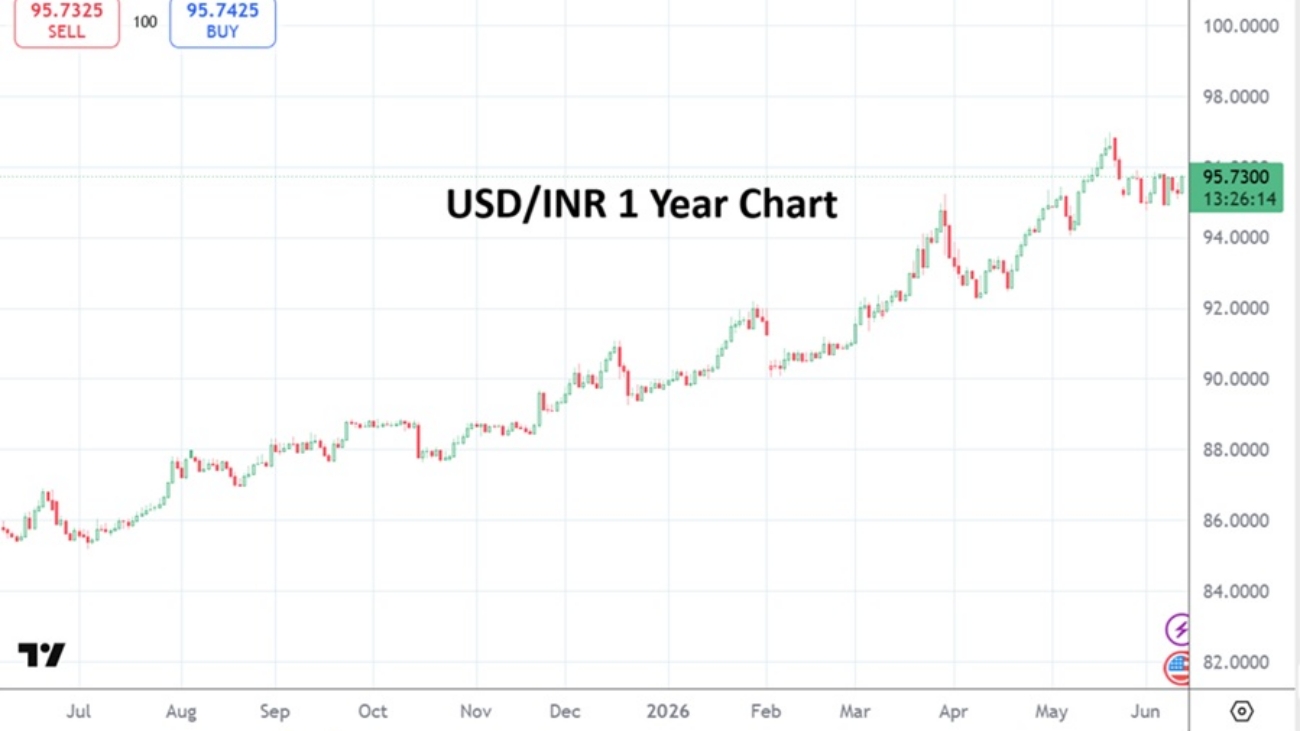
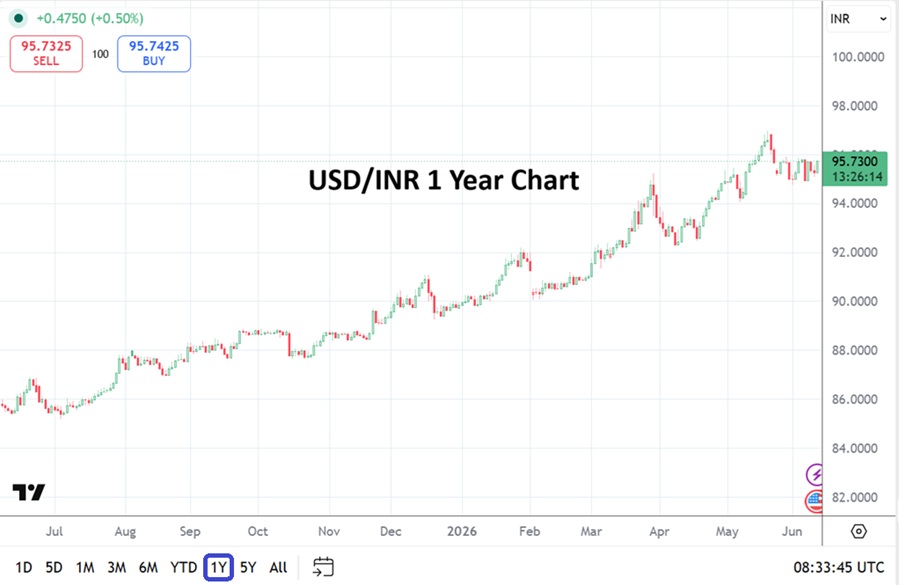
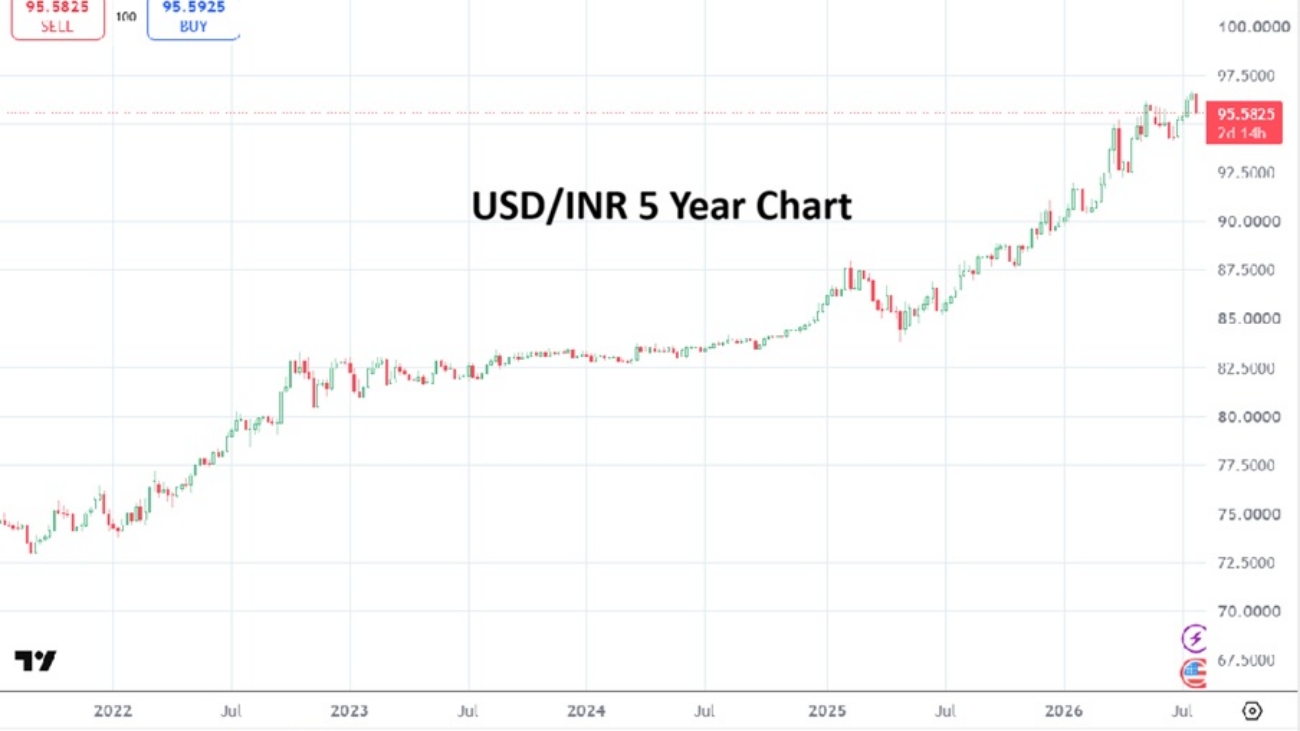
Questions surrounding the Rupee’s weakness should also focus on fundamental causes for depreciation. For instance, the Rupee has largely depreciated the past 5 years from 2021 – from 74.50 per Dollar – and into 2026, where its trading around 95.72 per the USD/INR now. Why?
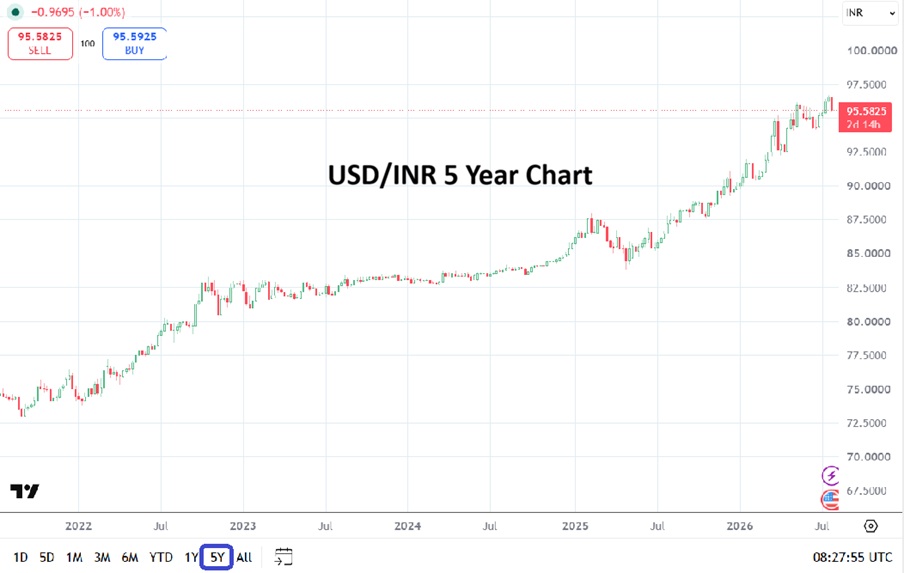
USD/INR Five Year Chart as of 29 July 2026
Nominal depreciation has been 28%, and this is despite service exports growing healthier, and remittances flows that have been good in the last few years. Can the RBI governor say anything related to it?
Why Does the Rupee Remain Weak?
Economists point to the widening gap between India’s foreign inflows and outflows as a structural flaw that’s weighed on the Rupee and growth. A reason for this is India’s struggle to attract long-term capital through Foreign Direct Investment. Net FDI has declined from $28 billion in 2022-23 year to just $7.7 billion in the financial year that ended in March.
Foreign multinationals, venture capitalists and private equity titans have been taking advantage of high valuations to cash out. Despite recent pro-business reforms by Narendra Modi’s government, India’s shabby infrastructure and a bureaucracy that reduces Byzantium schemes to shame, puts off new arrivals. This is also a reason why tradable exports are not growing compared to India’s vast import needs. India’s exchange rate remains relatively overvalued, even though in purchasing power parity (PPP) terms, Indian products are inexpensive compared with those of the United States.
India could have allowed the Rupee to reflect it’s underlying market fundamentals in order to make it’s exports more competitive and restore external balance. Given the high supply of skilled India’s labor force and opportunities in small and medium scale businesses, especially in agricultural value added products where India holds competitive advantages, it’s not impossible to improve tradable export volumes. Instead, the Reserve Bank of India went in the opposite direction by managing the Rupee at 83/USD and made it overvalued, especially when Shaktikanda Das was the Governor of RBI.
If the RBI truly believes in India’s economic fundamentals story, then why did it intervene aggressively during the 2023-2024 period? Critics argued these known interventions may also have had the effect of supporting India’s GDP when measured in USD, although the RBI maintains that its objective was to reduce excessive volatility and preserve financial stability.
Even with respect to headline GDP growth numbers, many economists in India and around the world still believe that Indian statistical numbers overstate the actual strength of the underlying economy. To generate better growth data in India, the government has expanded it capital expenditures to compensate against relatively weak private investment. However, creating jobs and opportunities for linkages – opportunities in sector related industries, and enhancing India’s trade competitiveness via high value exports are important and urgent, rather than depending on foreign capital flows. In this regard, private capital expenditures still need to increase substantially.
Relying on short term capital flows for managing the current account deficit is a difficult strategy. Even if the RBI believes a de-escalation in the US and Iran War will occur, and believes that global liquidity conditions will allow the RBI to accumulate higher Forex reserves, risks remain skewed negatively to the upside without meaningful changes to improve long-term net Foreign Direct Investment.
David Lubin of Chatham House argues that countries should not rely only on high Forex reserves to protect themselves from volatile capital flows. The best strategy in his view is to reduce the potential problems at its source by discouraging unstable, short term inflows, and ensuring banks do not accumulate excessive foreign currency risks.
However, this is exactly what India is doing by mobilizing leveraged foreign currency deposits from non-resident Indian’s and offering hedging for these inflows until September 2026. Reserve Bank of India Governor Malhotra has stated that the RBI has attracted around $32 billion worth of USD inflows via this route.
Arguably, another side of the equation should be examined. If central banks were to accumulate FX reserves for the sake of paying for their imports, without meaningful reforms in their own economy and not creating conditions for capital to be deposited long-term, no capital controls can ably solve the underlying deficits or surplus nature for those respective economies.
In India capital account surplus has created deficits because the net Foreign Direct Investment has been weak resulting in funding costs for transactions in current accounts to increase. Apparently, this dilemma goes beyond the RBI balance sheet capabilities and exposes flaws in the fundamental reality of economic internal policies. The ensuing crisis hits the Rupee faster as capital leaves and damages the exchange rate.