postR178.1

Tranquility: Forex, Equities and Treasury Yields Drama-Free

Tranquility: Forex, Equities and Treasury Yields Drama-Free

Sometimes no news is welcome. The markets though not devoid of drama, have been relatively tranquil. It is obviously summer in the northern hemisphere which helps bring about quiet, this since many ‘active’ market participants are off vacationing having been allowed to go on holiday. The implosion in the markets on the 5th of August after the dangerous riptides created by the combination of the Federal Reserve and Bank of Japan have certainly eased and evidence of the chaos is fading. Retail traders who are always looking at charts and for opportunities may have even been able to rest too the past week and a half.

USD/JPY Three Month Chart as of 20th August 2024

The USD/JPY as of this moment is near 147.185. The Nikkei 225 has recovered lost ground from over-reactive selling on the 5th of August. The value of the Japanese equity index is within extremely intriguing territory as financial institutions are clearly taking a wait and see approach regarding more BoJ and Fed rhetoric, combined with fundamental analysis of Japan’s economy and their companies in consideration. It is a healthy market dynamic, particularly via a notion the Nikkei 225 having reached an early August equilibrium is a solid result, this if you have a long-term viewpoint.

Nikkei 225 Three Month Chart as of 20th August 2024

The GBP/USD, EUR/USD, USD/SGD have all seen better results for traders who have been wagering on USD centric weakness. Even the USD/ZAR has produced a solid trajectory. U.S Treasuries yields are falling.

Gold Six Month Chart as of 20th August 2024

Yes, day traders definitely have different approaches compared to long-term investors, but if a speculator who is accustomed to quick trades synthesizes an outlook using the behavioral sentiment of long-term institutional players, they might find it helps build some foundations which help perceptions when deciding what to pursue. The use of barometers is always good too, this often gives a trader insights regarding market mood even if it is not an asset class they want to pursue. Gold is within record territory as it hovers around 2,500.00 USD per ounce.

Investors can argue all day and night about interpretations regarding results. The trading within gold the past six months, even since November of 2022 opens doors to a vast amount of complex explanations and narratives. They are too numerous to argue here, but the ability of the precious metal to march higher should continue to be watched. The recent surge higher since the end of June suggests – but it is again, only an explanation after the results have been seen – that gold traders believed the Federal Reserve would have to eventually capitulate and stop behaving hawkish about interest rates.

And this brings us squarely to this weeks events. Yes, the DNC is underway in Chicago and hopefully it provides a rather calm atmosphere free of political chaos via unwanted demonstrators. If investors can focus on the Fed’s FOMC Meeting Minutes report which will be published on Wednesday this would be good.

Because the Fed refused to sound dovish in their last FOMC Statement this created the potential for massive retaliation by institutional traders, and when coupled with the BoJ hike and their rhetoric, market turmoil in Japan and globally promptly ensued for a few days. However, because of recent inflation data again highlighting U.S prices via Producer Price Index are stable and decreasing in some sectors, and CPI has continued to come in below anticipated results, investors again firmly believe the Federal Reserve will definitely cut the Fed Funds Rate by at least 0.25% in September, and may be in a position to cut in November. Thus, the weakness and volatility of the USD which is clear to see via the USD Cash Index results.

USD Cash Index Three Month Chart as of 20th August 2024

Yet and potentially amusing tomorrow, the Fed’s FOMC Meeting Minutes may simply restate the cautious and very passive rhetoric from the last FOMC Statement. This because the Meeting Minutes are a reflection on thoughts shared at the Fed meeting, and we know what that outcome was already. Meaning tomorrow’s publication may scare some investors, but it shouldn’t. Tomorrow’s Fed paper may prove to be a non-event.

This sets the table for the Jackson Hole Symposium in Wyoming which starts on Thursday to produce a myriad of central banker statements led by Jerome Powell and his counterparts from the European Central Bank, Bank of Japan and Bank of England. The event is likely going to be important, but much of the talk which occurs in closed meetings is unlikely going to be made public.

postR196

AMT Top Ten Miscellaneous Fragments for the 24th of May 2024

AMT Top Ten Miscellaneous Fragments for the 24th of May 2024

10. IP vs. AI: OpenAI has agreed to pay News Corp., the mass media company, for the rights to ‘farm’ data and written content from publications like the Wall Street Journal and other notable brands. OpenAI will compensate the media giant around 250 million USD over the next five years. Question, does this legally imply that all Artificial Intelligence companies will eventually have to pay for ‘scraping’ Intellectual Property from all resources they take information?

9. Memorial Day: The U.S will observe its commemoration for fallen soldiers this coming Monday. The long holiday weekend will affect financial markets later today with lighter than normal trading, and volumes will be very thin in Forex and many commodities early next week.

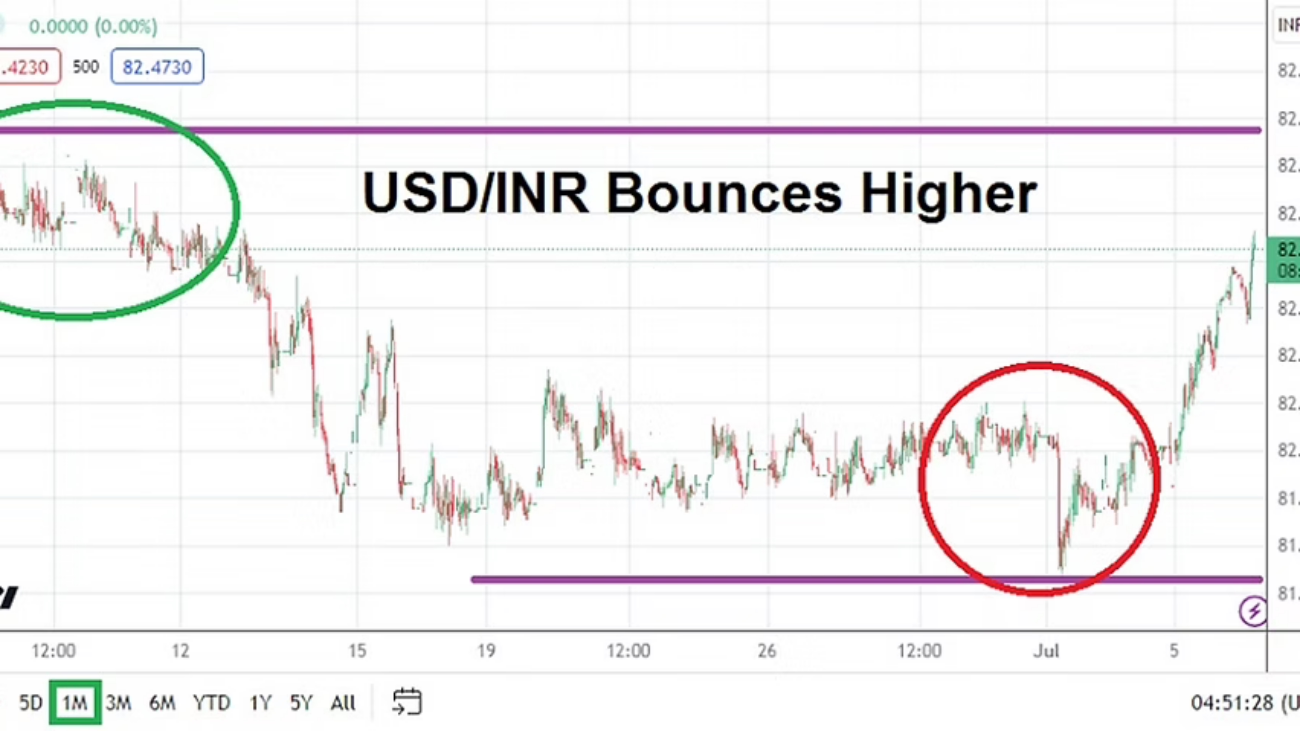
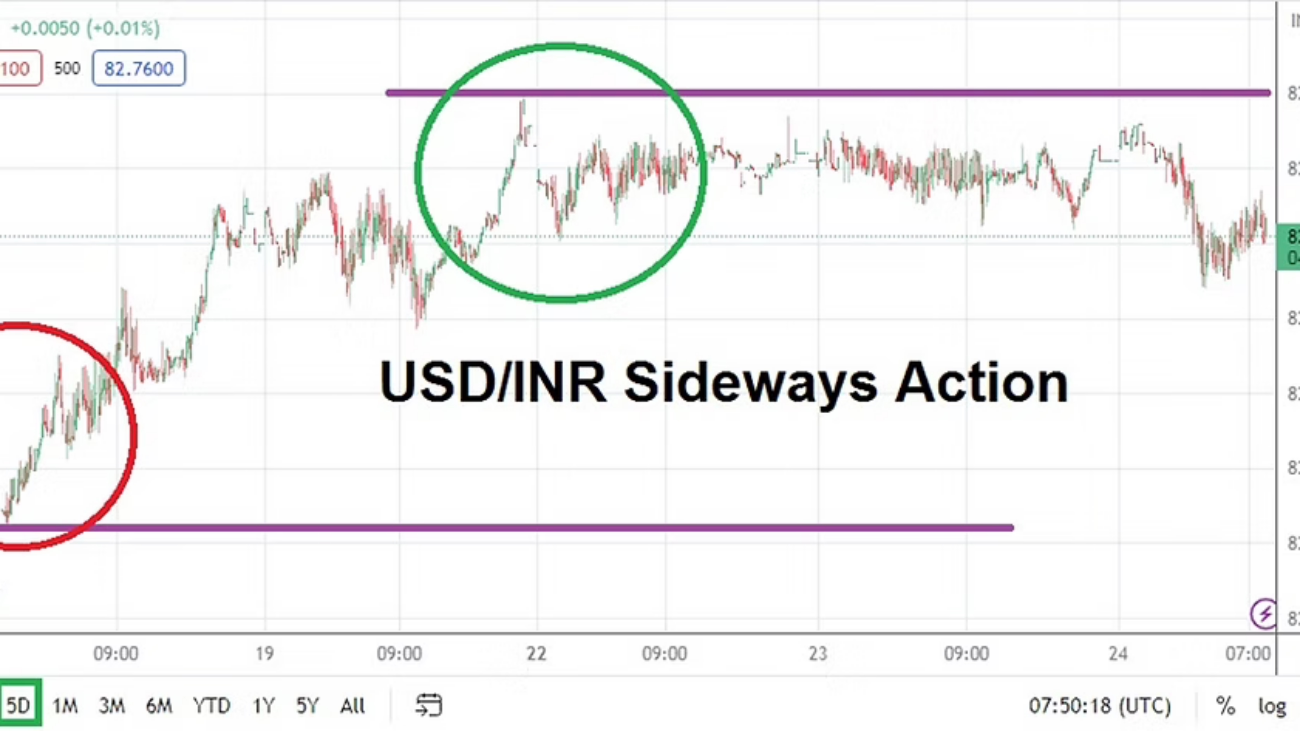
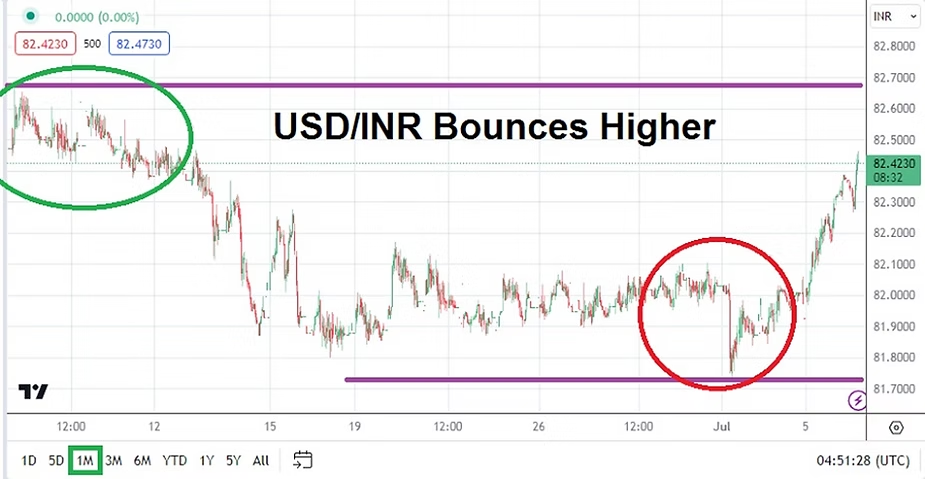
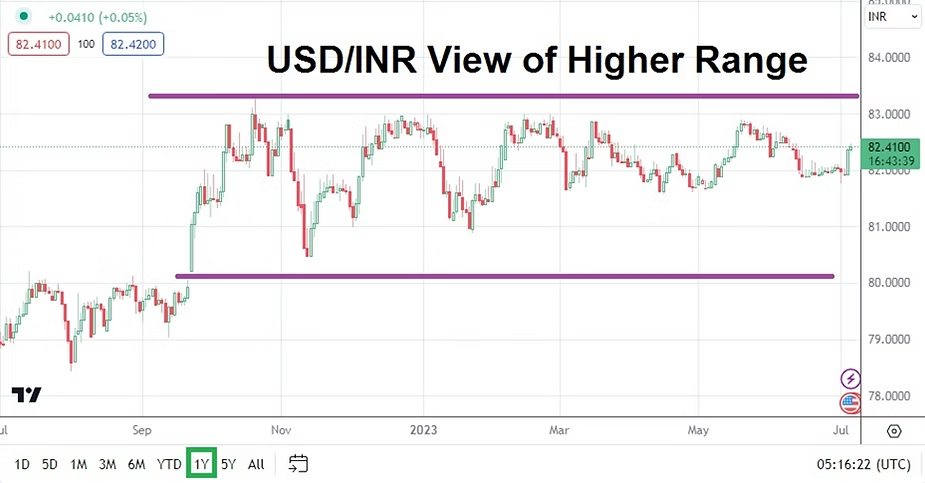
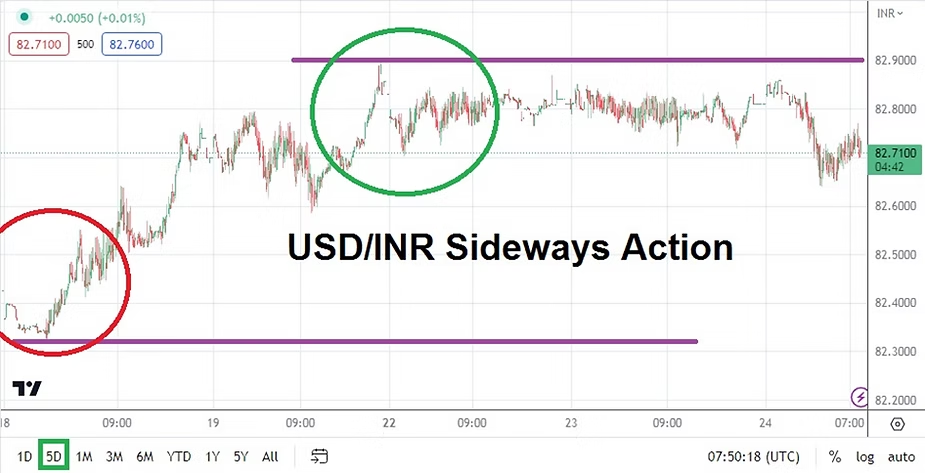
8. India: The 6th phase of India’s national election will be held tomorrow. The 7th and final polling date is the 1st of June. There are murmurs that Prime Minister Narendra Modi’s Bharatiya Janata Party is losing some ground and will not be able to attain a super majority in the Lok Sabha.

7. Moment of Lunacy: The United Nations observed a moment of silence for Iran’s deceased President and Foreign Minister who died earlier this week in a helicopter crash, while failing to mention the majority of citizens in Iran who live unwillingly under the Iranian Islamic Republic’s oppression.

6. 29th of May: The South Africa election will be held next Wednesday. After governing the nation since 1994, the African National Congress appears to have a fight on its hands to sustain power without having to use a coalition. Dangers abound regarding potential political alliances which might have to be formed. The USD/ZAR will certainly endure volatility in the days ahead, and geopolitical influences should be monitored in the weeks to come. Can a tranquil compromise be attained?

5. FOMC Meeting Minutes: Wednesday’s publication of the Federal Reserve’s decision making process rumpled some feathers in financial institutions regarding the central bank’s laser focus on inflation. However, traders should not have been surprised. While the outlook for the Federal Funds Rate has seemingly shifted within financial institutions to hopes of a more dovish policy, equity indices and Forex will continue to amplify a battle between short and mid-term speculative and investment positions that gyrate on power generated from fundamental economic reports and technical perspectives.

4. Gold: The precious metal is near 2,340.00 USD as of this writing, this after attaining an all-time record value around $2,450.00 per ounce this past Monday. Risk appetite is certainly high in the financial markets. Day traders need to understand large speculative forces can move commodities and other assets with lightning speed when big volumes and changes to behavioral sentiment collide.

3. Data and the G7: Today’s Consumer Sentiment and Inflation Expectations readings should be watched from the University of Michigan. Weaker than anticipated results could solidify a bearish trend for the USD. However, traders should also keep in mind the G7 meetings taking place as they monitor global events, they should also remember to eliminate the hyperbole that may come from some politicians today and tomorrow in Italy as pronouncements come from the conference.

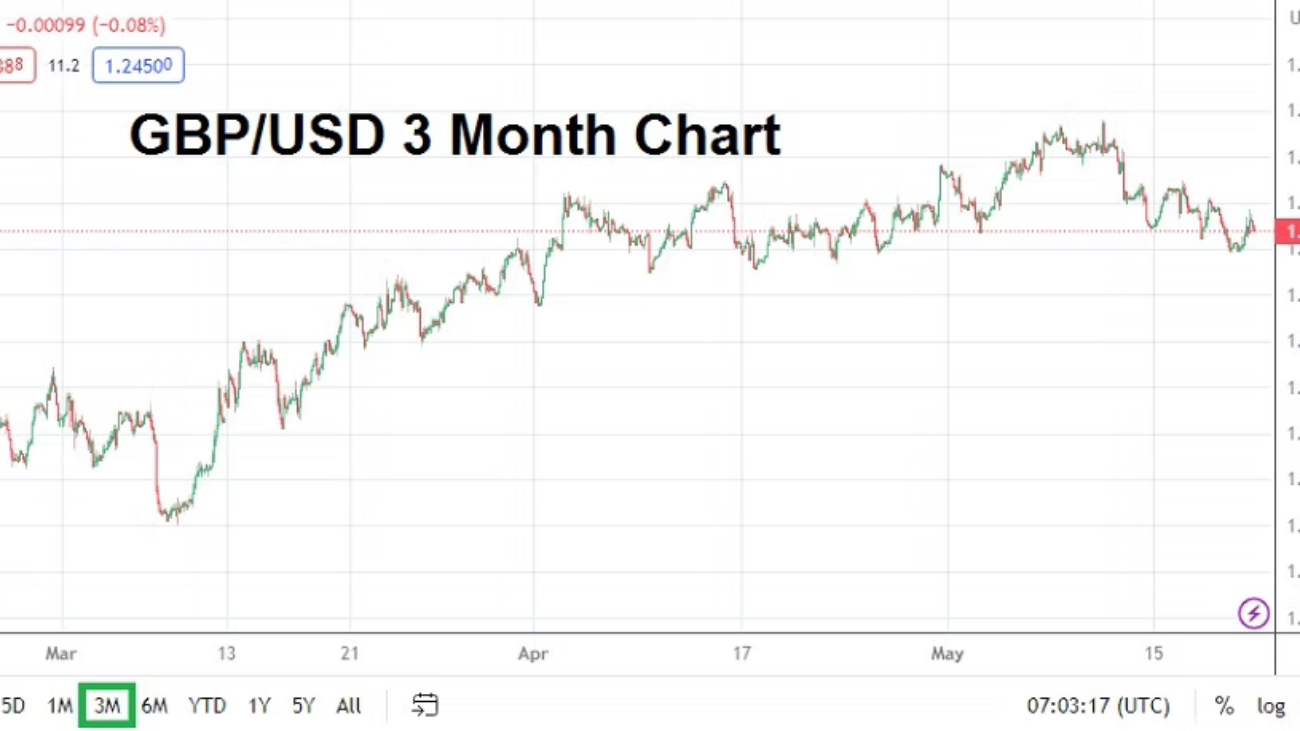
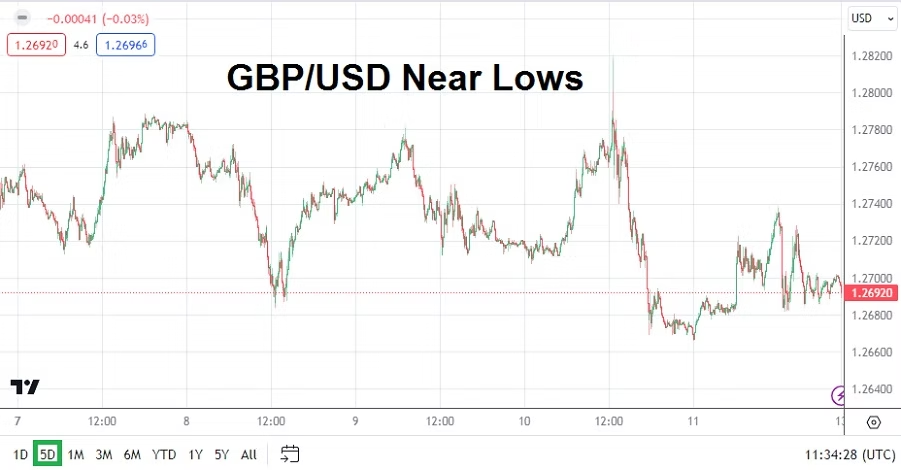
2. U.S Debt Burden: As the U.S election draws closer, investors are likely to hear more about the growing U.S debt which is certainly increasing too rapidly. 34 trillion USD in public debt is owed by the U.S government. It is a monumental number and growing larger on a daily basis. The U.S must start to get its fiscal house in order. The ratio of 124.7% of U.S debt to Gross Domestic Product is eye catching, it is still less than many major countries but still troubling. Japan’s ratio is about 263%. However, the U.K’s ratio is less and standing at 85.4%.

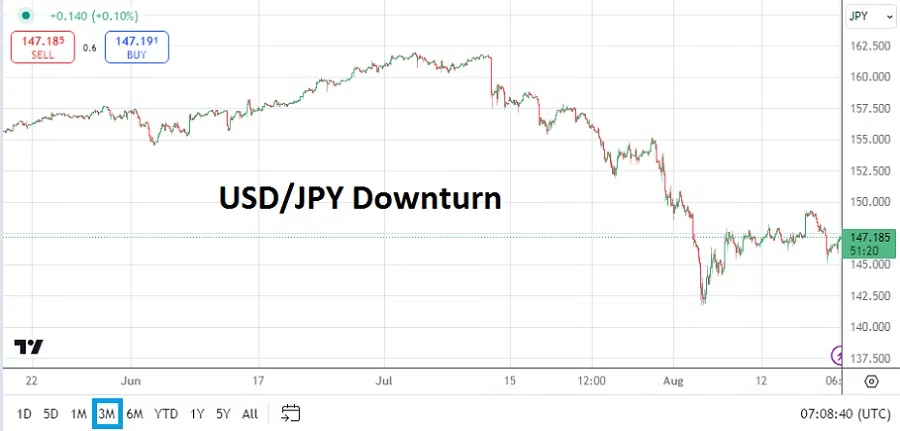
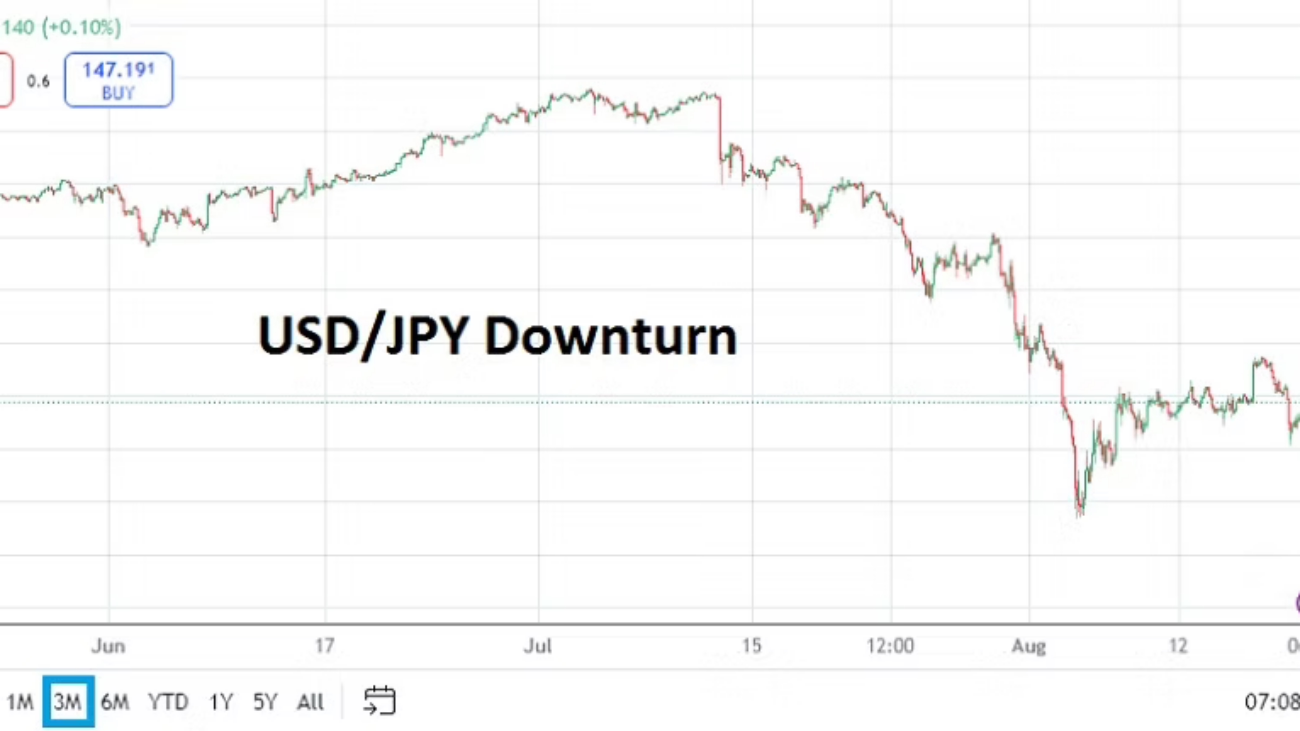
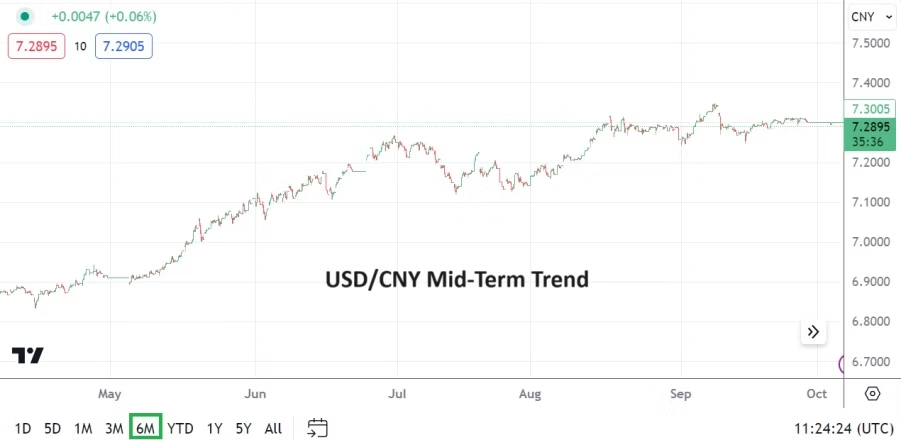
1. Devaluation: USD/JPY as of this writing is hovering near 157.000. There has been talk among financial institutions regarding the belief that China is quietly devaluing the USD/CNY to gain an advantage in export ability. But little mention has been made of Japan’s devaluation of the Japanese Yen to accomplish the same goal. The USD/JPY remains in remarkably high territory and the currency pair needs to be treated carefully by day traders as the Bank of Japan maneuvers policy to accomplish economic goals.

postN51

AMT Top Ten Miscellaneous Rays for the 15th of March 2024

AMT Top Ten Miscellaneous Rays for the 15th of March 2024

10. Argentina: President Javier Milei is practicing fiscal sanity. The health of the Argentine Peso has improved, and monthly inflation data has begun to show signs of erosion.

9. Copper: The commodity has shown a steady increase since the 9th of February and is challenging values last seen in April of 2023. Demand could signal better global economic outlooks emerging.

8. Gold: The precious metal is near 2167.00 USD which appears high momentarily, this as questions about USD near-term direction lurks and Forex remains choppy.

7. Aramco: Profits for the energy producer were an approximately 121 billion USD for 2023, this as Saudi Arabia is propelling the nation’s infrastructure towards an elite future.

6. Bubble Watch: Binance Coin is around 580.00 USD as of this writing. BNB/USD was near 200.00 in the middle of October 2023.

5. Centrists: Will the adults be allowed back into the political arena to govern and brush away populists?

4. Inflation: Consumer prices are causing pain and household arrears are growing. Total U.S credit card debt is estimated over 1 trillion USD by the Reserve Bank of New York.

3. China: New Home Prices are still losing value via data released today. And the Shanghai Composite Index is near 3050.00 which looks suspiciously like a member of the ‘too expensive club’.

2. Data: U.S Producer Price Index stats were sharply higher yesterday, while Retail Sales came in below estimates. University of Michigan Consumer Sentiment readings will be published today. The U.S economic outlook remains murky.

1. Prediction: Fed’s FOMC meeting next week will provide financial institutions cautious ‘vanilla’ remarks about monetary policy from Jerome Powell, meaning market conditions will likely continue to move sideways.

postN62.1

Inflation Data and Fed’s FOMC Meeting Minutes This Week

Inflation Data and Fed's FOMC Meeting Minutes This Week

Last week’s economic data ended with rather tantalizing headline jobs numbers as the U.S showed more hiring than expected, but while this grabbed media soundbites in many circles – the Average Hourly Earnings numbers came in below expectations. The broad Forex market proved dynamic with a stronger USD in many cases, but intriguingly equity markets in the States generated upwards momentum on Friday too. U.S Treasuries were mixed regarding their yields, and the 10-year bond while finishing up for the week was below its highs.

WTI Crude Oil One Month Chart as of 9th of Oct. 2023

The coming week will likely continue to produce nervousness, but outlook will be helped via a couple of U.S inflation reports and the FOMC Meeting Minutes report. Crude Oil prices should be watched as news from the Middle East unfolds. Gold remains under pressure.

Cryptocurrency speculators should keep their eyes on Binance Coin as it battles important lows. Bitcoin has remained relatively stable, but BNB/USD is near crucial support that could signal another wave of pressure is developing within the Binance exchange.

Monday, the 9th of October, International Monetary Fund – week-long meetings get underway and investors who participate in global stock markets and bonds should pay attention to the chatter.

Tuesday, the 10th of October, Central Bank Officials speaking – ECB President Lagarde will be speaking at the IMF conference. Federal Reserve officials will be speaking at meetings in the U.S. While the chatter may cause some nervous reactions briefly in financial institutions, it is unlikely the central bankers will say anything that is surprising.

Wednesday, the 11th of October, U.S Producer Price Index – the broad and core reports should be watched. Last week’s lower Average Hourly Earnings numbers were slightly surprising, but the recent higher energy costs could factor into the PPI results. The broad report is anticipated to show a decline. If the Producer Price Index statistics come in weaker than expected this could help the USD lose some strength.

Wednesday, the 11th of October, U.S FOMC Meeting Minutes – the publication is expected to follow the rhetoric already voiced by the Fed at their last press conference. However, insights regarding dialogue could move the needle in Forex. The U.S central bank is widely expected to raise the Federal Funds Rate in November, but what comes beyond this anticipated move is still in question. Expect the key word in the FOMC report to be ‘inflation’.

Thursday, the 12th of October, U.K Gross Domestic Product – the growth numbers from Great Britain are expected to show a slight rise in GDP. If the gains match expectations or come in better it could help bolster the GBP/USD which has been struggling against the USD for the past three months.

Thursday, the 12th of October, U.S Consumer Price Index – these reports will be crucial and will impact Forex and equities immediately after their release. While the Core CPI number is expected to match last month’s outcome, the broad reports are anticipated to be weaker. If the inflation numbers are stronger than expected the USD could gain strength, if the results are weaker it could help build selling momentum in the USD.

USD/CNY Six Month Chart as of 9th Oct. 2023

Friday, the 13th of October, China Consumer and Producer Price Index – the two releases will be watched carefully by investors. China’s economic data has been weak and financial institutions have become concerned by deflation. The USD/CNY may be impacted upon the publication of the reports.

Friday, the 13th of October, U.S Consumer Sentiment via the University of Michigan – following the CPI numbers from the U.S on Thursday, these numbers will show the attitude of U.S consumers and their spending habits. Financial institutions will monitor these numbers and correlate them to the U.S inflation reports seen earlier.

postN41.1

Nervous Trading Results End of Last Week Serve as Caution

Nervous Trading Results End of Last Week Serve as Caution

The end of last week saw mixed U.S inflation data and lingering nervous sentiment regarding outlooks about U.S Treasuries, create rather choppy conditions for day traders. Economic data this week should be more calm because there appears to be less significant risk events on the horizon. Financial institutions finished Friday within a USD buying mode, a bearish gold trend, and U.S stock indices declining – highlighting fragile conditions remain evident among larger market players.

NZD/USD Six Months Chart as of 13th August 2023

Monday, 14th of August, New Zealand Business Services Index – this report may turn out to be the highlight of the day for some traders. The NZD/USD which will start tomorrow near values last seen in the middle of November of 2022, may find interested speculators glancing at the report. But the NZD is moving largely under a USD centric driven market, like most of the broad Forex market. Mid and long-term technical support levels are certainly in focus, and they have proven vulnerable recently as the NZD/USD trends lower.

Tuesday, 15th of August, China Industrial Production – economic data from the nation has been troubling regarding deflation. However, traders who lean towards a ‘Western’ bias should remember to keep their perspectives realistic, because weaker China economic results mean the global economy is struggling too. A slight decline in Industrial Production is expected. Weaker than expected numbers from China could indicate ‘soft’ demand via export partners.

As an aside financial institutions will keep their eyes on the China real estate market too, this as whispers about ‘Country Garden Services Holdings’ funding problems remain a talking point and potentially escalate. Values of properties are suffering from declines too in China and this is hurting the domestic economy.

Tuesday, 15th of August, U.S Retail Sales – a slight gain in spending by U.S consumers is expected to be seen. If the number can meet the anticipated gain of 0.4% the result may not spark too much volatility. If for some reason a higher outcome is produced, this could spark some concerns about U.S Federal Reserve rhetoric. Although it may seem counter-intuitive to some traders, a weaker number could help ignite some bearish selling of the USD.

Wednesday, 16th of August, New Zealand Official Bank Rate – the interest rate policy from the RBNZ is expected to remain in place. Although it should be noted both New Zealand and Australia have almost made it a habit to surprise investors over the past few months.

Wednesday, 16th of August, U.S FOMC Meeting Minutes – the report will be studied for clues regarding outlook. However, the Fed has a well-practiced ability to maintain tight lips and not disclose too much internal thinking, particularly when it comes to disagreement regarding policy – which is seemingly escalating in the Federal Reserve.

Thursday, 17th of August, U.S Weekly Unemployment Claims and Philly Fed Manufacturing PMI – in what has likely been a quiet week of data leading up to these reports, some analysts may try to get the attention of their clients regarding these results to create ‘noise’, but unless there is a strong miss the data is likely to simply be digested quietly into the broad marketplace.

GBP/USD One Week Chart as of 13th August 2023

Friday, 18th of August, U.K Retail Sales – last week’s better than expected GDP numbers from Britain will make the outcome of this consumer data rather intriguing. The GBP/USD could find some impetus from the results. The estimate is calling for a decline of minus -0.4% compared to last month’s gain of 0.7%. The GBP/USD which went into last weekend near lows will likely find plenty of attentive traders as this new week comes to a close.

postN26.1

USD/INR: Bounce Higher Ignites a Return to High Water Values

USD/INR: Bounce Higher Ignites a Return to High Water Values

The USD/INR is trading near 82.4350 as of this writing, which is a value the currency pair has not touched since the second week of June. While some analysts may say the move to higher ground yesterday and early this morning is based on the U.S FOMC Meeting Minutes, Wednesday’s report from the Federal Reserve likely only reinforced the bullish momentum which started earlier this week. The world of Forex can feel fickle, particularly when so many of the internal dynamics are hidden from a large segment of people who are trying to speculate on the results.

If the mechanics of the move higher which started on Monday are examined a couple of points should be considered closely, the low of the USD/INR was around 81.7300 on the 3rd of July. This low took place as most U.S financial institutions were on holiday in preparation for Tuesday’s 4th of July celebrations.

Fears of U.S Economic Prospects: Behavioral Sentiment and Stagflation Potential

The reversal higher since the 3rd of July has been pronounced, but before going into last weekend the USD/INR was largely trading within a consolidated manner near the 82.0000 level with a test of this mark having been displayed forcefully since the middle of June. A range of nearly 81.8500 to about 82.1500 largely has played out the past three weeks of Forex trading.

USD/INR One Month Chart as of 6th July 2023

Monday’s dip in value to lows around 81.7300 took place when there was very little volume in the USD/INR market. The depths challenged marks not seen since the first week of May.

The reversal higher the past few days is certainly part of more transactional volume starting to be pumped into the USD/INR as U.S financial institutions have returned, but they are also likely being caused by an underlying nervousness within the Forex markets which may be factoring in the notion the U.S Federal Reserve seems to be on a path which will increase the Federal Funds Rate on the 26th of July.

The behavioral sentiment being generated regarding a Federal Reserve which stays in an aggressive stance started before yesterday’s release of the FOMC Meeting Minutes. Nervous conditions have been on the surface of the broad markets because U.S inflation remains rather resilient – but also importantly because last week’s Gross Domestic Product numbers published on the 29th of June, came in stronger than anticipated. From a troubling perspective some analysts could point to the moderately improved growth and combination of stubborn inflation as a sign stagflation is starting to shadow the U.S, which would certainly be a troubling predicament.

USD/INR Move to New Highs this Morning could Ignite more Nervous Reactions

USD/INR speculators may believe the move higher in the currency pair is overdone and that values need to be lower. However, the current price of the USD/INR is one that has been experienced quite a bit since October of 2022. A look at a one year chart shows the USD/INR has returned to higher ratios of its price range which it has experienced since breaking upwards in the middle of September 2022. And to make things more interesting for technical traders, the USD/INR has actually produced a rather stable range between 81.6000 and 82.9000 since February of this year.

USD/INR One Year Chart as of 6th July 2023

While traders are certainly trying to anticipate what will happen next in the USD/INR to gain an advantage, they should remember the currency markets are almost impossible to time on a daily basis, but a look at mid-term prices does offer plenty of insights. If the USD/INR climbs too high, perhaps to the 82.5000 level the Reserve Bank of India could get a bit nervous and consider some type of intervention which it supposedly has done a few times over the past handful of months – but perhaps at higher price ratios.

USD/INR Mid-Term Considerations and the Current Price Range

However it is more cost efficient and reputably less damaging for central banks to not intervene if they do not have to, and simply let market dynamics effectively create a price for the USD/INR based on supply and demand. Meaning the current prices of the USD/INR look to be rather high, but taking into consideration the range of the Forex pair the past five months the values are not new. The prices in fact have been rather established, meaning the USD/INR may trade slightly higher, but then a lower wave of downward momentum could be anticipated.

Day traders who are gamblers may be tempted to sell the USD/INR if the currency pair finds more upwards mobility in the near-term. Trading volumes should be back to normal now that U.S financial institutions have returned from their holidays, and traders should be ready for the potential of fast price velocity developing. Risk management on wagers regarding the USD/INR are essential as always.

postN24

Interest Rates, Fireworks, OPEC, Fed Minutes, and Jobs Data

Interest Rates, Fireworks, OPEC, Fed Minutes, and Jobs Data

Global day traders will certainly be able to work early this week, but they should note the 4th of July holiday in the U.S will deliver rather light volumes Monday and Tuesday. Markets in the U.S will be open on the 3rd, but speculators need to understand that price action may be flat and then experience sudden bursts of energy. Financial institutions in the U.S could be rather quiet until Wednesday.

Monday, the 3rd of July, European Manufacturing PMI – data will come from across Europe and is expected to show the sector remains rather lackluster. France, Germany, the U.K and others will issue reports.

Monday, the 3rd of July, U.S Manufacturing PMI via the ISM – the Purchasing Managers Index numbers are expected to produce a slight rise, but remain under the level of 50. However, any increase compared to last month’s outcome will be an additional sign the U.S economy is battling on and would give the U.S Federal Reserve another reason to lean towards an interest rate hike later this month.

AUD/USD One Month Chart as of 2nd July 2023

Tuesday, the 4th of July, Australia RBA Cash Rate and Statement – while some analysts assume no interest rate hike will be delivered in July because the CPI has shown a slight downturn, there seems to be rather large whispers another hike of 0.25% could be added from the Reserve Bank of Australia. AUD/USD traders certainly need to pay attention, and folks with limited funds should stay on the sidelines until the decision is released.

Tuesday, the 4th of July, U.S Independence Day – banking holiday.

Wednesday, the 5th of July, China Caixin Services PMI – economic data from China has certainly shown signs of downward pressure. A slight decrease is the expected result.

Wednesday, 5th of July, OPEC Meetings – the energy cartel will be conducting its official get together in Vienna, Austria and oil traders should be on alert for any news and decisions made public that could affect the energy sector.

Wednesday, 5th of July, U.S FOMC Meeting Minutes – the publication will provide insights into the Federal Reserve’s decision to ‘pause’ interest rate hikes last month, but could also add fuel to the notion the U.S central bank remains within an aggressive stance regarding inflation. Forex markets will react to the report.

Thursday, 6th of July, U.S Services PMI via ISM – the statistics will be monitored closely due to the rather positive outcome from the GDP report last week, which showed the U.S economy remains rather resilient. A positive outcome in the Services numbers will add further evidence for the Federal Reserve to remain hawkish.

Friday, 7th of July, U.S Jobs Numbers – the employment data will culminate as the week comes to an end with the Non-Farm Employment Change and Average Hourly Earnings figures. Yes, on the day before, Thursday, traders will also see the JOLTS numbers and weekly Unemployment Claims. However, it is the Non-Farm and wages data that financial institutions will largely react upon depending on the outcomes. Because it is a ‘holiday’ week in the U.S, the reports may find a muted response, but financial institutions will use the information to gauge their mid-term outlooks and position their assets including Forex and bonds.

post40

USD/INR: Narrow Price Range as Nervous Sentiment Exhibited

USD/INR: Narrow Price Range as Nervous Sentiment Exhibited

The USD/INR has delivered a rather narrow price range the past four days of trading as the currency pair awaits impetus from crucial U.S risk events.

The USD/INR is trading near the 82.7000 ratio as of this writing. While the currency pair over the past month has seen a rather incremental climb higher, the past handful of days has seen rather sideways price range emerge. Talk about Reserve Bank of India intervention has been discussed widely and this has caused speculative caution too. However, risk events from the U.S which will be delivered soon are also a catalyst for conservative trading in the USD/INR and broad Forex markets globally.

Trading Tip Regarding Bias that Forex Speculators should try to Avoid

A very important aspect for USD/INR traders to consider is that they should remove any bias they may feel personally regarding the Indian Rupee. Traders closely connected to the currency they are trading, particularly if they are citizens of the nation; tend to believe their national currency should always be stronger no matter the circumstances. This notion of bias does not always work out well for traders with a nationalist leaning.

The Indian Rupee is no different regarding its ability to maneuver against the USD like many other major currencies. While the Indian Rupee certainly has its own financial capabilities, the USD remains the dominant currency on the block and affects most outcomes. If a trader can remove their bias and love of their nation from their trading sentiment, this often makes it easier to have a more realistic viewpoint about potential price direction in the short-term and long-term. The Indian Rupee is an important global currency, one that will grow in stature, but traders should remember current circumstances too.

USD/INR Five Day Chart as of 24th May 2023

U.S Debt Ceiling Concerns and the Upwards Drift of the USD/INR Causing Problems

Concerns are being voiced regarding the failure of U.S debt ceiling talks, the inability to not find an agreement in the U.S Congress is problematic. June 1st is supposedly the date the U.S government must reach a conclusion. The past week has seen signs from Democrats and Republicans acknowledging the importance of finding a settlement, but political rancor still is making a mess of the situation. Trading institutions are certainly not happy about the loud debate and could ‘punish’ financial assets more over the short-term until a debt ceiling compromise is reached.

The move higher in the USD/INR has likely caught many speculators by surprise the past month. However, the drift upwards has correlated to the broad Forex markets the past couple of weeks, this as the USD has turned stronger against many major currencies. The USD/INR essentially went from 82.1200 to its current price since the 15th of May. The Forex pair was trading near 81.6000 on the 4th of May. The temptation to sell the USD/INR the past couple of weeks has likely been strong as traders flirted with the notion technically that the currency would have to reignite its downwards path, but that clearly has not happened.

Today and the remainder of the week, the U.S has important risk events on the calendar. U.S Treasury Secretary Janet Yellen will be speaking and will certainly be asked to state her opinion on the debt ceiling talks. She will likely try to offer a neutral tone and not scare the financial markets. However, she can certainly be counted upon to say it is important to reach an agreement so the U.S can continue paying its financial obligations.

Perhaps more important than Treasury Yellen’s talk this afternoon, will be the U.S Federal Reserve’s FOMC Meeting Minutes publication later in the day. Financial institutions globally are nervous about the Fed’s interest rate outlook regarding its June Federal Funds Rate decision. Many analysts have predicted the U.S central bank will halt interest rate hikes and not increase on the 14th of June. Yet inflation data from the U.S remains problematic. Today’s FOMC Meeting Minutes text will provide insights regarding the Federal Reserve’s last meeting and give an inside look towards its leanings for a potential hike or pause.

USD/INR traders should also be aware that important Gross Domestic Product data will come tomorrow which will offer details regarding U.S growth. On Friday the U.S will release Core Personal Consumption Expenditure statistics and this will provide inflation results, and the outcome will certainly influence the U.S Federal Reserve’s June interest rate decision.

post38

FOMC Meeting Minutes and Key Growth Data Coming this Week

FOMC Meeting Minutes and Key Growth Data Coming this Week

Monday the 22nd of May, Japan Core Machinery Orders – which will likely have very little impact on the markets – not even the USD/JPY should react too much. Although it should be noted last month’s figure was negative and this month’s result is expecting a better outcome.

Monday the 22nd of May, E.U Consumer Confidence – forecast to produce a negative number, but this statistic doesn’t usually get much of a response in the financial markets unless there is a shocking result.

Tuesday the 23rd of May, E.U French and German Manufacturing and Services PMI, along with the broad E.U results – the manufacturing statistics from France and Germany are expected to come in slightly better than last month’s results but remain in negative territory.

Tuesday the 23rd of May, U.K Manufacturing and Services PMI – traders will watch these results after the bad GDP numbers from Britain almost two weeks ago.

GBP/USD Three Month Chart as of 21st of May 2023

Tuesday the 23rd of May, U.S Flash Manufacturing and Services PMI – the reports could prove of interest and cause a bit of a tremor in the market, but unless there is a big surprise investors will remain cautious as they anticipate the next day’s potentially big risk events.

Wednesday the 24th of May, U.K Bank of England Governor Bailey – will be speaking at two events and could stir the GBP/USD with his comments on the British economy and inflation.

Wednesday the 24th of May, U.S Treasury Secretary Janet Yellen – will be speaking at a Wall Street Journal event, where she will be listened to for any comments on the ‘U.S debt ceiling” crisis. Yellen is a ‘trained’ speaker and she will try not to scare financial institutions who will have some leaders in attendance.

Wednesday the 24th of May, U.S FOMC Meeting Minutes – the report which will outline the U.S Federal Reserve’s thinking regarding its recent interest rate hike and what it might be considering regarding June could impact the marketplace. The report is published late in the day, but financial institutions will certainly wait for the publication and react. While the FOMC paper is sometimes considered ‘noise’, this report will be important because of the nervous sentiment which exists in markets like Forex and equity indices as they deal with a lack of clarity.

Thursday the 25th of May, U.S Preliminary Gross Domestic Product – the growth (or lack of growth) numbers from the States will be watched intently. A muted projected gain of 1.1% is anticipated by some analysts.

Thursday the 25th of May, U.S Preliminary GDP Price Index – this report will deliver insights regarding inflation in the U.S and should be given some attention by traders.

Friday the 26th of May, Core PCE Price Index – the inflation numbers should be watched. Any surprise above the anticipated 0.3% forecast could cause an affect in the financial markets.