postN44.1

Dog Days of Summer and a Return of Calm as Storms Threaten

Dog Days of Summer and a Return of Calm as Storms Threaten

With essentially two full weeks of trading until the end of August and the unofficial end of summer in sight, perhaps this week may be a good time for retail traders to be observers if they do not have the stomach for potentially noisy speeches and markets.

However, speculators who can block out media hyperbole and microphone soundbites from folks standing on podiums may find conditions rather attractive. As always outlook depends on perspective, time frames and managing risk. Behavioral sentiment has been rather chaotic the past month and some traders may suspect we are approaching the end of the loud spectacles of nervous drama in the markets.
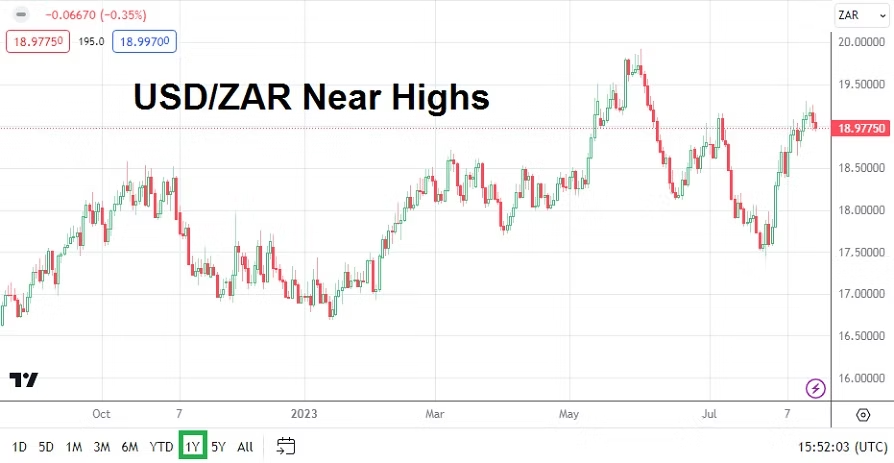
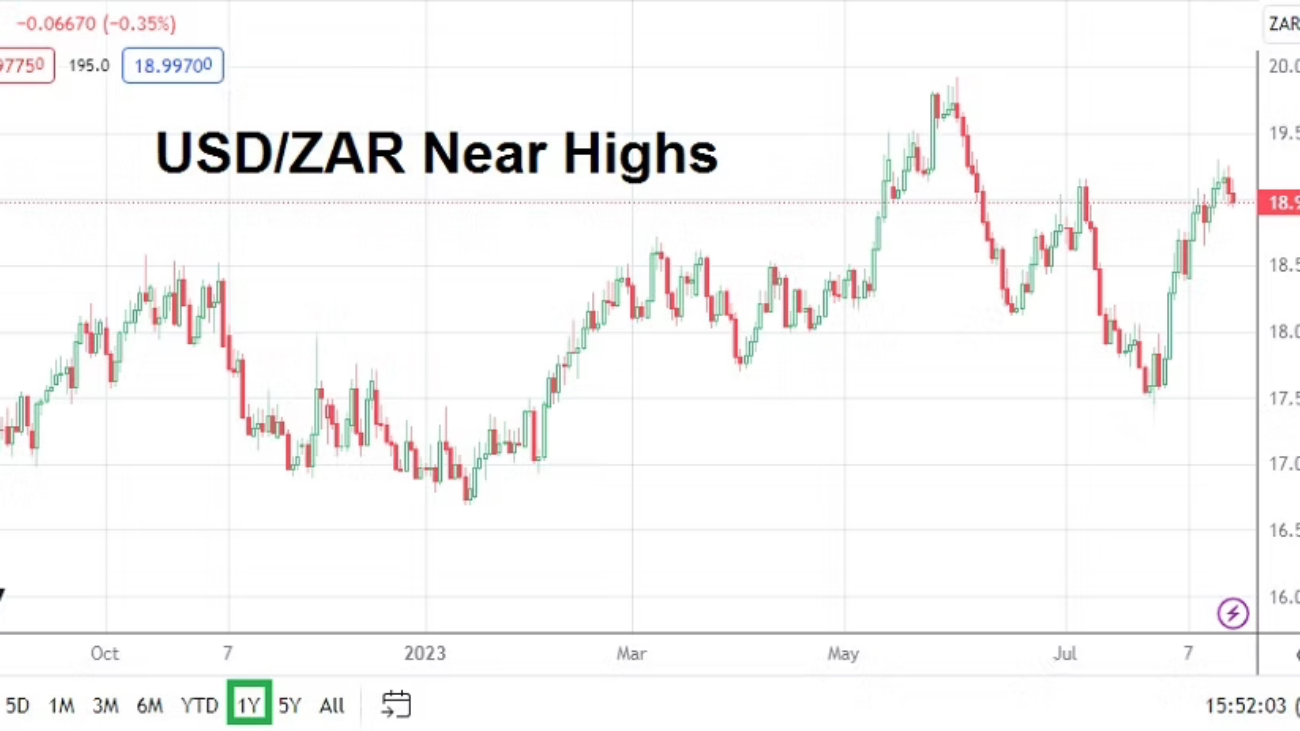
USD/ZAR One Year Chart as of 20th August 2023

The economic data this coming week should prove to be a rather mild schedule, but outside influences will certainly get publicity and get fanfare from talking heads who want 15 minutes of your attention. The BRICS Summit will get underway in Johannesburg, South Africa officially on the 22nd. Another big conference later this week will be the U.S Federal Reserve’s Jackson Hole Symposium. Both events will produce plenty of conversations about inflation, economic stability and a more cohesive global cooperation monetarily. This will also create many raised eyebrows among traders who are skeptical about these type of events.

While leaders of China, Russia, India, Brasil and South Africa get together in Johannesburg, it is likely we will hear talk about potential BRICS expansion and the pursuit of a new unified currency which doesn’t rely upon the USD. However, in the background there is likely to be plenty of distraction because of China’s faltering economic data and Russia’s Ruble which has been impacted severely in the past month. Plenty of large rugs will be needed to hide the dust which threatens to make this BRICS event rather memorable.

Add the ongoing saga of Niger and the absence of a political solution for the world’s fourth largest producer of uranium as a potential flash point standing on the side of the stage waiting to make an appearance regarding Africa news. Perhaps it is too cynical to wonder if coordinated military action within Niger will await the end of the BRICS Summit. This so China and Russia are not given an opportunity on the ‘world stage’ as a united voice to offer their opinions regarding an intervention.

The Jackson Hole get together of global central bankers from the Fed, BoE, ECB, BoJ and others will certainly grab headlines late this week, but the script is mostly known regarding the rhetoric to come from the Federal Reserve’s annual event. Forex may move based on comments from the central bank chiefs as they speak towards the end of this week, but it is unlikely anything surprising is going to be heard. U.S Treasuries will remain a topic because of the ability to lock in a solid return over the mid-term compared to betting on the outcomes of the stock market, but this scenario has been playing out the past month. Investors should prepare for a long line of speeches regarding economic outlooks from central bank officials all week. Day traders should also remember that the chatter starts to be ‘tuned out’ as the speeches grow longer.

Traders looking for other outside influences may want to look at the cryptocurrency market where major assets have shown signs of struggling. Bitcoin and Binance coin could remain in the headlines for all the wrong reasons, if their prices continue to challenge important support levels and become more vulnerable.

Monday, 21st August, China Prime Rates – economic data from the nation has caused concerns that real estate problems are spilling over into the domestic consumer market. The interest rates China lends money to consumers is expected to be lowered to try and spark spending. Recent economic reports from China have been bad, and readers who believe this is merely ‘Western’ bias being reported should be careful to look for other sources to confirm data. Investment within the second biggest economy of the world has become tentative, because there is a fear the ‘official’ China numbers may be worse than those being reported.
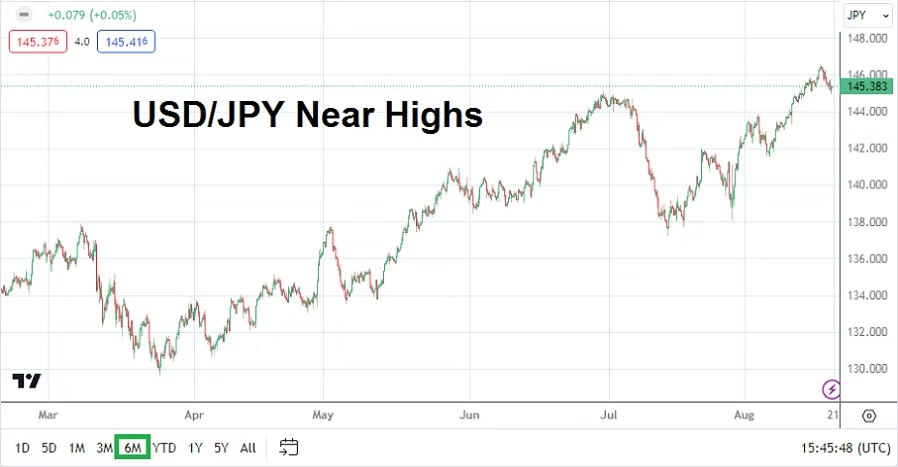
USD/JPY Six Months Chart as of 20th August 2023

Tuesday, 22nd August, Japan Consumer Price Index – the Bank of Japan report is expected to show a slight decline to the inflation numbers. Last month’s outcome of 3.0% is expected to lower and produce a 2.9% result. The USD/JPY could react momentarily to the outcome, the currency pair is near highs it hasn’t touched since November 2022.

Tuesday, 22nd August, U.S Existing Home Sales – the data is expected to show a slight decline of purchases. Mortgage prices continue to climb in the U.S and homeowners are less likely to desire taking on a new higher mortgage, this if they already have a lower mortgage locked in from a few years ago within a dwelling they already live.

Wednesday, 23rd August, Flash European Manufacturing and Services PMI – the reports will come from the E.U and U.K. The German and British outcomes will stir the Forex markets. The manufacturing data from Germany and Britain are forecast to be slightly negative.

Wednesday, 23rd of August, U.S Flash Manufacturing and Services PMI – the U.S reports are expected to show a decline in the manufacturing sector. If a negative result materializes, this could actually spark a selloff of the USD – if the financial markets have returned to calm waters by the middle of this week. Weaker numbers might be interpreted as another reason for the U.S Federal Reserve to remain neutral and why they should consider becoming dovish over the mid-term.

Thursday, 24th of August, U.S Durable Goods Orders – the core and broad numbers are anticipated to show declines. If the Durable Goods Orders numbers are worse than expected this could spark more USD selling, particularly if financial institutions are already calm and feel the data is another step to ‘lowering’ the Fed’s hawkish interest rate rhetoric. However, for the USD to weaken the markets will likely have needed to be tranquil beforehand, without major surprises having happened earlier in the week that may have escalated nervous behavioral sentiment in the broad markets.

Friday, 25th of August, Germany Business Climate and GDP – the ifo Business Climate report comes from a composite of manufacturers, wholesalers, and other enterprises and is expected to be lower than last month’s outcome. The Gross Domestic Product results are anticipated to show no changes, which would mean Germany’s economy remains in the doldrums and is flirting with recessionary pressures.

Friday, 25th of August, U.S University of Michigan Consumer Sentiment – this revised reading is expected to show U.S consumers remain steady without significant changes compared to the previous outcome.
postN43

Alert: Important Support in View for Binance Coin Traders

Alert: Important Support in View for Binance Coin Traders

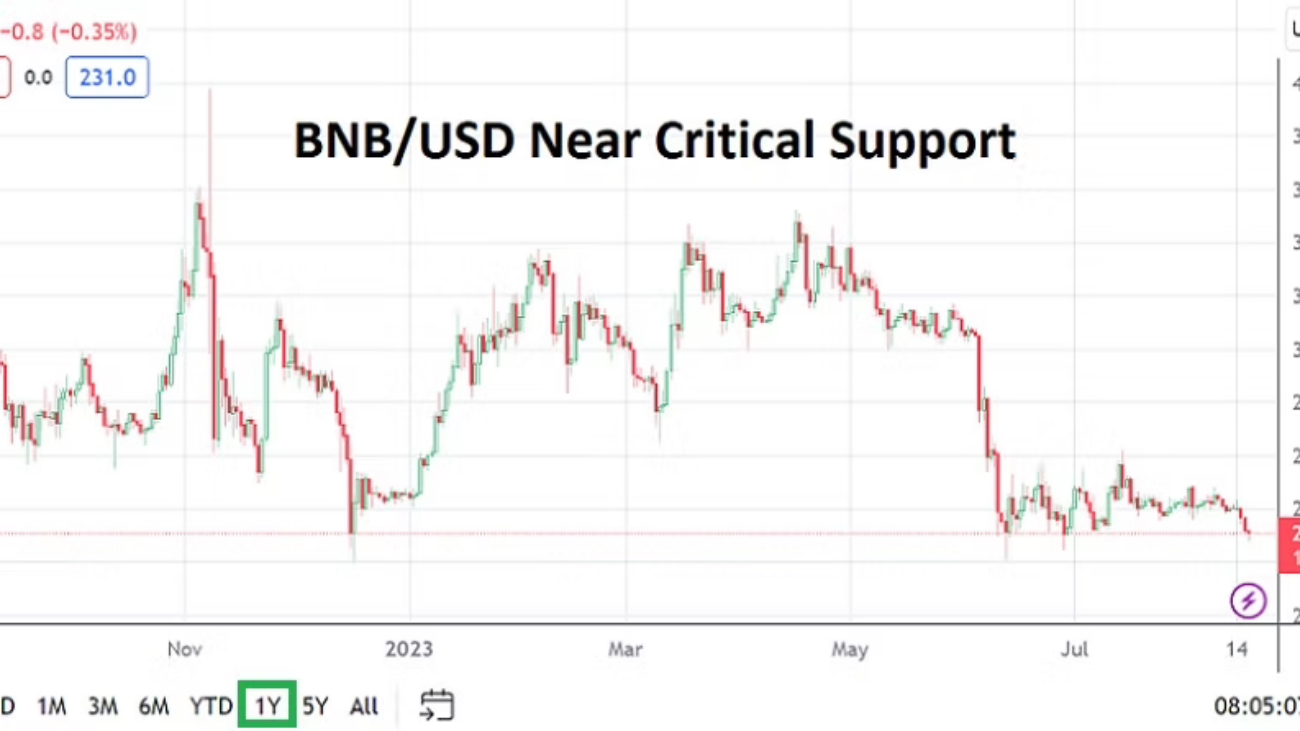
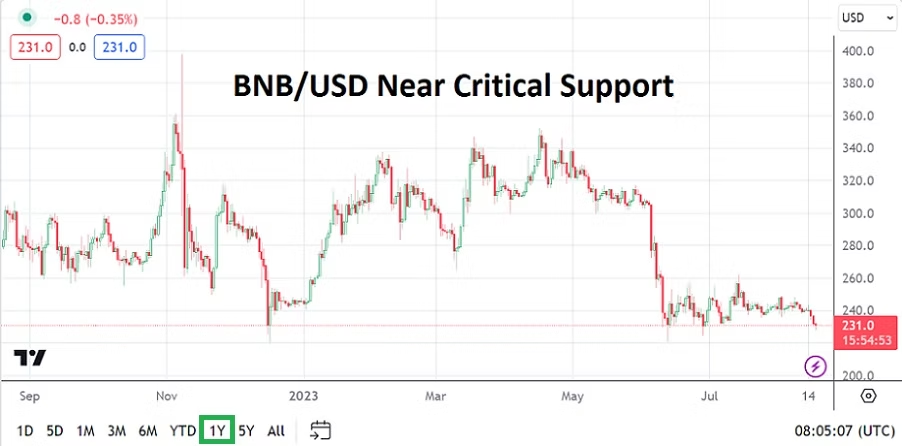
BNB/USD One Year Chart as of 17th August 2023

Important support for BNB/USD is now being battled. The price of Binance coin is near a key inflection value of 230.00 USD. The digital asset world including Bitcoin and other cryptocurrencies has taken on stronger selling recently. Legal issues surrounding Binance have not gone away, nor will they. If Binance starts to show stronger price velocity lower it could spook the broad cryptocurrency market in a large manner. Binance is still the biggest crypto exchange in the world, even as it has come under the investigative pressures of the U.S and some European nations.

Traders should pay attention to ‘stablecoins’ as a barometer of behavioral sentiment in the cryptocurrency landscape. Tether should be watched closely. If USDT sustains value below the 1.00000 USD level for more than a couple of days this would be a negative signal that ‘players’ in the cryptocurrency world are getting more nervous.

Bitcoin is also seeing steady selling early this morning and the price of BTC/USD is near 28,550.00 as of this writing. If BTC/USD were to break below the 28,000.00 this could also add to fear and noise in the cryptocurrency world.

The next seemingly important level for BNB/USD below is around the 225.00 USD mark if tested, if this level proved vulnerable and trading momentum continued downward stronger selling could develop if panic erupts surrounding Binance coin. Traders should be very careful in the cryptocurrency trading environment right now. Legal shadows hovering over Binance have existed for a long-time, and if selling pressure were to mount and values are suddenly tested from June of last year when the 200.00 BNB/USD level was last tested (this as FTX collapsed) this would clearly not be a good signal.

postN42.1

Day and Institutional Traders Suffering Nervous Conditions

Day and Institutional Traders Suffering Nervous Conditions

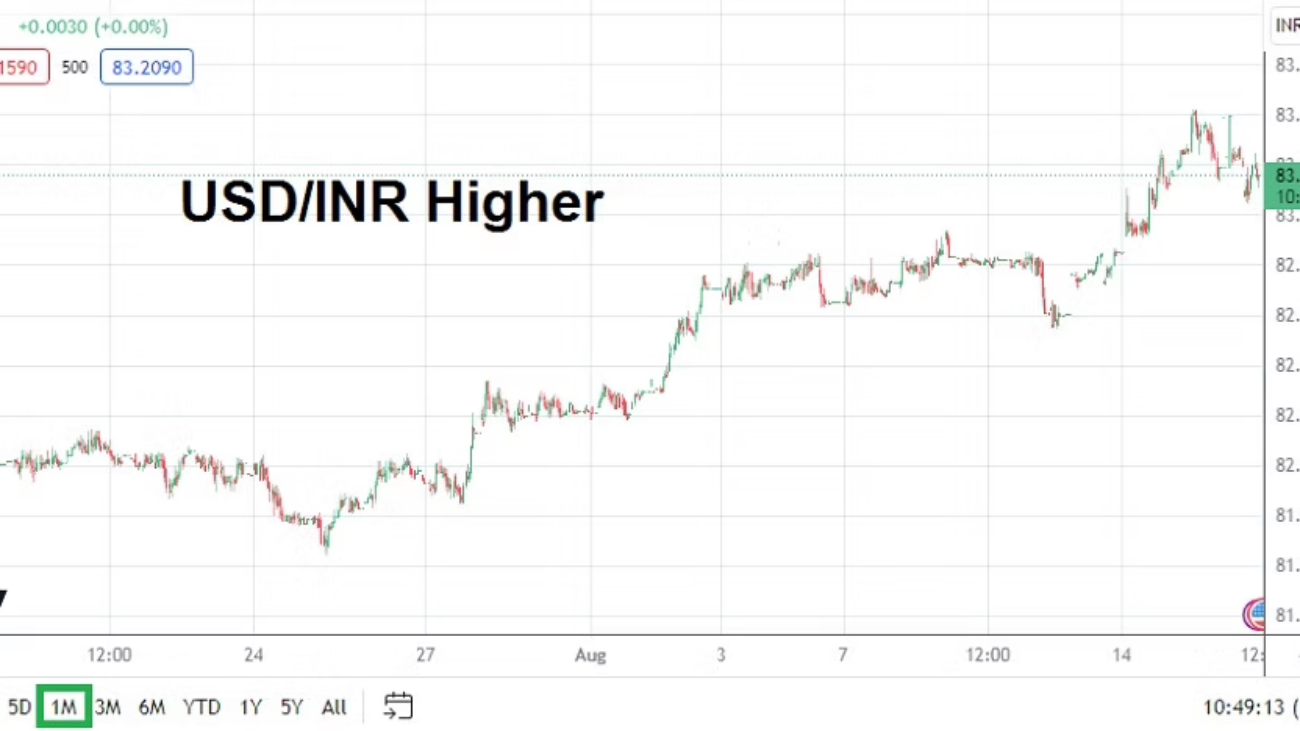
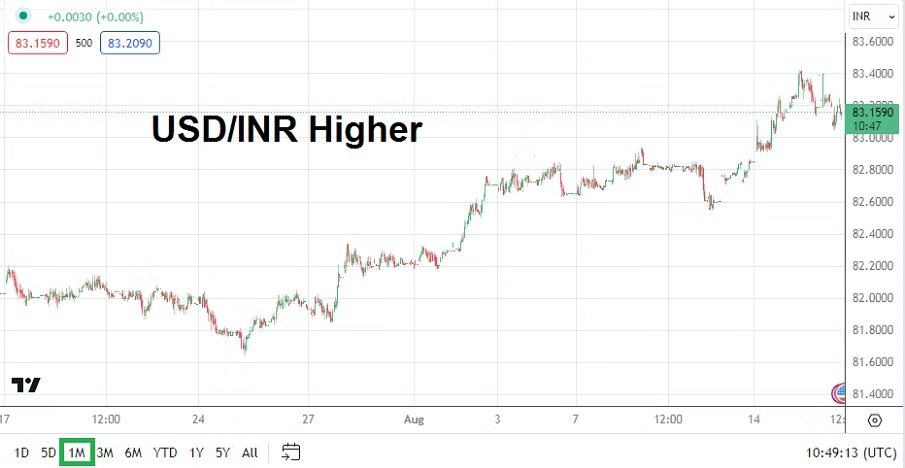
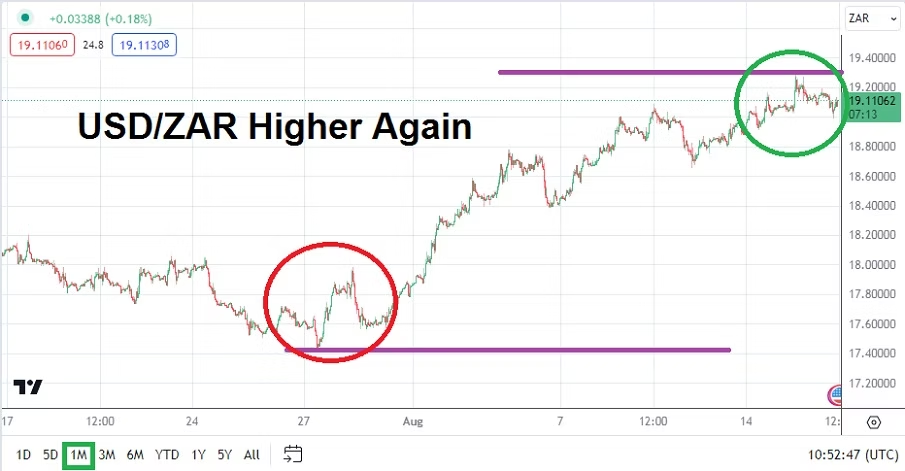
Market price action has caused quite a few interesting interpretations of the prices being demonstrated in Forex, gold and equity markets recently. The USD/INR is now at record heights, the USD/ZAR is back above 19.00000 and the USD/BRL is again near the 5.0000 ratio.

USD/INR One Month Chart as of 16th August 2023

While Forex traders around the world look for clues as to why their local currencies are suffering and are likely blaming domestic policy from their own governments and central banks, they should remember the larger global financial markets tend to move in a unified sphere. Domestic concerns are a real cause for market action often, but when global sentiment becomes nervous the larger force of institutional financial houses shake the ground.

Correlations exists worldwide because of behavioral sentiment ruling outlooks over the near, mid and long-term in the marketplace. While we like to put our faith in the financial markets as an all knowing entity, this is far from the truth. Humans who react to nervous conditions and also have bias are the ones still making decisions in financial houses, they are the ones giving orders to their programmers via their trading software which is largely geared to follow perceived trends these institutions deem important.

USD/ZAR One Month Chart as of 16th August 2023

Most financial institutions are not speculative in nature, day and even longer term retail traders should remember this point. Most institutions are trying very hard not to ‘speculate’, they are simply positioning per their outlooks based on their understanding of the trading landscape. Whispers of potential downgrades from U.S rating agencies on larger corporate banks yesterday sent a shudder through the broad markets, economic data and rumors swirling about China are not helping either. The current volatility in the broad markets is not welcomed warmly by financial institutions.

When price velocity accelerates and volatility flourishes in highly charged trading situations, this suggests financial institutions are nervous and not able to find comfortable positions. Conflicting ‘opposite’ positions from other larger players are causing market chaos in Forex, equities and other financial assets. There is a herd mentality in trading and when the herd doesn’t march in an unified direction chaos happens.

Most institutional players want calm, they want tranquil trading conditions so they can manage their clients’ money quietly. Bonds, equities and indices, real estate holdings via REITs, and gold make up a large part of their holdings.

Most U.S pension funds for instance have mandates to be positioned into a large amount of quiet investment vehicles which do not trade with wild price ranges. They seek steady returns from their institutional investors that can be counted on in a quantitative manner to demonstrate to their clients.

Large financial institutions are allowed sometimes to trade 2 to 4% of their holdings in different categories of speculative investments – such as start-ups, allocate cash to hedge funds they trust, small cap stocks they might know about, etc., depending on the exact mandates agreed upon.

Yes, hedge fund managers like Bill Ackman and investor Michael Burry get a lot of attention when they bet against the markets, but believe it or not they are small fish in a large ocean a lot of the time. They are good at what they do, but their speculative positions cannot be mirrored by most financial institutions or small day traders.

Ackman and Burry may be trading billions, but remember institutional financial companies including pension funds when combined total approximately 80% of market cap. Institutional trading decisions can cause massive waves in the financial world, but they actually seek calm seas.

When markets become volatile this often means institutional traders are not comfortable and their behavioral sentiment is fragile. Forex for example is often affected by financial institutions moving money as they handle export and import transactions for companies, but transactions are often done to buy and sell equities too. The Bank of International Settlements estimated an average around 7.5 trillion USD in value was traded in Forex everyday in 2022.

Day traders should not take it personally when the markets move against them, instead they should look to try and mirror the sentiment of larger financial movers. However, knowing and timing financial institution decisions is elusive because short term compared to long term considerations are often different.

Most traders are merely betting on the price action the large institutional funds are undertaking via the direction of the marketplace. Day trading for most retail speculators remains dangerous. A solid fundamental understanding of market ‘forces’ can allow smaller traders to feel more comfortable.

postN41.1

Nervous Trading Results End of Last Week Serve as Caution

Nervous Trading Results End of Last Week Serve as Caution

The end of last week saw mixed U.S inflation data and lingering nervous sentiment regarding outlooks about U.S Treasuries, create rather choppy conditions for day traders. Economic data this week should be more calm because there appears to be less significant risk events on the horizon. Financial institutions finished Friday within a USD buying mode, a bearish gold trend, and U.S stock indices declining – highlighting fragile conditions remain evident among larger market players.

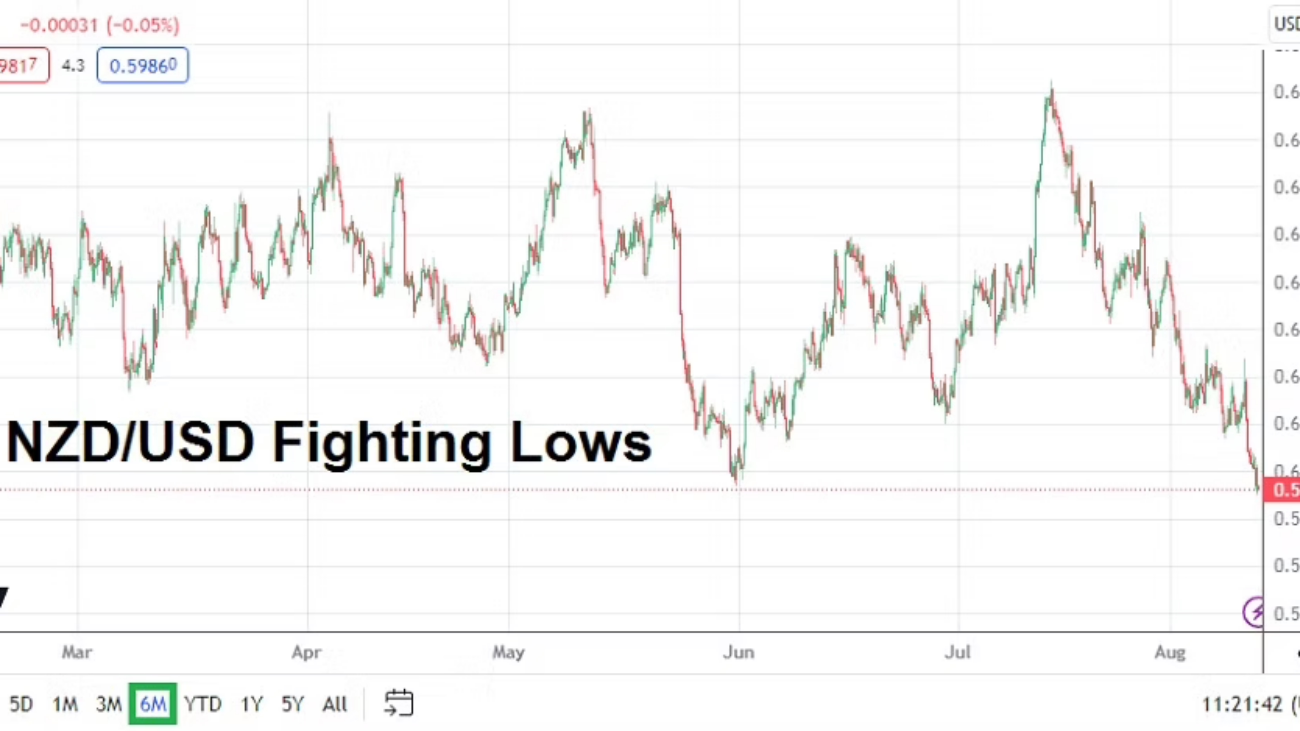
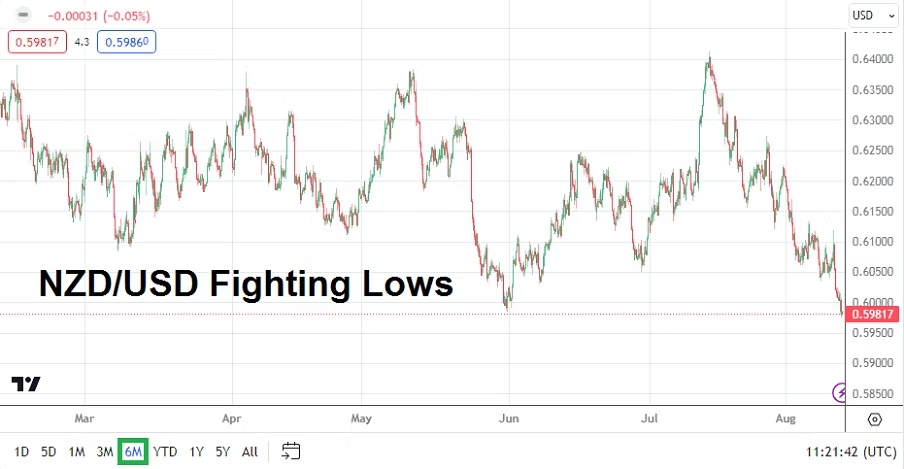
NZD/USD Six Months Chart as of 13th August 2023

Monday, 14th of August, New Zealand Business Services Index – this report may turn out to be the highlight of the day for some traders. The NZD/USD which will start tomorrow near values last seen in the middle of November of 2022, may find interested speculators glancing at the report. But the NZD is moving largely under a USD centric driven market, like most of the broad Forex market. Mid and long-term technical support levels are certainly in focus, and they have proven vulnerable recently as the NZD/USD trends lower.

Tuesday, 15th of August, China Industrial Production – economic data from the nation has been troubling regarding deflation. However, traders who lean towards a ‘Western’ bias should remember to keep their perspectives realistic, because weaker China economic results mean the global economy is struggling too. A slight decline in Industrial Production is expected. Weaker than expected numbers from China could indicate ‘soft’ demand via export partners.

As an aside financial institutions will keep their eyes on the China real estate market too, this as whispers about ‘Country Garden Services Holdings’ funding problems remain a talking point and potentially escalate. Values of properties are suffering from declines too in China and this is hurting the domestic economy.

Tuesday, 15th of August, U.S Retail Sales – a slight gain in spending by U.S consumers is expected to be seen. If the number can meet the anticipated gain of 0.4% the result may not spark too much volatility. If for some reason a higher outcome is produced, this could spark some concerns about U.S Federal Reserve rhetoric. Although it may seem counter-intuitive to some traders, a weaker number could help ignite some bearish selling of the USD.

Wednesday, 16th of August, New Zealand Official Bank Rate – the interest rate policy from the RBNZ is expected to remain in place. Although it should be noted both New Zealand and Australia have almost made it a habit to surprise investors over the past few months.

Wednesday, 16th of August, U.S FOMC Meeting Minutes – the report will be studied for clues regarding outlook. However, the Fed has a well-practiced ability to maintain tight lips and not disclose too much internal thinking, particularly when it comes to disagreement regarding policy – which is seemingly escalating in the Federal Reserve.

Thursday, 17th of August, U.S Weekly Unemployment Claims and Philly Fed Manufacturing PMI – in what has likely been a quiet week of data leading up to these reports, some analysts may try to get the attention of their clients regarding these results to create ‘noise’, but unless there is a strong miss the data is likely to simply be digested quietly into the broad marketplace.

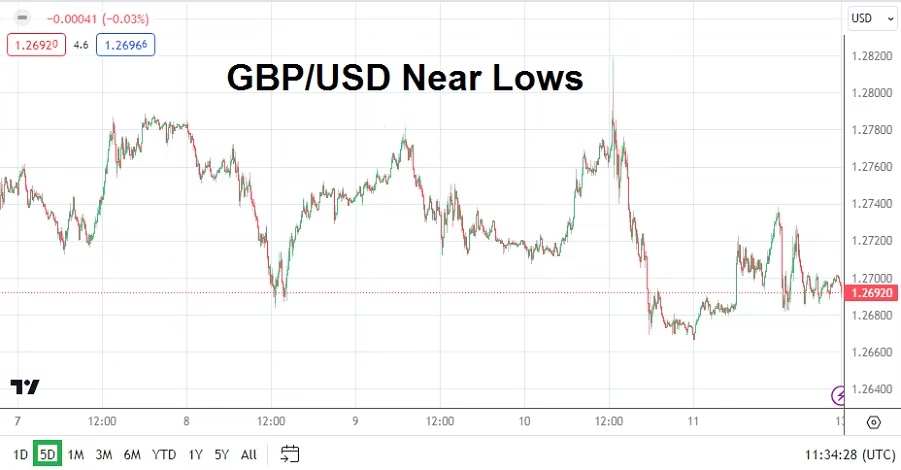
GBP/USD One Week Chart as of 13th August 2023

Friday, 18th of August, U.K Retail Sales – last week’s better than expected GDP numbers from Britain will make the outcome of this consumer data rather intriguing. The GBP/USD could find some impetus from the results. The estimate is calling for a decline of minus -0.4% compared to last month’s gain of 0.7%. The GBP/USD which went into last weekend near lows will likely find plenty of attentive traders as this new week comes to a close.

postN40

Trading Tips: Perspectives and Gaining Behavioral Sentiment

Trading Tips: Perspectives and Gaining Behavioral Sentiment

Data is everywhere. AI has helped increase the level of information accessible to day traders. However, the quality of the information and its insights remains questionable – suspect. Systems relying on technical, fundamentals, algos, and the magic word ‘quants’ are tools which can help a person make their decisions. Unfortunately they do not guarantee you are going to make money.

Profitable results in trading remain difficult to attain. Day traders – speculators – continue to look for a golden goose. Something or someone who can deliver profits on a steady basis remains hard to find. This article is to help you gain perspective, it is a trading tip. There are no secrets of the temple coming, but it may be time you stop looking for secrets which do not exist.

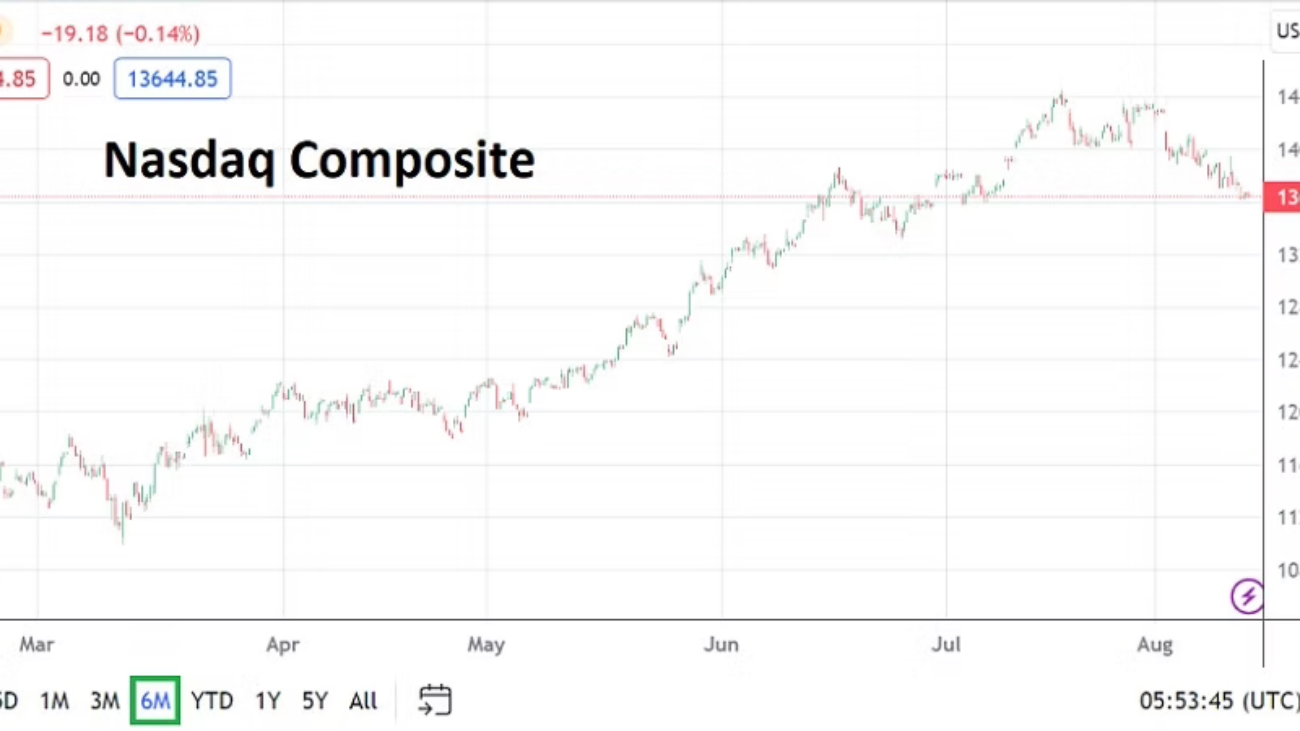
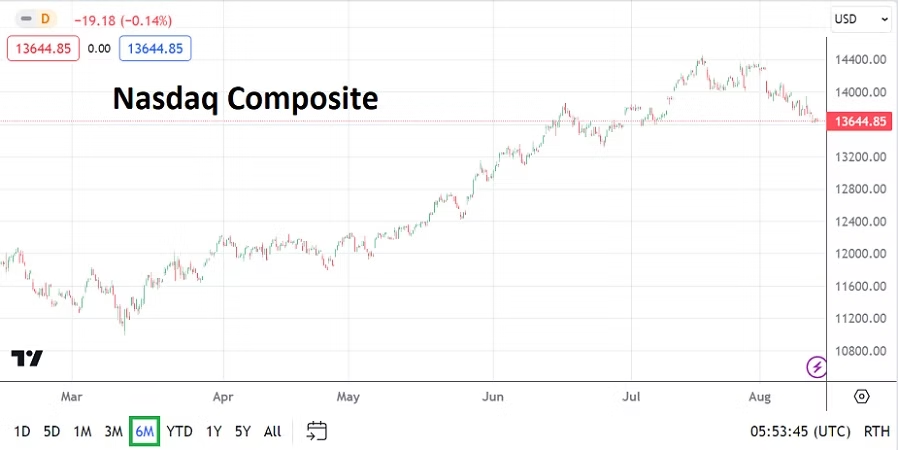
Nasdaq Composite Six Months Chart as of 12th August 2023

Trying to look forward and gaining genuine insights remains tough. Technical charts, fundamentals, opinions from experts all remain problematic to actually use in real time. The markets in a sense are alive, the environment is constantly changing. The moment information is shared it becomes old. Time and price action move fast. You can slow down the ‘game of trading’ by using different perspectives and practicing new ways to consider the dynamic values that are in flux that you are witnessing.

Behavioral sentiment – insights – regarding what the largest traders are going to do in the short, mid and long-term would be relevant. Understanding the asset you want to trade is important, understanding the inclination of the marketplace, price action – velocity – and timeframes of potential volatility is crucial. A key component would be to find a way to time a trade knowing what direction an asset is going to move.

This remains elusive for nearly all traders.

Again, this particular article is not going to solve this problem for you. It is to acknowledge the problem exists. We can have all the data in the world, past performances statistics, know what the markets are predicted to do, but the ‘game’ still needs to be played. Over 90% of day traders loss their money and eventually give up. Traders wagering on the markets need a way to put the odds of success in their favor. Folks may wonder why angrymetatraders.com writes about fantasy sports within its culture/ sports topics, it is because there is a correlation to sports and financial markets for speculators.

Day traders in many ways are not really participating in the marketplace, they are betting on the outcome of the results. The tiny trades of the majority of retail speculators are not affecting price action, sometimes the trades aren’t even being put into the real market – they are being traded virtually. Read about the topic B book trading within our articles if you have time.

Like sports gamblers who are not playing in the game, speculators are using their perceived knowledge of financial assets and past results to bet on future outcomes. A key ingredient to having successful trades that work in the financial markets is to have solid knowledge and a sense of what can develop as assets trade on a particular day. There are complexities within each sector, like every game being played in a variety of sports.

Gamblers not only bet on the outcome of the game, they also bet on the outcome of different components within the ‘contest’ – player stats, halftime scores, turnovers. Traders can do the same thing by speculating on an asset over different timeframes, and they can sometimes trade what are known as ‘options’ too, this to hedge on their positions or sometimes simply wager on their belief that a Forex pair or a share (stock) price is going to move in different ways during a certain period of time.

Understanding behavioral sentiment is important. The meshing of technical interpretation with fundamental data, and the way it affects perception and the tendencies of potential decisions to be made regarding outcomes is not easy. However, grasping the outlook of other financial market participants can improve a day traders results, if they put effort into perspectives and apply this to their risk taking tactics.

postN36.1

Anxiety and Surprising U.S Data for Day Traders to Consider

Anxiety and Surprising U.S Data for Day Traders to Consider

Global central banks stayed in their anticipated lanes last week as the Fed and ECB raised their key lending rates. The BoJ has admitted it is allowing its yield curve to increase, meaning the Japan government is cutting back on purchases of Japanese bonds. Forex produced anxiety and choppy results for day traders.

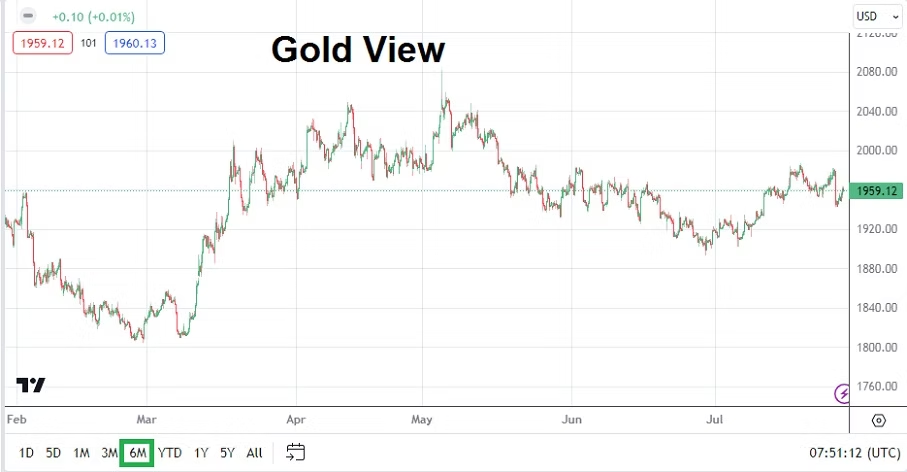
Gold 6 Months Chart as of 30 July 2023

Economic data from the U.S last week provided a strong Gross Domestic Product result on Thursday, and followed with weaker than expected Personal Consumption Expenditures and Personal Income statistics before going into the weekend. Meaning the U.S economy appears to be surprisingly solid, while inflation pressures do indicate they are in decline. The Forex market turned volatile on Thursday and Friday, gold which traded at nearly 1980.00 USD on Thursday went into the weekend near 1959.00.

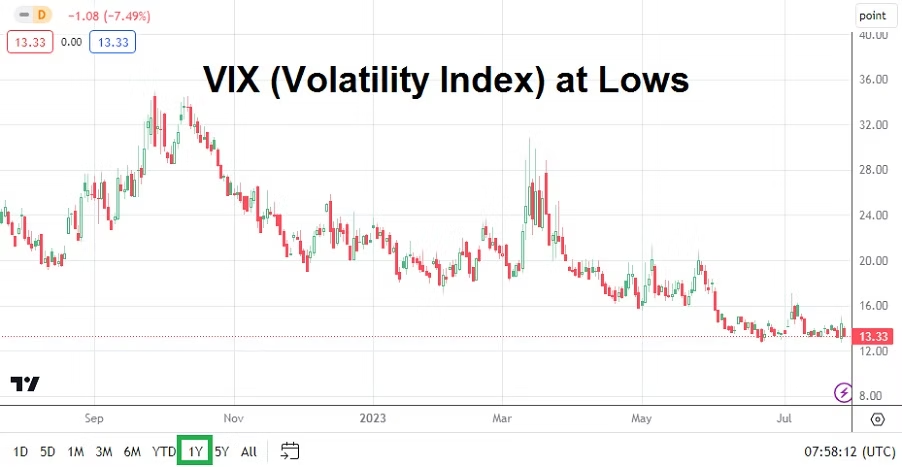
VIX Index 1 Year Chart as of 30 July 2023

Stock markets in the U.S via the major indices continue to incrementally rise and folks waiting for a big sustained selloff are having their patience tested. Perceived volatility in U.S markets is very low and the VIX (Volatility Index) indicates many investors are not taking the time to hedge with options because their confidence is remarkably high. A cautious reminder for traders, one bad day could change all of the optimistic sentiment.

In the cryptocurrency world, folks should continue to keep their eyes on the Binance exchange and its Binance coin. Many digital assets seem to be suspiciously close to important support levels as this week begins and appear vulnerable.

Monday, 31st of July, China Manufacturing PMI – while U.S data surprisingly improves, China has not begun to show signs of a positive turnaround quite yet, and this reading is expected to be below last month’s outcome. China data is a solid barometer of global economic health and traders should give these results proper attention.

Monday, 31st of July, E.U Consumer Price Index Flash Estimates – the European CPI numbers are expected to come in slightly below the previous month’s reading. If for some reason these inflation numbers are higher than expected, this could cause some chaos briefly for the EUR/USD. A weaker number however offers no sound wagering basis for short-term day traders either. Behavioral sentiment appears to be ruling the EUR/USD landscape for the time being, and technical levels should be watched.

Tuesday, 1st of August, Australia Reserve Bank Cash Rate – the RBA is expected to follow in the footsteps of the Fed and ECB and raise its lending rate by 0.25%.

Tuesday, 1st of August, E.U Manufacturing PMI – Germany and France are anticipated to produce similar results to last month’s outcomes. Recessionary pressures are a concern in the E.U and better than expected numbers would be welcomed, but this may prove difficult to demonstrate as economic conditions remain challenging.

Tuesday, 1st of August, U.S ISM Manufacturing PMI – the results from the manufacturing sector in the States should be watched. A slight improvement is expected, but the reading is not expected to produce a wildly optimistic result. An outcome which slightly beats expectations, but is not too strong might make the USD slightly weaker. Global investment institutions are likely hoping for any signs that the Federal Reserve will have to become less aggressive. A lackluster to ‘fair’ ISM Manufacturing PMI result could be evidence larger Forex traders want to see if they are aiming for bearish momentum in the USD.

NZD/USD 3 Months Chart as of 30 July 2023

Wednesday, 2nd of August, New Zealand Employment Change – the jobs statistics are expected to show slightly weaker results from the nation. The NZD/USD remains within the lower elements of its long-term price range. There are many NZD/USD bullish traders waiting for a sustained reversal higher, but it is unlikely to be produced from these New Zealand jobs numbers.

Thursday, 3rd of August, U.K BoE Monetary Policy Summary and Official Bank Rate – the Bank of England remains in a difficult spot and it will likely raise interest rates by another 0.25%. Criticism of the Bank of England has been loud in Britain, but the BoE likely feels it has to remain in line with the Fed and ECB. Recessionary pressures continue in the U.K and inflation remains problematic. Concerns will be heard regarding property mortgages for home owners if the BoE hikes. The GBP/USD will certainly move depending on the rhetoric from the Monetary Policy Summary and talking points delivered by BoE Governor Andrew Bailey.

Friday, 4th of August, U.S Non-Farm Employment Change and Average Hourly Earnings – the jobs data parade will climax at the end of the week, this after starting on Wednesday via the ADP jobs numbers. Investors will watch the Non-Farm Employment Change data carefully and correlate them to the better than expected GDP results from the 27th of July. The wages data from the Average Hourly Earnings is expected to come in with a slight decrease. A weaker inflation result from the wages statistics could cause additional softness in the USD. However, recent data from the U.S has been hard to predict correctly, and day traders may want to sit on the sidelines until all the jobs numbers are digested.

postN34

USD/INR: Consolidation Might Come to an Abrupt Conclusion

USD/INR: Consolidation Might Come to an Abrupt Conclusion

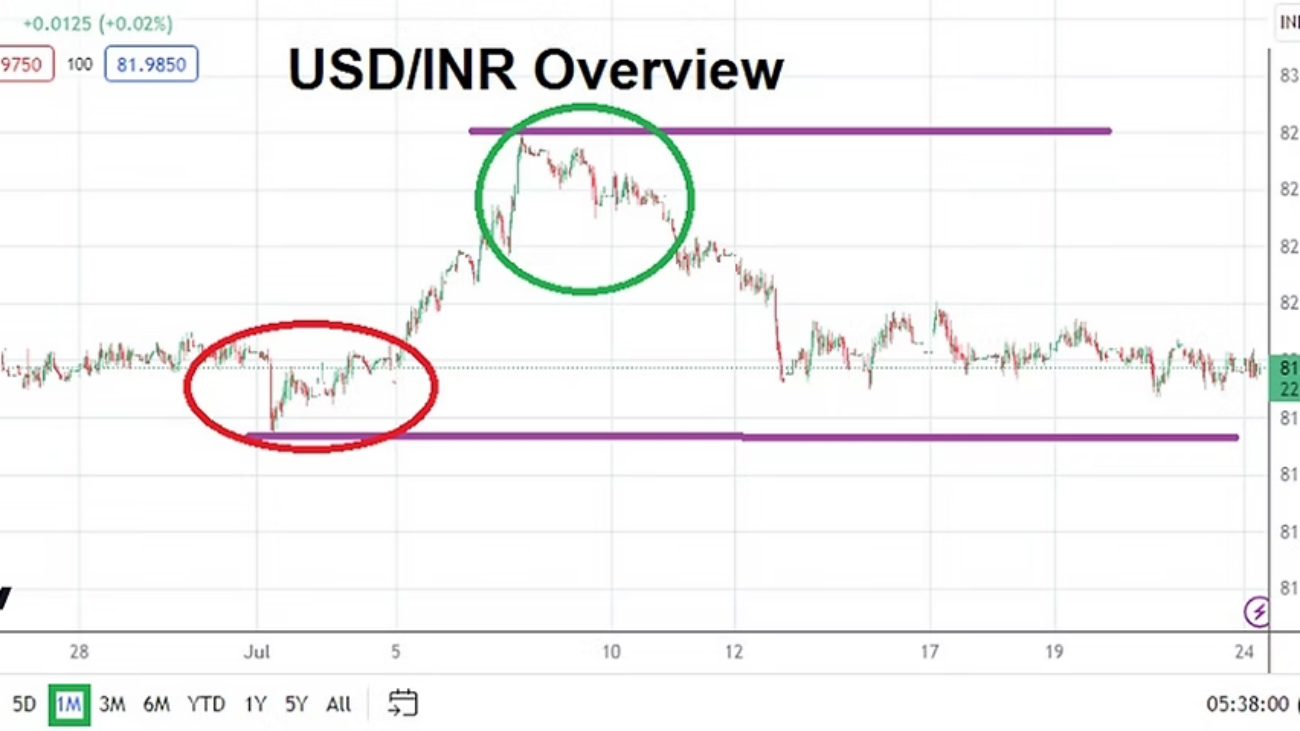
The USD/INR is trading near the 81.9750 ratio as of this writing and its price action since the 13th of July has produced a tight price range. On the 12th of July the USD/INR was trading around the 82.3000 region, this after being able to incrementally decline when a high of nearly 82.7900 was reached on the 6th of July.

Prior to the apex value of July, the USD/INR had traded in a rather consolidated mode from the middle of June until the first few days of July, essentially within a price realm the currency pair now lingers. Speculators must constantly fight the slightest of reversals if they are using too much leverage, but the USD/INR over the mid-term has produced interesting behavioral sentiment and this can be seen on technical charts.

While day traders may believe the current price ratios will hold and the potential interest rate hike from the U.S Federal Reserve has been digested into the USD/INR for this coming Wednesday, they might want to reconsider their thinking. No, the world is not coming to an end, Forex has dealt with U.S central bank decisions before and experienced traders understand the sudden potential of the USD/INR changing direction. The rather tight price range of the USD/INR could vanish in the coming days if the Federal Reserve begins to change their tone within the FOMC Statements.

USD/INR One Month Chart as of 24th July 2023

U.S Federal Reserve is Likely to Raise the Federal Funds Rate but Perhaps Shouldn’t

The USD/INR may not get hit too hard when the U.S Federal Reserve delivers the anticipated 0.25% addition to the Federal Funds Rate. However, the FOMC Statement which talks about the Fed’s outlook might cause a change to what have been calm seas recently in the USD/INR. Recent U.S economic data has been rather troubling, but inflation does actually seem to be creeping lower. The Fed has been pretty adamant in their recent ‘whispering’ about raising interest rates in July, and the potential of raising again later this year.

Time for the U.S Federal Reserve to Start Sounding Dovish

Yet, recent data suggests the Fed should likely not even raise rates on the 26th of July and continue its pause. But having expressed plenty of verbiage on the subject, the Fed may not want to surprise financial institutions and may have to raise, even if they do not really have to this week. And here is where it gets interesting – the FOMC Statement may have to express this notion of becoming more dovish. Think of this potential hike to the Federal Funds Rate this week as the last dose of medicine for a patient who already feels better, the doctor (the Fed) is insisting that to make sure the ‘sick’ is cured another teaspoon consisting of an interest rate hike is necessary.

If the FOMC Statement sounds more dovish than expected the USD/INR might start to see selling ignite and a downturn generate. There are no guarantees and certainly the Fed’s actions this coming Wednesday are not known. Yet, if the Fed hints that it will not raise interest rates over the mid-term and wants to see if inflation continues to lower that it may consider the potential of no more hikes, the USD will start to get weaker across the board. In other words, this last dose of medicine from the Fed may give them the feeling to tell the patient (U.S economy) that they no longer need to visit the doctor’s office for a while.

Other central banks are watching too. Inflation in Europe and elsewhere remains high. The complications of weaker domestic currencies against the USD have hit many economies including India where inflation has been rather strong. If the Fed can now start to become less aggressive, the effect will be quick and start helping the USD/INR trade lower if healthy economic mechanics allow this to happen.

Support levels for the USD/INR near 81.8000 to 81.7500 should be watched, if these levels begin to see challenges and sustained prices remain nearby, the USD/INR may be signaling that another downturn is about to happen. If the U.S Fed delivers a cautious, but more optimistic FOMC Statement this coming Wednesday, the USD/INR may deliver a new cycle of selling.

postN31

China and U.S Data Early and Important as Central Banks Fret

China and U.S Data Early and Important as Central Banks Fret

Monday, 17th July 2023, China GDP and Industrial Production – the economic numbers coming from China have shown steady signs of a downturn. Gross Domestic Product figures however are expected to increase this month, but some analysts may question transparency issues regarding the reported statistics. Industrial Production numbers are expected to fall, which on the surface may cause people to question any positive results from the GDP. Retail Sales will also be published on Monday. The housing market in China remains critically important in the nation and some borrowers appear to be suffering financial stress. While many global retail traders might not be invested in China, the nation serves as a good barometer for the world’s economy, particularly regarding consumer demand.

Monday, 17th July 2023, U.S Empire State Manufacturing Index – the New York based report is expected to have a negative reading. It should be noted June’s data came in stronger than expected. Another positive surprise outcome would continue to show economists are finding it difficult to gauge the U.S economy. Last Friday’s solid Consumer Sentiment reading from the University of Michigan highlighted the rather complex results from the U.S, weaker than expected inflation numbers are also factoring into a muddled sentiment. However, the Federal Reserve is still believed to be leaning towards another interest rate hike on the 26th of July. Day traders should remain alert.

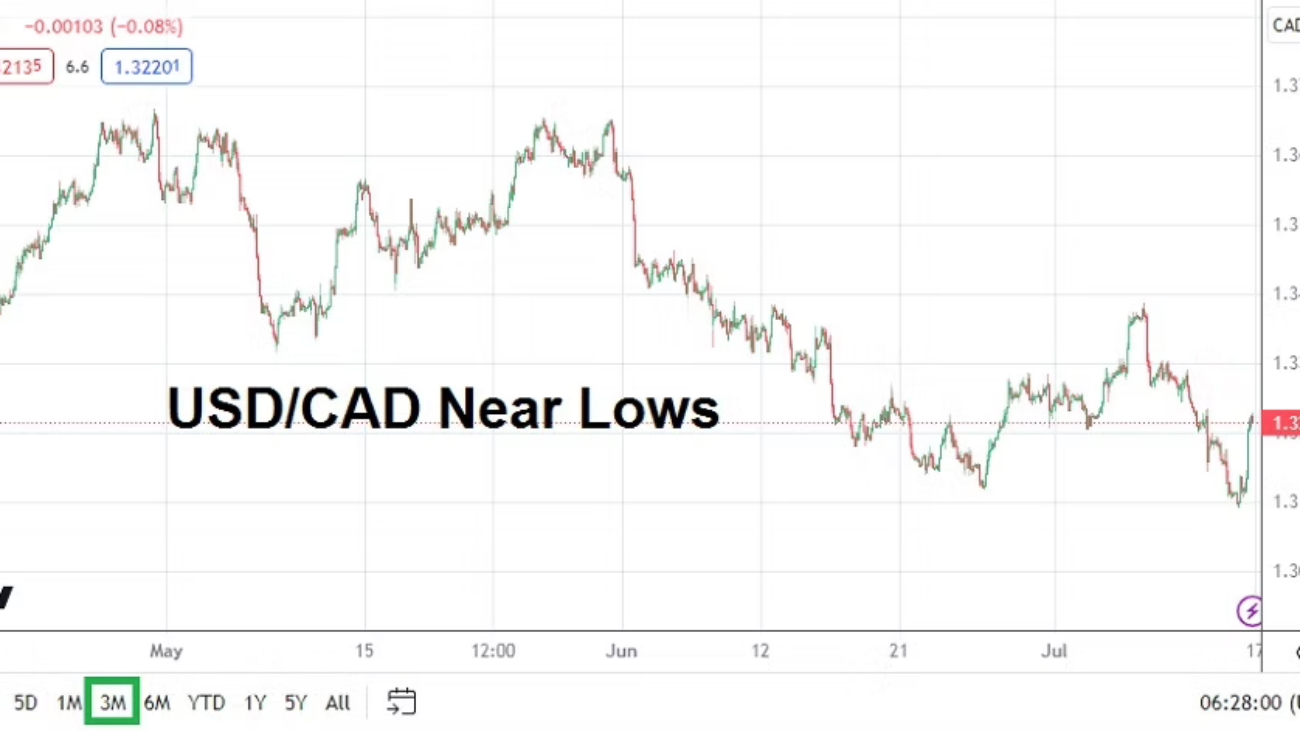
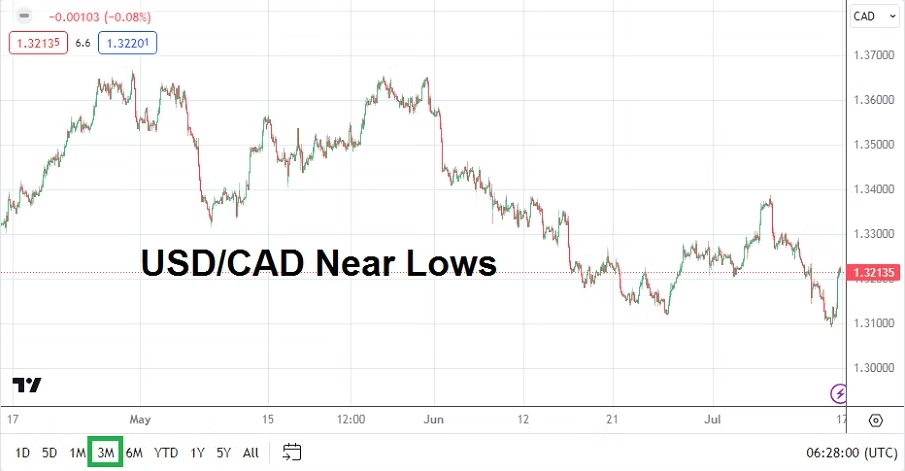
USD/CAD 3 Month Chart as of 17th July 2023

Tuesday, 18th July 2023, Canada Consumer Price Index – the inflation numbers from Canada are expected to show a slight decrease in the velocity of rising prices. The numbers are likely to affect the USD/CAD which is trading near lows last challenged in September of 2022.

Tuesday, 18th July 2023, U.S Retail Sales – considering last week’s improved Consumer Sentiment numbers recently from the States, demonstrating better retail results compared to last month will not be a surprise. Earnings season on Wall Street gets underway this coming week and solid Retail Sales numbers may help mid-term outlook regarding equities. However, behavioral sentiment is fragile.

Wednesday, 19th July 2023, U.K CPI – the inflation numbers from Britain are expected to show a slight decrease in the rate of price expansion, but any result above 8% via the broad data will not make many folks feel better. GBP/USD speculators should monitor the reports.

Thursday, 20th July 2023, U.S Existing Home Sales – the rising costs of mortgages in the States is having an effect on the marketplace. Signs of stress in housing is an intriguing barometer regarding the outlook for the American economy. Better Consumer Sentiment and Retail Sales mixed with less than glowing numbers from the housing sector could make for a troubling diet for traders to consider and act upon.

Friday, 21st July 2023, U.K Retail Sales – recessionary results are shadowing Britain. Poor results from the retail sector would not help behavioral sentiment, particularly if inflation numbers have continued to show they are unrelenting two days before. The Bank of England is in an uncomfortable spot, this as the GBP/USD trades near highs it last saw in April of 2022.

postN30.1

Summertime Behavioral Sentiment Game: Who Do You Trust?

Summertime Behavioral Sentiment Game: Who Do You Trust?

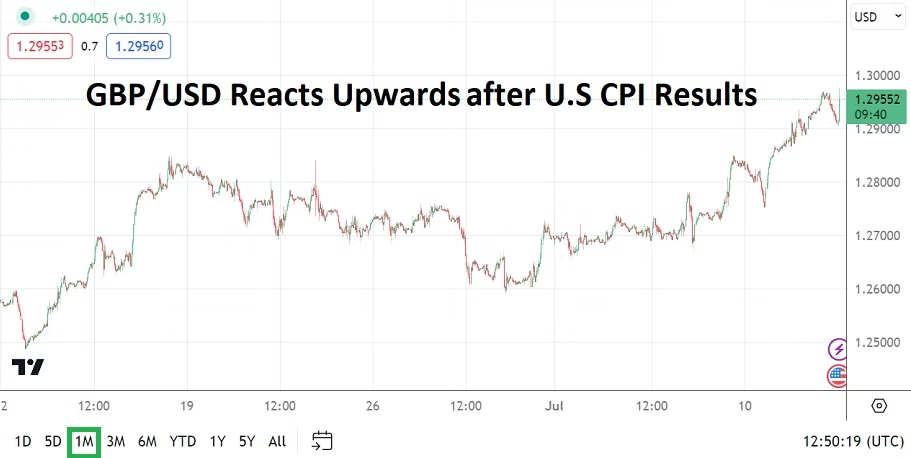
Have we started to reach a polite equilibrium within Forex, gold, equities and bonds for a moment? U.S CPI data just came in below expectations, the decrease of inflation pressures in the U.S will be welcomed. Price ranges are starting to show signs of polite trends in Forex and equities – there seems to be a recognition of basic ideas which are perhaps serving as factors that are ‘accepted’ in the broad markets. Please do not close your eyes for long, because conditions can change in a moments notice, but for the moment the USD is weaker.

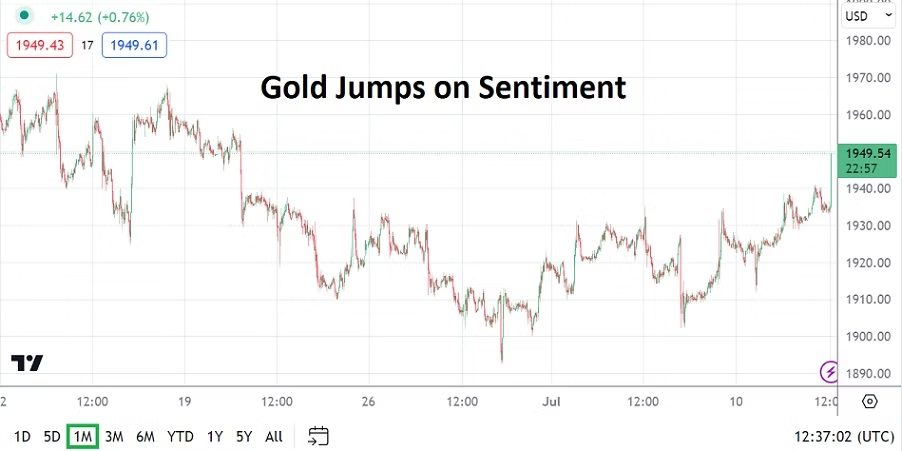
Gold One Month Chart as of 12th July 2023

The Federal Reserve could still raise its Federal Funds Rate at the end of July, though today’s CPI data outcome will create headwinds against that notion. There has been a wide voice given by folks who say the Fed shouldn’t raise rates again, and that real inflation will start to come down and that it is doing so now. The CPI has shown a decrease in U.S inflation – a larger drop than anticipated, which will certainly spur on USD weakness today. This confirms – momentarily – many analysts inflation outlooks who work in financial institutions not related to the U.S Federal Reserve and have been saying price pressures will recede. Yet, inflation is not dead yet and may still be heard. Stagflation is a genuine concern.

Tomorrow’s U.S Producer Price Index will be another opportunity to stir sentiment. Remember folks, outlooks are often adjusted according to facts. But what are facts? Can we really trust them. What are leading indicators, what is data that looks forward instead of backwards – numbers are often offered as evidence but randomness often rules interpretations of data. How do acceptable outlooks really develop when data management and outlooks can change within split seconds depending on the team looking over the quantified math. Humans are naturally optimistic, even when the data is negative, this can lead to bias.

We are in an age when trading software is doing a majority of the large volume transactions, and has been coded by algos processed by quant teams in financial institutions. Do retail traders even have a chance in this type of environment? Yes, retail traders can still manage to find opportunities, but they need to combine technical perceptions with fundamental knowledge of data, and combine the two into a behavioral sentiment outlook depending on their time horizons.

Market dynamics and situations change a lot in the broad markets. Assets move depending on the bias of incoming data. Preconceived notions being acted on and then changing according to need can be done in microseconds because of existing trading technology that financial institutions use. Larger players have an advantage and they are not about to give this up. Timeframes are also different for big trading houses compared to small speculators. It is also important to stress institutional traders could care less about day traders in Forex.

GBP/USD One Month Chart as of 12th July 2023

We have finished nearly a month of summer trading and seem to be confronted by a question of who do we trust? Do we trust the U.S Federal Reserve and its decisions and outlooks? In my opinion, you shouldn’t. But you should also remember the old adage, do not fight the Fed. The U.S central bank is bigger than you and I.

Central banks work together and often coordinate their combined outlooks, while shadows cast from the ‘oversight’ of political leaders rhetoric are frequently given consideration by the Fed, BoE, ECB and BoJ officials even if they claim they are not listening. Inflation is not welcomed by central banks, but because they are largely reactive and not proactive the Fed and others sometimes look uncaring and like fools, while the public sometimes suffer.

Thus we sit and wait for central bank pronouncements, but for the moment we seem to have a good grasp regarding what they will say. And perhaps – for the moment, maybe that is why Forex, gold and equities are trading rather politely. We seem to think we know what is going to be said moving forward for the next few weeks and remainder of the summer – more of the same warnings and interest rate correlations sprinkled in via central bank diatribes.

postN29

Ten More, OK, Now Twenty, Finish Thirty, Next Run the Hill

Ten More, OK, Now Twenty, Finish Thirty, Next Run the Hill

Book Corner: Living with a Seal: 31 Days Training with the Toughest Man on the Planet, written by Jesse Itzler

Living with a seal | Jesse Itzler

We all have had days where we couldn’t get out of bed to exercise, whether it be going for a morning run or hitting the gym at opening time. What would you do if you had a former Navy SEAL living with you and training you twenty-four hours a day, seven days a week for an entire month? And with the agreement that you had to do everything he said – every gym rep, every run, push-up, pull-up and burpee?

In Living with a SEAL: 31 Days Training with the Toughest Man on the Planet, a true story, that’s exactly what happened to author, former rapper, and entrepreneur (part owner of the NBA’s Atlanta Hawks) Jesse Itzler.

Itzler met the SEAL at an ultramarathon where the latter dominated. Itzler refers to the man only as “SEAL” and never reveals his identity, although it has become known since the book’s publication and SEAL has become a well-known fitness celebrity and author in his own right. Impressed by his astonishing physical shape, steely-eyed grit and laconic demeanor, Itzler inked a deal for SEAL to move into the Manhattan apartment where he lived with his family and train him for one complete month in the only way that SEAL knows – hard and nasty – where your limits are constantly pushed to the maximum.

Despite being a fitness buff, Itzler is yanked out of his comfort zone and challenged from day one. This begins a month of exercise sessions on a level that Itzler previously never experienced, such as grueling runs in and around Central Park with endless hills and thigh-splitting sprints in the frigid NYC winter. Other times, SEAL would command Itzler to do endless sets of upper body work comprised of weights, machines, and military-style calisthenics, sometimes on a moment’s notice or little to no sleep. And with SEAL, failure was not an option.

Itzler kept a diary during this month and the book is formatted as such. Additionally, each chapter begins with a SEAL quote. One of my favorites was, “you can get through any workout because everything ends.” And then there are thoughts on people and interaction gems like, “I don’t like to talk to strangers. Actually, I don’t like to talk, period.”

Despite the tortuous sessions that he endured, Jesse Itzler relates it all with humor and of course pride: his fitness level improved tremendously. He treats SEAL with great respect and admiration, something that we, as readers will share. SEAL comes across as a man of integrity who is true to his word. And how can one not admire a man who talks little, eats little, needs very little to get by in life, and runs in five-degree Fahrenheit weather wearing only gym shorts and a T-shirt?

The book is quick, light, and enjoyable. It’s also quite motivating. After reading it, you’ll be laying out your running clothes and setting your alarm clock for five in the morning.

If you want to read another Book Corner article, please visit this review by Evan Rothfeld: https://www.angrymetatraders.com/post/the-despair-of-ice-and-ability-to-lead-people-through-storms

postN28

Week Ahead: Inflation will be the Crucial Word for Investors

Week Ahead: Inflation will be the Crucial Word for Investors

Last week finished with another reminder that inflation cannot be easily scoffed at by investors who continue to believe higher prices will eventually slowdown. Average Hourly Earnings last Friday came in above the expectation and this was enough to rattle Wall Street again, which saw the major equity indices decline and bond yields incrementally rise. Inflation ‘talk’ will remain important this week because of coming U.S data.

Real Estate including REITS becoming a Topic of Discussion as Mortgages Rise

Market watchers should also pay attention to news regarding mortgages on residential homes, and listen for troubles from the commercial real estate market, as these sectors deal with rising interest rates in the U.S and U.K. Increased nervousness within these markets could have an affect on behavioral sentiment. Let’s remember the catalyst for the financial crisis of 2007 was the real estate sector.

Which brings us back to inflation and the growing acceptance among investors the U.S Federal Reserve may be ‘forced’ to hike the Federal Funds Rate on the 26th of July, if price data continues to come in ‘hot’. Some investors will likely be heard saying an increase of 0.25% has already been factored into marketplace, but the prospect of another hike in late 2023 could be problematic. Forex, gold and bonds dynamics will tell us a lot when this week concludes regarding outlooks.

BNB/USD Price Should be Monitored as Binance Trembles

An outside source of financial and speculative news is likely to come from cryptocurrency. If you are gambling on this asset class (or should we say commodity based on hot air) and like the adventure of wagering, please continue to pay attention to Binance which is showing signs of duress. If the Binance cryptocurrency exchange shows additional signs of pressure on its BNB (Binance Coin), trading waters within the world of crypto could trigger additional drowning victims. If you thought the Sam Bankman-Fried story made interesting news last year regarding fraud and other criminal activity, the FTX saga could prove to be only the tip of the iceberg.

Data Events Ahead to Watch

Monday, 10th of July, China CPI and PPI – the inflation data could prove important for investors who correlate economic statistics from China into their global forecasts. Traders within India should pay attention to these Chinese price reports, because global investors are starting to shift their assets into the Nifty 50 and other NSE equities because of risk and reward equations.

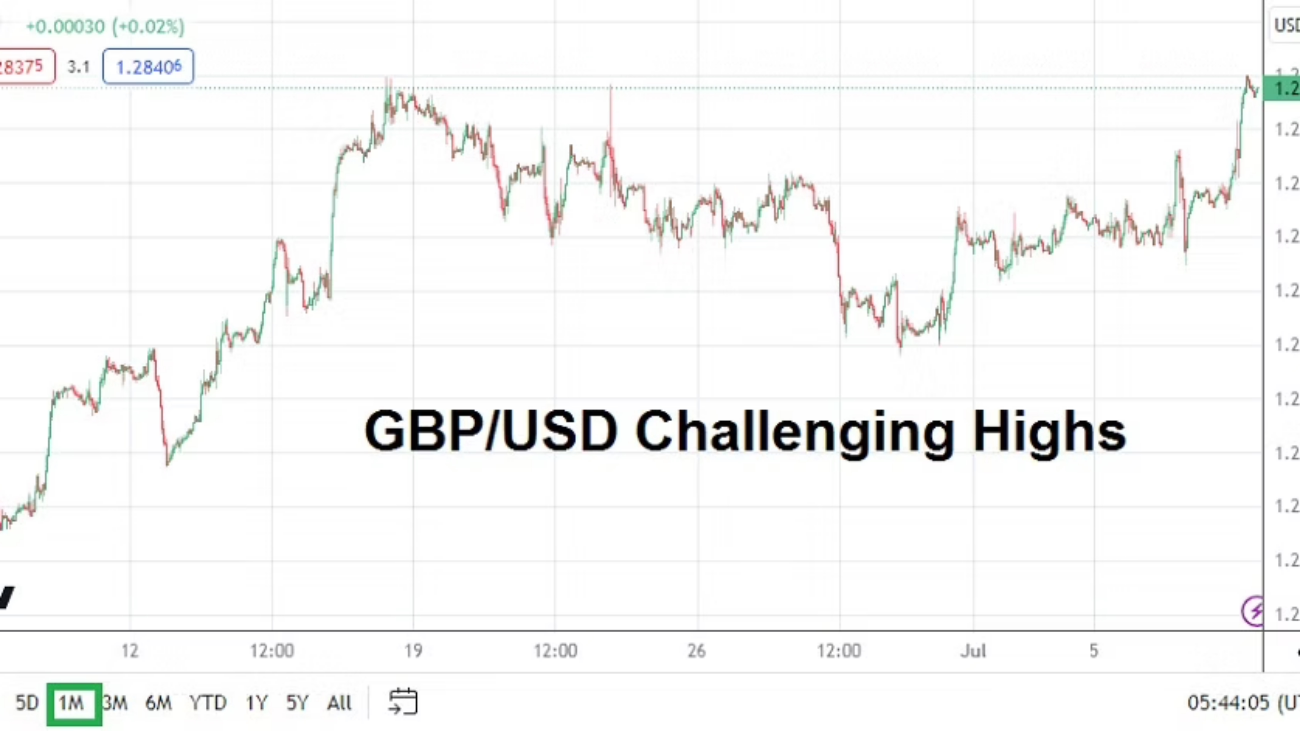
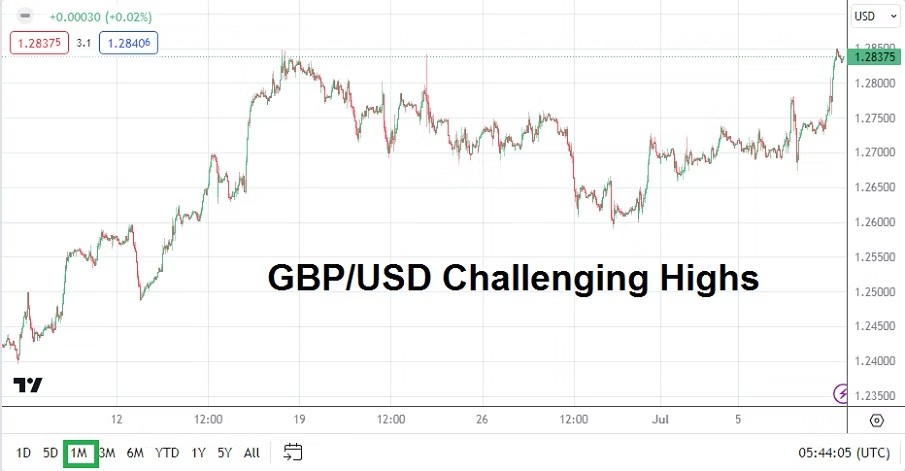
GBP/USD One Month Chart as of 9th July 2023

Tuesday, 11th of July, U.K Claimant Count Change and Average Earnings Index – the numbers need to be watched by GBP/USD speculators. The results from the U.K will be intriguing because of employment results, but more importantly for inflation concerns and the knock-on effects. Bank of England Governor Andrew Bailey is speaking a few times this week, and this includes Wednesday the 12th of July, when he will talk about the Financial Stability Report. The GBP/USD has moved towards monthly highs recently.

Wednesday, 12th of July, New Zealand RBNZ Official Bank Rate – NZD/USD day traders will want to pay attention to the central bank’s Rate Statement. While no increase of interest rates is predicted, the Reserve Bank of New Zealand at a minimum will likely have to admit inflation remains a concern.

Wednesday, 12th of July, U.S Consumer Price Index – the inflation reports from the States will have all eyes on the outcomes of the monthly and annual comparisons, including the Core numbers. The results from these inflation statistics will certainly cause momentary volatility within Forex with the USD as the focal point.

Wednesday, 12th of July, Canada BoC Overnight Rate – the Bank of Canada is expected to hike its interest rate by 0.25% to the 5.00% mark. USD/CAD will react to the BoC Rate Statement based on its outlook.

Thursday, 13th of July, U.K Gross Domestic Product – the ‘growth’ numbers are not expected to be positive. A drop of minus -0.3% is the expectation. Talk of recessionary pressures in Great Britain will be heard. Unfortunately, the discussion about a struggling economy, mixed with stubborn higher prices for consumers and mortgage rates that are rising will not make for calm stomachs. U.K equity results via the FTSE 100 Index should be monitored.

Thursday, 13th of July, U.S PPI – the Producer Price Index figures will be the last cog within the important inflation data for the week. Stubborn prices for wholesale goods are a concern, because the costs to consumers becomes more expensive when there are higher price pressures.

Friday, 14th of July, U.S Consumer Sentiment via the University of Michigan – if the Consumer Sentiment readings from the UofM report improves, and the U.S inflation data which was released earlier this week has proven stubborn, this could become a source of pain for investors who may be forced to consider the Fed will not only raise the Federal Funds Rate late July, but later in 2023 also. Short-term traders should monitor this report accordingly.

postN26.1

USD/INR: Bounce Higher Ignites a Return to High Water Values

USD/INR: Bounce Higher Ignites a Return to High Water Values

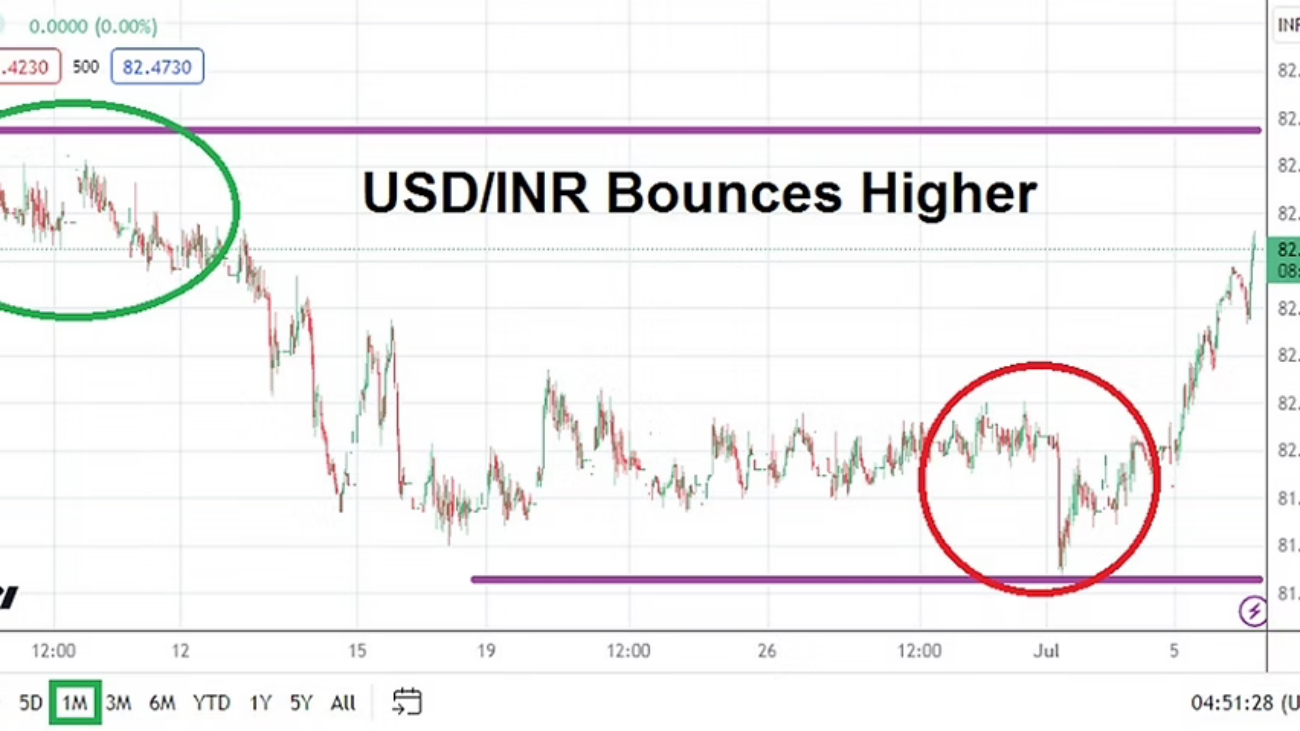
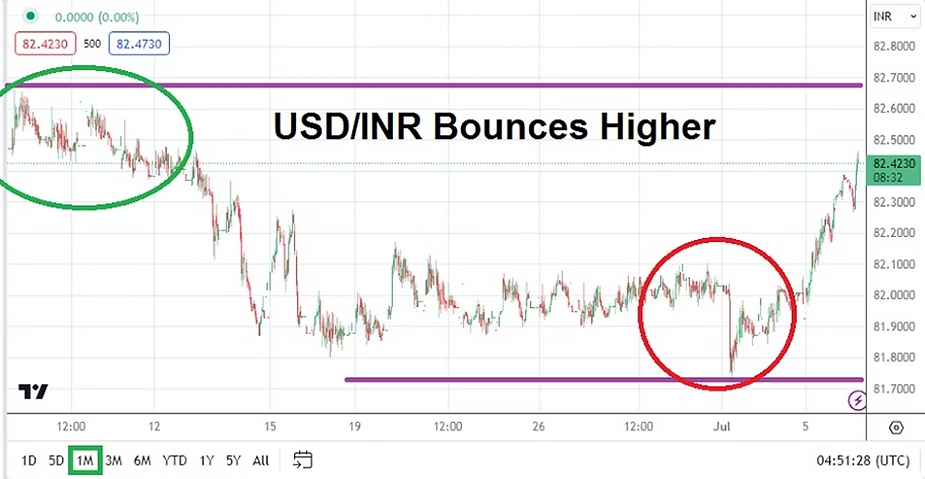
The USD/INR is trading near 82.4350 as of this writing, which is a value the currency pair has not touched since the second week of June. While some analysts may say the move to higher ground yesterday and early this morning is based on the U.S FOMC Meeting Minutes, Wednesday’s report from the Federal Reserve likely only reinforced the bullish momentum which started earlier this week. The world of Forex can feel fickle, particularly when so many of the internal dynamics are hidden from a large segment of people who are trying to speculate on the results.

If the mechanics of the move higher which started on Monday are examined a couple of points should be considered closely, the low of the USD/INR was around 81.7300 on the 3rd of July. This low took place as most U.S financial institutions were on holiday in preparation for Tuesday’s 4th of July celebrations.

Fears of U.S Economic Prospects: Behavioral Sentiment and Stagflation Potential

The reversal higher since the 3rd of July has been pronounced, but before going into last weekend the USD/INR was largely trading within a consolidated manner near the 82.0000 level with a test of this mark having been displayed forcefully since the middle of June. A range of nearly 81.8500 to about 82.1500 largely has played out the past three weeks of Forex trading.

USD/INR One Month Chart as of 6th July 2023

Monday’s dip in value to lows around 81.7300 took place when there was very little volume in the USD/INR market. The depths challenged marks not seen since the first week of May.

The reversal higher the past few days is certainly part of more transactional volume starting to be pumped into the USD/INR as U.S financial institutions have returned, but they are also likely being caused by an underlying nervousness within the Forex markets which may be factoring in the notion the U.S Federal Reserve seems to be on a path which will increase the Federal Funds Rate on the 26th of July.

The behavioral sentiment being generated regarding a Federal Reserve which stays in an aggressive stance started before yesterday’s release of the FOMC Meeting Minutes. Nervous conditions have been on the surface of the broad markets because U.S inflation remains rather resilient – but also importantly because last week’s Gross Domestic Product numbers published on the 29th of June, came in stronger than anticipated. From a troubling perspective some analysts could point to the moderately improved growth and combination of stubborn inflation as a sign stagflation is starting to shadow the U.S, which would certainly be a troubling predicament.

USD/INR Move to New Highs this Morning could Ignite more Nervous Reactions

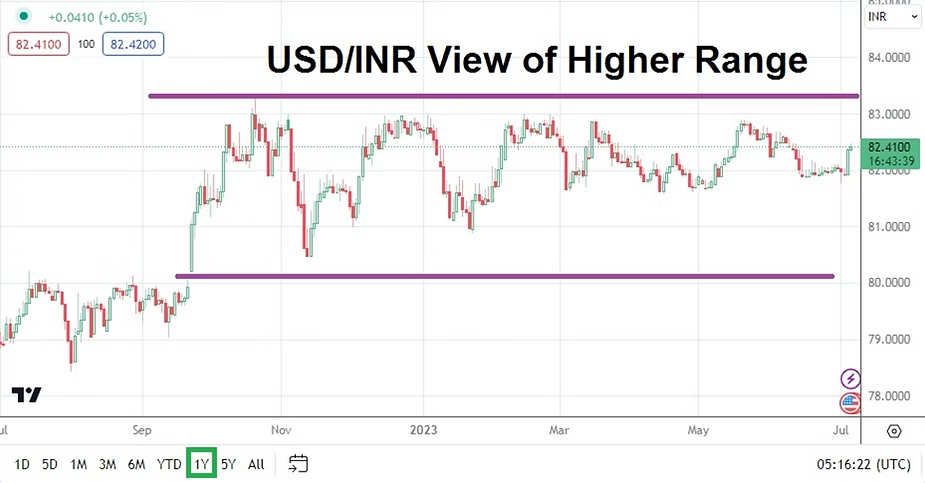
USD/INR speculators may believe the move higher in the currency pair is overdone and that values need to be lower. However, the current price of the USD/INR is one that has been experienced quite a bit since October of 2022. A look at a one year chart shows the USD/INR has returned to higher ratios of its price range which it has experienced since breaking upwards in the middle of September 2022. And to make things more interesting for technical traders, the USD/INR has actually produced a rather stable range between 81.6000 and 82.9000 since February of this year.

USD/INR One Year Chart as of 6th July 2023

While traders are certainly trying to anticipate what will happen next in the USD/INR to gain an advantage, they should remember the currency markets are almost impossible to time on a daily basis, but a look at mid-term prices does offer plenty of insights. If the USD/INR climbs too high, perhaps to the 82.5000 level the Reserve Bank of India could get a bit nervous and consider some type of intervention which it supposedly has done a few times over the past handful of months – but perhaps at higher price ratios.

USD/INR Mid-Term Considerations and the Current Price Range

However it is more cost efficient and reputably less damaging for central banks to not intervene if they do not have to, and simply let market dynamics effectively create a price for the USD/INR based on supply and demand. Meaning the current prices of the USD/INR look to be rather high, but taking into consideration the range of the Forex pair the past five months the values are not new. The prices in fact have been rather established, meaning the USD/INR may trade slightly higher, but then a lower wave of downward momentum could be anticipated.

Day traders who are gamblers may be tempted to sell the USD/INR if the currency pair finds more upwards mobility in the near-term. Trading volumes should be back to normal now that U.S financial institutions have returned from their holidays, and traders should be ready for the potential of fast price velocity developing. Risk management on wagers regarding the USD/INR are essential as always.