Indian Rupee 20260611

India Insider: Should the RBI Raise Interest Rates?

A Case for Higher Interest Rates In India

As the Rupee remains under pressure and oil prices continue to rise amid tensions in the Middle East, the debate has shifted towards what the Reserve Bank of India (RBI) should do next.

Economist Janak Raj has argued that raising interest rates to defend the Rupee comes with significant costs. Higher rates increase the cost of capital for businesses, reduce investment activity, and compress equity valuations. In theory, this could even accelerate foreign outflows from equities rather than attract fresh capital. Yet the RBI may soon find itself with limited options.
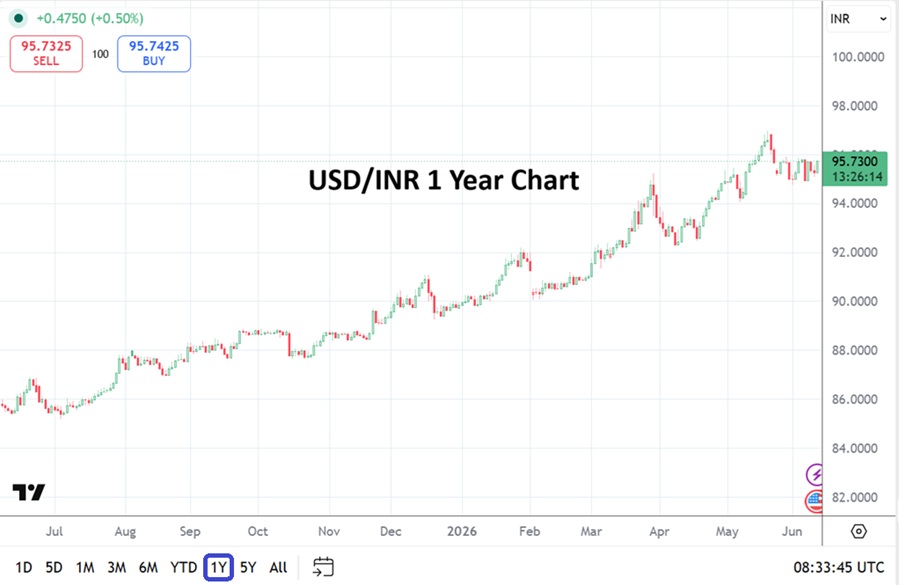
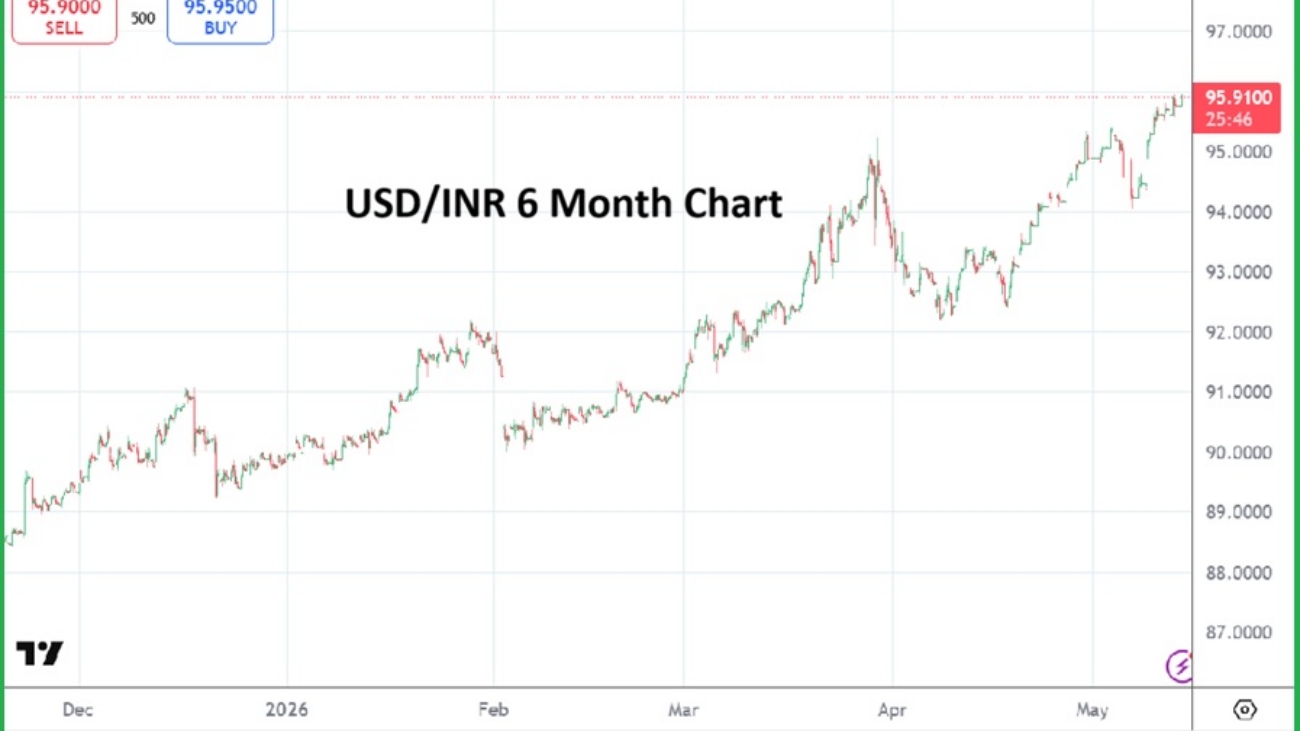
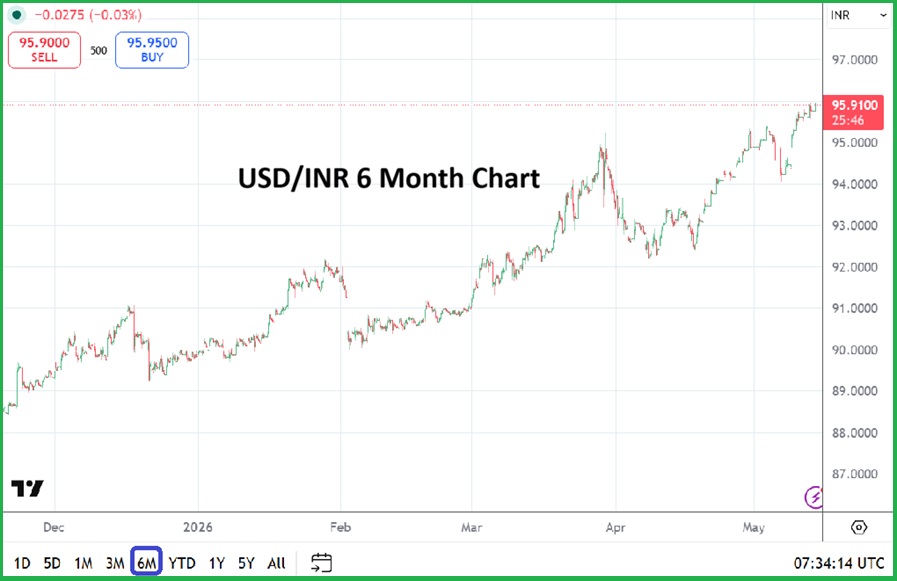
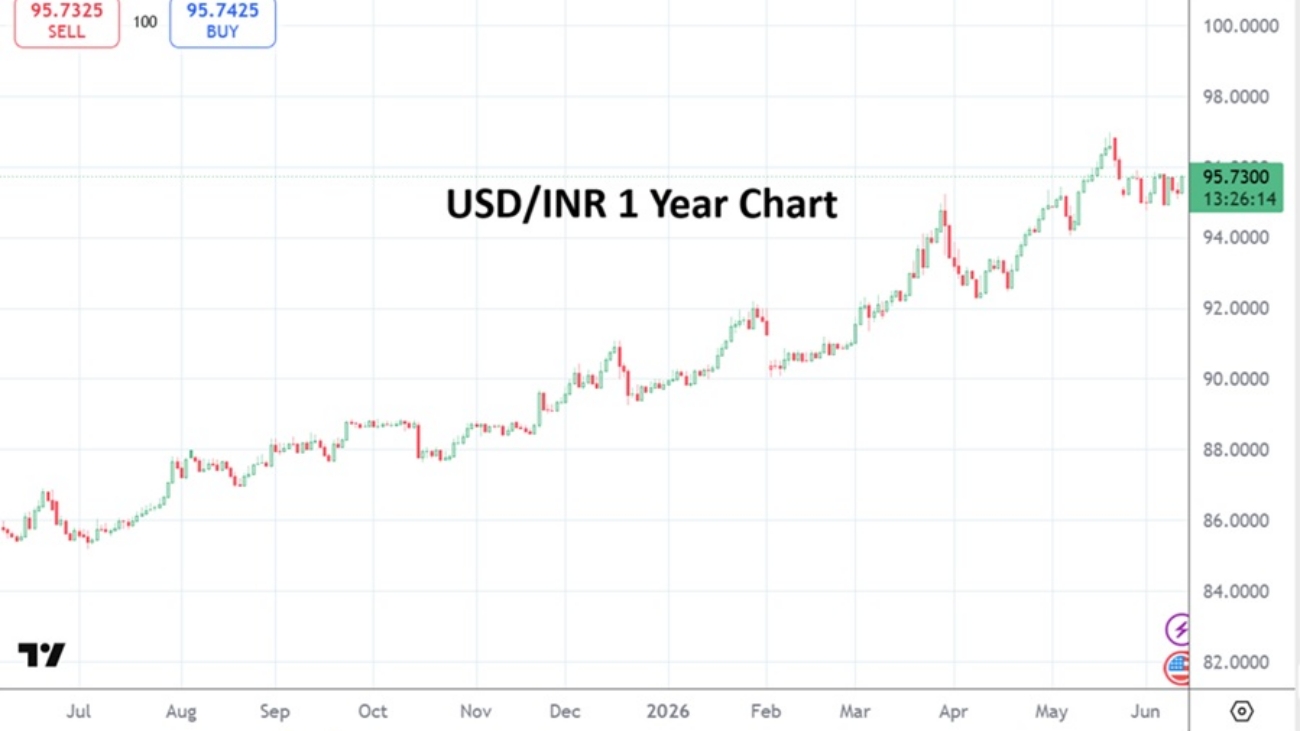
USD/INR One Year Chart as of 11th of June 2026

Foreign Portfolio Investors (FPIs) were net buyers of Indian equities for most of the period between 2004 and 2024, with only a few exceptions such as 2011, 2018 and 2022. However, the trend has changed. FPIs sold approximately $19 billion USD worth of Indian equities in 2025 and another $24 billion USD so far in 2026.

Question: Why are Foreign Investors Selling

One reason is that global investors today have alternatives. The growth of Artificial Intelligence related companies in the United States has created significant investment opportunities. At the same time, U.S Treasury yields hovering around 4.6% offer attractive risk-free returns in a strengthening dollar environment.

For many global investors, earning high returns in Dollar assets is preferable to taking exposure in emerging markets that face current account pressures from rising  Crude Oil prices and other energy costs.

Taxation is another factor. India taxes foreign investors at 20% on short-term capital gains and 12.5% on long-term gains. Meanwhile, competing financial centres such as Singapore, Hong Kong, Malaysia and Thailand generally do not tax foreign investors’ capital gains.

Some global funds have argued that India should move closer to international norms, where capital gains are usually taxed in the investor’s home jurisdiction rather than the country where the investment is made. Higher post-tax returns would undoubtedly make Indian assets more attractive.

A stable Rupee would also reduce hedging costs, lower currency-risk premiums and improve the overall risk-reward profile for overseas investors. However, tax cuts alone cannot solve India’s problem.

The Real Issue is Balance of Payments

As Business Line columnist Lokeshwari Mam has pointed out, a significant portion of equity outflows consists of short-term speculative capital. Long-term capital tends to remain invested. This is why the decline in net Foreign Direct Investment (FDI) should concern policymakers more than short-term fluctuations in portfolio flows.

Net FDI has fallen sharply from $28 billion in FY 2022-23 to just $7.7 billion in the year ended March 2026. This is a worrying trend because FDI is the most stable source of external financing. Unlike portfolio flows, it creates factories, jobs, exports and long-term productive capacity.

India therefore needs more than tax incentives. A genuine single window clearance system, reduced bureaucracy, easier business regulations and reforms in manufacturing remain essential. Attracting long-term capital should be a national priority.

The recent foreign buying of Indian bonds after tax cuts is encouraging. But relative to India’s current account financing requirements, it remains a small drop in the ocean.

For example, in FY 2025, the current account deficit was 0.6% of GDP. And in Q4, the current account became a surplus. Is it really that difficult to finance it’s small current account deficit?

India’s external vulnerability is determined not merely by a current account deficit, but by whether the capital account can be comfortably financed. A modest current account deficit still creates currency pressure if foreign capital inflows weaken (which we are seeing), while a larger deficit may be sustainable when capital inflows remain strong. The risk of sustained higher oil prices could widen the deficit, increasing India’s dependence on foreign capital at a time when global liquidity is tightening and U.S Treasury yields are rising.

Furthermore, hedging costs continue to erode much of the yield advantage that Indian bonds offer over U.S Treasuries. In that sense, active global money is likely to prefer Dollar assets over emerging-market debt or equities

India’s repo rate currently stands at 5.25%. The RBI’s decision to raise its inflation forecast to 5.1%, while lowering its GDP growth projection to 6.6% reveals where the shock from the Iran conflict is likely to be felt via higher inflation and weaker growth. For an economy that remains heavily dependent on imported oil, a depreciating Rupee only compounds the problem by increasing the cost of energy imports. 

In such an environment, the Monetary Policy Committee is unlikely to focus solely on growth. Currency stability, inflation expectations and the availability of foreign capital to finance India’s external requirements could become increasingly important considerations. If these pressures persist, the RBI should raise the repo rate, in the same manner other Asian central banks have done in recent weeks.
Copy and paste the text from AMT that you want to share

Female Work Percents 20260605

India Insider: Growth Matters, Development Matters Even More

Participation of Women in the Workforce and Advancing Progress

There is more poverty in this world than many of us realize and would like to comprehend when confronted by the facts, and this is also true with India.

Recently, I visited several villages in Tiruvannamalai District in Tamil Nadu State on behalf of Angry Meta Traders to survey household capital formation, wage growth and labor market dynamics. To my astonishment, in many homes, people still use rice and palm oil purchased through ration shops. The important observation is their consumption basket appears narrow and heavily dependent on subsidized essentials. I saw simple aluminum utensils in kitchens, when higher income households often use silver-plated utensils. Things that many middle-class families consider normal like energy drinks, snacks, or packaged foods were often absent.

What struck me even more was the number of women managing families alone. In some households, the husbands had died due to excessive alcohol consumption. Children attended government schools and depended on nutritious meal schemes provided by the State.

Growing up, I have seen people wear torn uniforms in school because their family could not afford new uniform every year. Some did not wear shoes, and many students stood outside the class because the fees in private schools in India are several times higher than what government schools would charge and their families could not pay on time. Yet, through education and perseverance, many people have succeeded. 

However, the poverty I witnessed in Tiruvannamalai District is different. These observations reminded me of a study published in the Lancet Regional Health Center. Researchers followed 251 children in Vellore District (closer to Tiruvannamalai District) and found that poor children living in urban areas were often exposed to calorie-rich but nutrient poor food environments.

If such conditions exist in parts of Tamil Nadu State, one of India’s more developed states, then we should think carefully about the situation across the country.

Another Transformation is Taking Place

For generations, many women carried the burden of childcare, household work, elder care and agricultural labor simultaneously. In many families, they sacrificed their own aspirations for others. Are women born to carry everyone’s burden?

Interestingly, across the globe especially in Southeast Asia, education and economic opportunities have expanded women’s choices. Researchers such as Stanford University’s visiting Professor Alice Evans argue that many women choose marriage only when their partner’s own goals align with their own. If not, remaining single becomes a reasonable choice for them

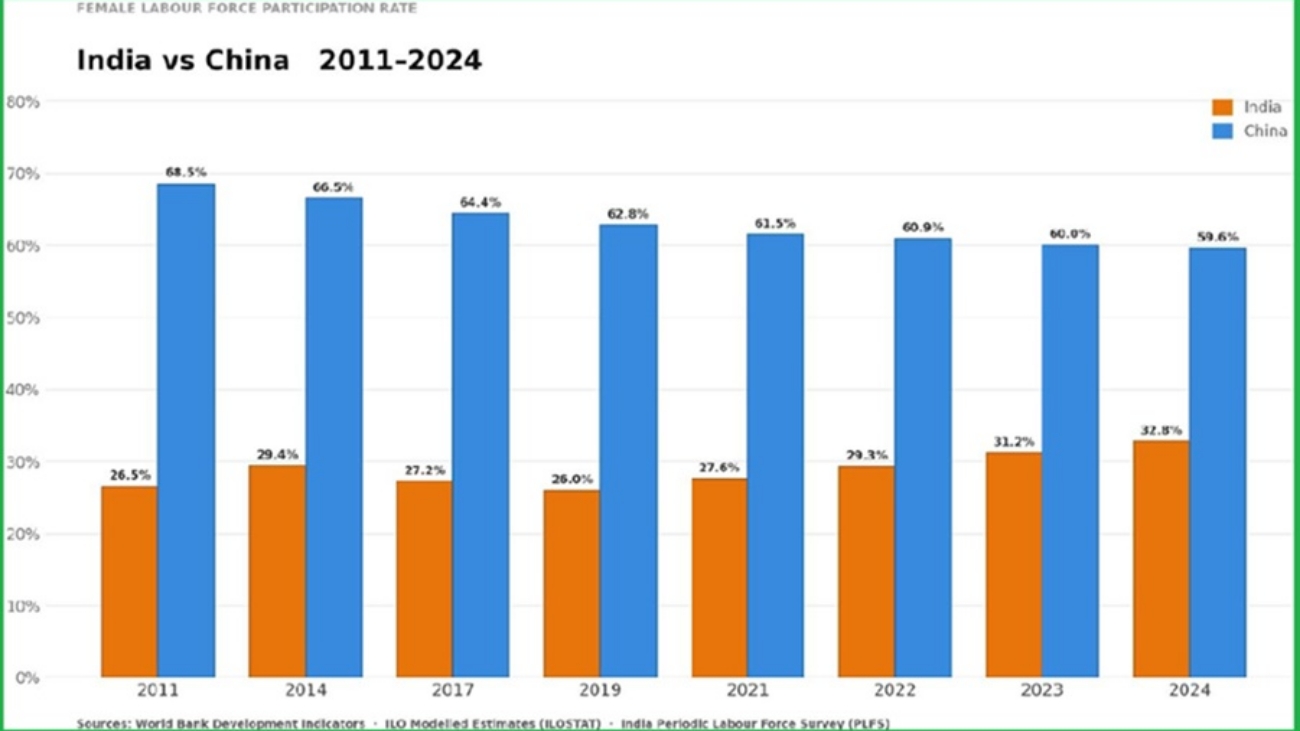
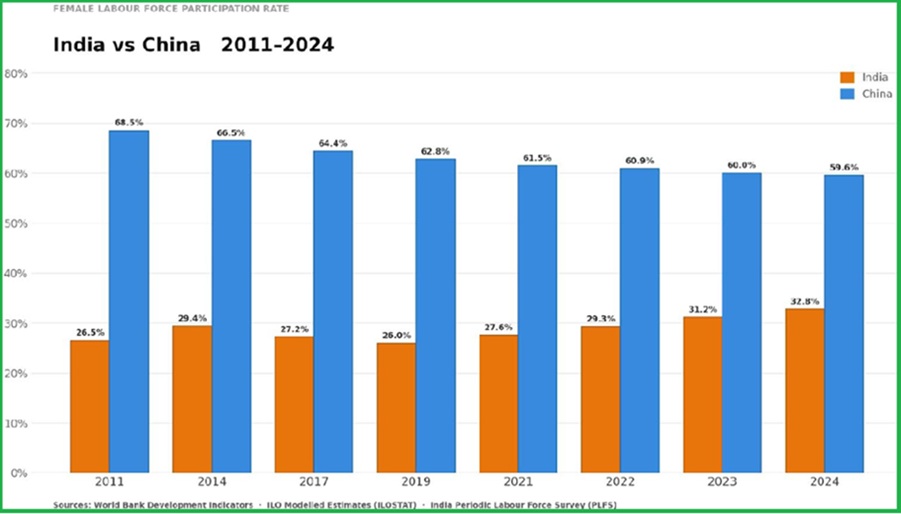
Female Labor Participation Rates Comparing India and China from 2011 to 2024

As shown in the above chart, India has certainly made progress, but female participation in the workforce remains below that of many East Asian economies. A society that fully allows women to participate in economic life is likely to become more prosperous and productive.

Economic realities are also shaping family decisions. Housing is expensive. Job markets are uncertain. Inflation remains a challenge. Asset prices have risen significantly.

Yesterday, a college friend called me. He recently built a new house in his town. He is 33 years old, unmarried, and works in Oman. Years of overseas employment and remittances have helped him to achieve his goals. I sometimes wonder whether the same outcome would have been possible had he stayed and earned entirely in India, especially outside the software and technology sectors.

India still has demographic advantages, but a demographic does not bear fruit automatically. It requires healthy, educated and economically secure citizens.

We often speak about India becoming a developed nation. However, the real question is whether growth can and will improve the lives of ordinary people, especially women, children and underprivileged. Growth matters, development matters even more.

Copy and paste the text from AMT that you want to share

Perception Over Fact 20260603

Perception Over Fact: Iran as the Savior of Beirut

Trump Policy and The Art of a Middle Eastern Deal: Israel, Iran and Lebanon

Opinion: The following article is commentary and its views are solely those of the author. This article was first published the 2nd of June via The Angry Demagogue.

Although it is difficult to see where the negotiations between Iran and the United States are going – if anywhere – over the last 24 hours the United States has made Iran the “savior” of Beirut. Against American policy of creating a civil and unified Lebanon at peace with its neighbors, the Trump Administration has told the Lebanese government and people that Iran still controls what happens in Lebanon.

Perception over Fact: Iran as the Savior of Beirut

Even if this was not the case, in the art of the Middle Eastern deal, perception is more important than fact. Whether the Trump Administration actually twisted Israel’s arm due to Iran’s demands or not, the fact that Israel has agreed not to bomb the Dahiya section of Beirut after announcing that they would gives a message to the Lebanese people and government that Iran still calls the shots in Lebanon and not to rush to support those who wish to disarm or dismantle Hezbollah since you will be on the losing side.

Lebanon has been embroiled in civil wars since its inception. Beirut, the “Paris of the Middle East” has never known quiet times although that did not stop the partying (sort of like Paris itself today) and Iran’s involvement, much like Syria’s and the PLO’s before has not helped. Before the PLO inspired civil war in the mid 1970’s, after King Hussein threw them out of Jordan, the civil wars were about Lebanon itself. The French thought they created a formula for the creation of a semi-western state by dividing up the power centers amongst the religious and ethnic groups – Maronite-Christians got the Presidency, the Sunnis the Prime Minister-ship, the Shiites the speaker of the Parliament. The Druze historically were appointed Chief of the General Staff of the army.

This formula was, as can be imagined, not one for the free exchange of ideas but caused a rush to create power centers and led to conflict, civil and military. But it was all internal. Once the PLO and Yassir Arafat came, Israel became a factor in the civil war since Israel had to cross the border to stop the PLO from its numerous cross border terrorist attacks. After the First Lebanon War and the forced exit of the PLO, Iran created Hezbollah with the sole aim of using it, in the future, to destroy Israel. Therefore, from the late 1970’s until today, the Lebanese state has been embroiled, often against its will, in the Israeli-Palestinian conflict.

The goal of the Trump Administration’s negotiations in Washington between Israel and the Lebanese government is to break Iran’s stranglehold over Lebanese internal and external policy and allow it to either establish diplomatic relations with Israel or at least to put the two countries in the situation they were in before the late 1970’s – and that was a quiet, irrelevant border for both countries.

The real or even perceived notion that Beirut was “saved” from Israeli bombing by Iran’s demands has set back that goal and given Hezbollah and hence Iran, veto power over Lebanese government policy. The correct answer to Iran after their demands were made tying Lebanon to the cease fire was that Lebanon is none of your business and if your proxy decided to join your war then they will have to take responsibility for it. The time for “protecting” Lebanon was when you ordered Hezbollah to come to your aid and attack Israel’s north. The result of that – the administration needs to tell both Iran and the Lebanese government and people, is the loss of Lebanese sovereign territory to Israel and the destruction of Shiite villages in the south of the country. A further price is the destruction of the Beirut neighborhood in which Hezbollah has command and control facilities as well as underground arms depots.

Iran cannot be seen to be the savior of Beirut and Lebanon but the cause of its troubles. No amount of rhetoric to the contrary will prove to the Lebanese government and people what they see on the ground now – only Iran has the power to stop Israel’s bombing of their country. The Administration has set back its goals in Lebanon without aiding its war effort in Iran. The constant Iranian threat to make the war regional is coming true since the Administration is not taking seriously Iranian deal-making methods.

As we wrote two months ago in The Art of the (Middle Eastern) Deal” – “Each ‘concession’ by Iran will have to be paid for twice or three times – once upon agreement and then again before numerous times before implementation”. Iran agreed to open the Straits and then reneged and the US is negotiation for that again – AFTER Iran received the much needed cease fire.

Now, after the administration denied linkage to Lebanon, Iran is again demanding that linkage – not in order to open the Straits, but just to continue negotiations. This pushes both American interests to the back burner – the opening of the Straits of Hormuz and the normalization of Lebanon as a country free from Iranian influence. And the “concession” that Iran is giving for this is just a continuation of the negotiations that have been going on for over two months. In other words, like most negotiations in the middle east that are supposed to lead to “peace” – this too is moving backwards.

President Trump has asked for patience and has insisted that the United States will never accept a bad deal – and I am willing to be patient and believe that. But what if the goal of the Iranian government is not a deal at all but the ability to re-set their genocidal triad or missiles, proxies and nuclear weapons? These negotiations have given them time to dig out their underground missile cities, to keep their enriched uranium hidden and now to revive their flailing major proxy – Hezbollah. In the end, as the President said, it will be good, but by allowing Iran to take the initiative he is making it harder to get to that “good”.

What we have now is a continuation of American-Iranian negotiations where a concession was given to Iran and they are no closer to reaching an agreement. Iran is now perceived as the power to be reckoned with in Lebanon and Israel is put on a level with Hezbollah. Iran and the United States are now equals in this negotiation, something that was not the case when they started. While it might in fact end well, the journey is now a longer and more difficult one. The perception given by the last 24 hours that Iran controls Lebanon, is now the “fact” that the Middle East “knows”.

Disclaimer: the views expressed in this opinion article are solely those of the author, and not necessarily the opinions reflected by angrymetatraders.com or its associated parties.

Follow Ira Slomowitz via The Angry Demagogue on Substack https://iraslomowitz.substack.com/

Copy and paste the text from AMT that you want to share

post277

India Insider: Growth without Prosperity, Thoughts and Comparisons

Growth and Prosperity Data Meet India and China's Realities

Economic growth is important for generating prosperity. India as well as China has helped millions be lifted out of poverty using separate development trajectories. Still, questions about income distribution remain a difficult topic that policy makers in both nations often are unwilling to look at with deeper persistence because plenty of inequalities still exists and the subject remains potentially divisive.

China’s low income population is extremely large. Professor Li Shi’s research argues that nearly 300 million people in China are earning less than 1000 Yuan ($149 USD) per month in 2021, while nearly 98 million had monthly incomes below 500 Yuan ($75 USD).

The same is true for the majority in India. As per the Pahle Foundation research shows nearly 91% of India’s workforce remains in the informal sector where their annual per capita incomes are below ₹2.5 lakh Rupees or ₹20,800 Rupees per month ($217 USD per month).

Although industrial and wage models are different comparatively, for instance in China the industrial sector includes 32% of the total working age population and produces an estimate of 36 to 37% of the GDP. And 22% of China’s workforce are employed in agriculture and produce close to 7% of GDP. In India a higher share of the people are in agriculture – close to 45%, and generate roughly 15-18% of the nation’s GDP.

However, there are still problems in both countries regarding inequality via wage disparities of citizens. When income growth is stagnated or not growing, fixed assets capital formation is difficult. People save less and invest less, which in turn makes the economic consumption story difficult. This is happening in China and in India.

Regarding growth, Professor Li listed a series of mounting pressures: China’s growth rate has fallen from its high-speed era of 8 to 10% to around 5%. Household income growth has slowed sharply and the weakest gains are among the poorest groups. Urban wage growth has also softened. Consumption remains structurally weak. Fixed-asset investment, especially private investment has lost momentum. Unemployment, particularly among young people remains elevated. These are not separate problems. Taken together they raise a harder question, whether China can still generate the level of growth needed to meet its 2035 and 2050 prosperity targets?

India between 2015–2016 experienced significant growth driven by consumption, investment and services expansion. After Covid-19 its growth has stabilized around 6 to 7%, yet higher levels of prosperity are not clearly visible for many and inequality has widened.

The unemployment rate among those aged 16 to 24 in China has remained around 16% for an extended period, fluctuating during seasonal reasons. Unemployment among other age groups have also risen gradually, indicating clear pressure in the labor markets.

In India the unemployment for youth aged between 16 to 25 of age is 42%, per a Azim Premji University Surveys and State of Working India report in 2023. This unemployment rate is double the ratio of what we are witnessing in China.

While in China the education departments have shifted towards STEM (Science, Technology, Engineering and Medicine). India still focuses on Social Science curriculums and students who study within these fields often cannot find job opportunities in the labor market.

India for many years hasn’t invested a substantial amount of energy and commitment to build a vibrant manufacturing sector. Yet, studies have shown that every job created by manufacturing exports creates two additional jobs in related sectors like transportation and logistics. 

China’s wealth inequality via income has risen sharply, Professor Li Shi estimates the wealth Gini coefficient above 0.7 in 2023. India’s wealth inequality may be even more concentrated. Various estimates place India’s wealth inequality/income distribution per the Gini coefficient above 0.80, indicating an extremely unequal distribution of assets and accumulated capital. 

However, the structures of inequality differ between the two economies. In China inequality emerged alongside rapid industrialization, urbanization and export, and led to manufacturing growth. A large industrial economy generated substantial wealth – but distributed it unevenly between labor and capital. 

In India inequality is shaped not only by a wealth concentration at the top, but also by the persistence of low productivity via employment, informal labor markets, weak wage growth, and limited human capital investment across large sections of the population. Thus, while China faces the challenge of emphasizing prosperity within a middle income industrial economy, India continues to struggle with the deeper structural problem of trying to create broad based household income growth in the first place. The differential also sheds light on industrial sector based employment and those in agricultural jobs comparatively between the two nations regarding wage context.

Hard questions that China should ask include if their employment force – who are without many social protections and suffer a lack of higher wages, will allow China to attain competitive advantage over the rest of the world? While its manufacturing products are in demand, it doesn’t help the average Chinese person see realized wages go up and nor creates a dignified life. And China’s trading partners do not benefit, because a lack of competitive advantage destroys industries and makes unemployment problems even worse in other nations. It’s not a question about advantage only, it’s also about why this surplus and deficit competitive problem is growing rapidly and makes stable prosperity unachievable over the long term.

In India despite being proclaimed as the fastest growing global economy, if the young population don’t get jobs and cannot create income for their families, then what’s the purpose of this high GDP growth? Yes, the nation gets to show good growth numbers while hoping to achieve additional investment, but problematic results still occur.

Economic growth without wage growth leads to widening inequality, social unrest and sometimes political backlash. For growth to be inclusive, wages need to rise along with GDP. This requires not just distribution, but a transformation like raising the average productivity of every worker and ensuring they receive their fair share of the economic pie.

Copy and paste the text from AMT that you want to share

India Tamil Nadu State 20260521

India Insider: Capital Formation in Rural Areas and Distress Hill Terrain

Income Comparison via Two Distinct Districts: Tiruvannamlai and Madurai

India is a vastly developing economy, but its national accounting frequently relies on formal sector performance to extrapolate the conditions of the informal economy. Despite official statistics continuing to rise, the economic reality of rural India remains largely unchanged.

Recently, I was travelling extensively across villages in the Tiruvannamalai district of Tamil Nadu State in South India, trying to understand how capital formation works in rural and semi-rural areas.

For more than 50 kilometers, there were barely any shops related to consumption activity. There is no absolute poverty in these areas, but income levels are clearly not standard enough to support strong consumption patterns.

Many people in Tiruvannamalai district villages work in neighboring cities liken Tiruppur, Bengaluru or Chennai and send cash back to their families. Apart from these remittances, agriculture and related seasonal income add to household earnings.

The second observation based on my extensive survey with about 55 women, was that I hardly saw anyone wearing gold chains or ornaments in villages. In other words, household income is often not sufficient enough for families to consistently accumulate gold or jewelry, which traditionally act as a form of savings in Tamil Nadu households.

Evidence suggests the reason for weak savings and low capital formation in Tiruvannamalai is due to low household income generation. And the reason for low household income can be attributed to a lack of local opportunities which offer weak wage growth, plus dependence on migration and the seasonal nature of agriculture sector. Education also plays a decisive role, but the broader issue demonstrates inadequacy of stable income generation.

We do not have sufficient recent district level data to fully validate many of these observations. Tamil Nadu State GDDP data (Gross District Domestic Product) exists, but it often lags. RBI remittance data does helps, but that is largely available at the State level rather than district level.

However, these observations do find relevance in prior surveys conducted by the Tamil Nadu Government before COVID-19.  Districts such as Tiruvannamalai were often catagorized as relatively backward compared to more industralized districts where consumption pattern improved dramatically through manufacturing and urbanization.

Instability via MNREGA’s Distress Hills Data

One interesting way to study this phenomenon is from Mahatma Gandhi National Rural Employment Guarantee Act (MGNREGA) employment data. MGNREGA data is measured in lakh person-days. (A lakh equals 100,000). In simple terms, it measures the amount of labor generated through a combination of workers and days worked under the scheme. 

Say for example, if 100,000 people work for 10 days, or 50,000 people work for 20 days, then: lakh person-days per 100,000*10 equals 10 lakhs person-days. And conversely 50,000*20 equals 10 lakhs person-days.

Sometimes, fewer workers, often work for many days or many workers work for fewer days. Thus, economists use person-days instead of counting only people.

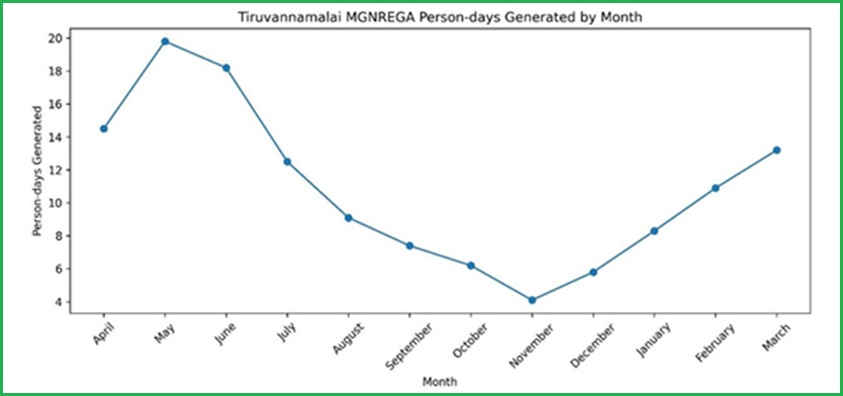
In Tiruvannamalai the pattern of MGNREGA demand reveals a strikingly seasonal and distress driven rural labor cycle. Person-days generated surged to nearly 19.8 lakhs during May, before falling sharply toward November as agricultural activity resumed. The peak compared to it low variation is close to 5:1, creating what can be described as a steep “distress hill” in rural employment demand. 

Such a dramatic fluctuation suggests that a large share of rural households rely on MGNREGA not as supplementary employment, but as an emergency income stabilizer during periods of agricultural inactivity and cash flow stress. The intensity of the spike indicates the absence of diversified rural income sources, exposing the structural vulnerability of the local informal economy.

Tiruvannamalai District: FY monthly 2024-2025, from MGNREGA person-days shows sharp seasonal distress, peaking near 19.8 lakh person-days during May before collapsing toward November.

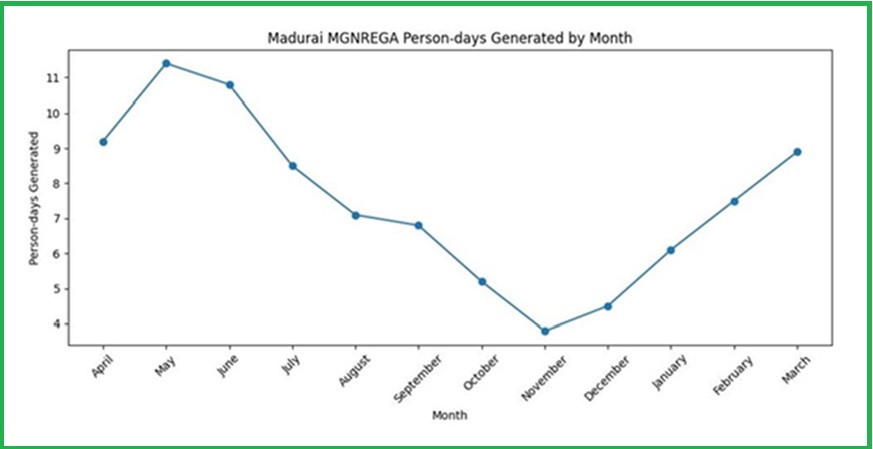
In contrast, the Madurai district in Tamil Nadu State presents a far more stable rural employment profile under MGNREGA. Peak demand was comparatively lower, reaching around 11.4 lakh person-days, while the decline across the year was considerably less severe than in Tiruvannamalai. The peak to low ratio was closer to 3:1, indicating significantly lower seasonal volatility in rural wage dependence.

Madurai District: FY monthly 2024-2025 displays a smoother MGNREGA employment curve with lower seasonal volatility, indicating stronger economic continuity and more diversified income generation.

Rather than exhibiting a sharp distress hill, Madurai’s smoother employment curve suggests a more diversified local economy. This because households may have greater access to non-farm income sources including urban linkages or more stable agricultural activity. The reduced fluctuation implies that MGNREGA functions more as a supplementary employment buffer than as a critical survival mechanism in Madurai compared to Tiruvannamalai.

Seemingly it is evident that consumption oriented businesses may struggle to scale in districts such as Tiruvannamalai, where disposable income growth and household surplus remain weak.

Industrialisation changes this dynamic because stable wage growth improves consumption depth and household savings. Without stable income growth, retail expansion and capital formation remain structurally weak.

The distress hill therefore represents far more than a simple employment fluctuation. The steep seasonal dependence on MGNREGA highlights how large sections of the rural economy remain vulnerable to agricultural cycles, with insufficient diversification, weak consumption resilience, and limited avenues for sustained wealth creation.

Notes:

Chart Sources: Ministry of Rural Development, Government of India, MGNREGA Dashboard (District level monthly person-days generated data).

Distress hills refers to my analysis of seasonal MGNREGA employment patterns to measure rural income instability and economic vulnerability. When plotted month-by-month, districts experiencing severe seasonal stress tend to exhibit a steep hill shape, characterized by sharp spikes in person-days generated during agricultural lean periods, followed by rapid declines once farm employment resumes. The steeper the hill, the greater the dependence of rural households on emergency wage employment for income stabilization.

Copy and paste the text from AMT that you want to share

Indian Rupee 20260515

India Insider: Rupee Under Pressure as Oil Prices Surge and Import Bills Rise

Iranian War and Implications for India as Energy Prices Cause Vulnerability

India is currently facing mounting external economic pressures as rising global crude oil prices weaken the Rupee, widen the current account deficit, and increase the risk of imported inflation. As one of the world’s largest energy importing nations, India remains highly vulnerable to fluctuations in global oil markets. The recent surge in energy prices, combined with geopolitical tensions and volatility in currency markets, has intensified concerns among policymakers, economists and investors.

The Reserve Bank of India (RBI) has stepped up its intervention in the foreign exchange market to stabilize the Rupee, while the government is evaluating measures to reduce pressure on import billing. Rising fuel prices, weakening currency conditions and growing external imbalances have combined to create a challenging macroeconomic environment that may test India’s economic resilience in the coming years.

USD/INR Six Month Chart as of 15th March 2026

Gold and consumer electronics imports are increasingly being viewed as non-essential imports, and policymakers may consider restricting these categories in order to reduce stress on the current account deficit. Officials are concerned that a widening trade imbalance could place further downward pressure on the Rupee and increase dependence on foreign capital inflows.

The Rupee on Thursday fell to a record low near ₹95.95 per USD, making it one of Asia’s weakest performing currencies this year. The currency has erased most of the gains achieved following earlier RBI intervention measures aimed at curbing speculation in the Forex market. Analysts expect the Rupee to remain under pressure through 2026, especially if global crude oil prices continue to rise and significantly increase India’s import billings.

The impact of rising crude oil prices is becoming increasingly visible across the Indian economy. Private fuel retailers have either reduced diesel sales or raised prices in response to the rally in global oil markets, leaving state owned refiners to absorb a larger share of domestic demand. Long queues at fuel stations and rising transportation costs have intensified concerns over inflationary pressures.

Earlier today, State-owned fuel retailers raised fuel prices for the first time in nearly four years as New Delhi adjusted domestic pricing to reflect higher international crude prices following escalating tensions in Western Asia. Diesel and gasoline prices increased by more than 3%, even though Brent crude prices had risen by nearly 50% over the same period.

In New Delhi, diesel prices climbed to around ₹90.67 per litre, while gasoline prices rose to approximately ₹97.77 per litre. These are among the highest levels recorded since 2022 and reflect the growing burden of imported energy costs on the Indian economy.

Economists argue that the rise in fuel prices signals a gradual shift toward market based pricing rather than extensive government controls. Policymakers increasingly recognize that artificially suppressing fuel prices could worsen fiscal pressures and create larger external imbalances over time.

Currency Weakness and Monetary Policy Challenges

RBI Governor Sanjay Malhotra recently remarked at an event in Switzerland that continued currency weakness may be “only a matter of time” if global energy prices remain elevated and capital flows become increasingly volatile.

Foreign outflows during the year have already exceeded previous levels, while a sustained rise in crude oil prices above $100 per barrel could significantly widen the trade deficit and push India towards another period of pressure on balance of payments.

In this climate, attracting foreign capital via various tax cuts or raising the interest rates is paramount to reduce the pressure on the currency. It’s already been seen that New Delhi is working on reducing taxes for foreigners investing in Indian bonds.

Rise of Inflationary Pressures

Although India’s headline inflation remains relatively contained and below the RBI’s 4% medium term target, imported inflation risks are steadily increasing.

Economists also believe the RBI may eventually be forced to maintain tighter monetary conditions or raise interest rates further if energy prices continue to accelerate.

The central bank has already raised interest rates to around 5.25% this year, but several economists argue that further tightening may still become necessary.

Historical Perspective and Structural Risks

Economic historians often compare the current situation with the oil shocks of the 1970s. During that period, the United States was heavily dependent on imported oil. The oil crises of 1973 and again in 1979 contributed to inflationary pressures, balance of payments stress, and periods of USD weakness.

However, economists note that today’s global environment is significantly different. The United States has become one of the world’s largest oil and gas producers, reducing its dependence on imported energy. As a result, rising oil prices no longer weaken the U.S Dollar in the same way they did during earlier oil shocks.

For countries like India, the impact remains severe. India imports the majority of its crude oil requirements. Higher global oil prices directly increase India’s import billing and create additional demands for USD.

As Economist Philip Verleger was quoted by Bloomberg, “when you are a major oil importing nation, you are not only paying more for crude itself, you are also paying more for the dollars required to purchase it.” India is now facing this realization again.

Copy and paste the text from AMT that you want to share

India Vote 20260507

India Insider: How a Film Star is Reshaping Politics in Tamil Nadu

Vijay: A Stunning Victory by an Actor Turned Politician in India

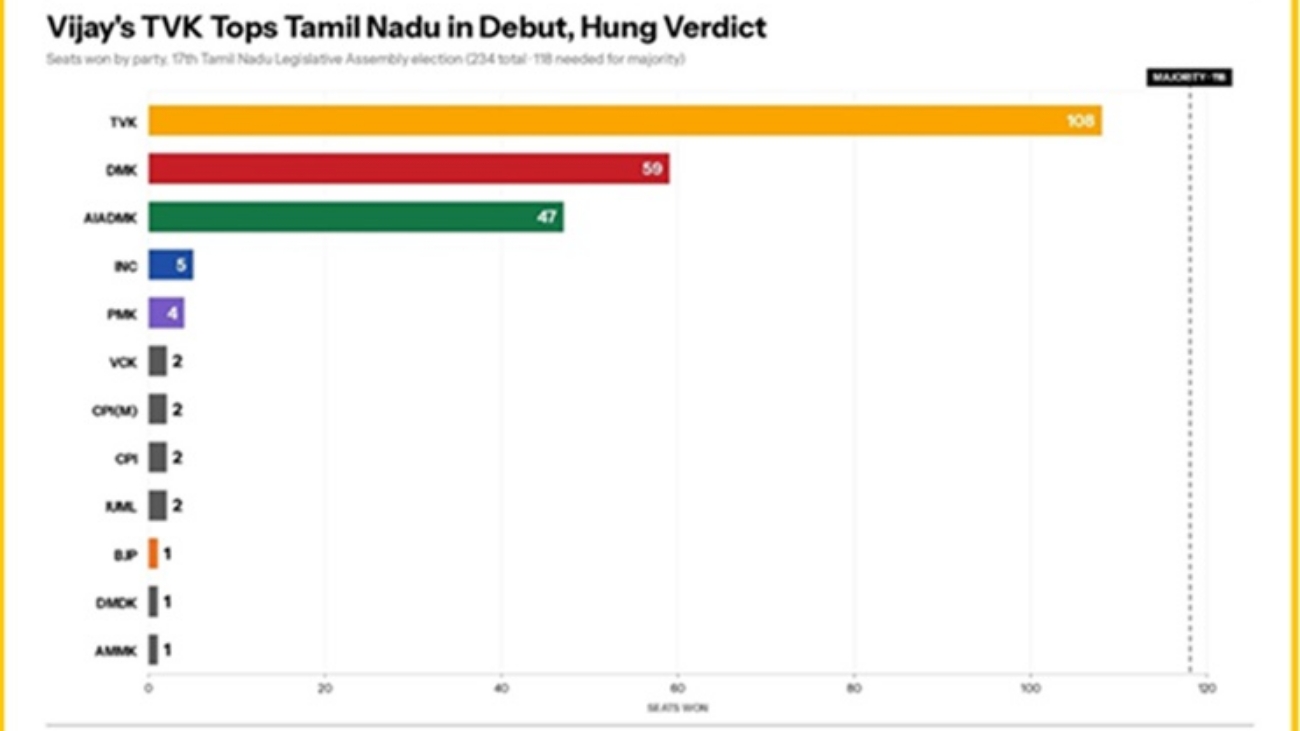
When the Tamil Nadu state election results were announced this Monday, many people were stunned that a party with barely two years of political existence had managed to unseat parties that had dominated the state for more than 75 and 50 years respectively.

TVK (Tamizhaga Vetri Kazhagam), founded by actor turned politician Vijay, used his charismatic presence in Tamil cinema along with the power of social media to attract Gen Z voters and women.

This came despite the incumbent DMK (Dravida Munnetra Kazhagam) government under Chief Minister M.K. Stalin being widely credited for stable governance and helping Tamil Nadu remain one of India’s fastest growing state economies, with a GSDP( Gross State Domestic Product) growth rate of 11.9%.

Voting Results in Tamil Nadu and TVK Topping the Results

The two major Dravidian parties – DMK and AIADMK (All India Anna Dravida Munnetra Kalagam) were originally built on the foundations of social justice, welfare, and development. For decades, they shaped Tamil Nadu’s political identity and succeeded in winning the trust of the people.

However, despite the DMK government’s governance record, allegations of corruption, nepotism, and cash for votes politics continued to surround both DMK and ADMK. These criticisms have become deeply embedded in public perception over the years.

Today’s Gen Z voters appear to want change. Many were looking for a fresh political face capable of reshaping Tamil Nadu’s political landscape.

Vijay’s party reportedly secured around 1.67 crore votes, or approximately 34.3% of the total vote share, one of the strongest performances ever recorded by a newly formed political party contesting its first major election.

India’s political landscape has also been evolving rapidly in recent years. Prime Minister Narendra Modi and the BJP have successfully consolidated much of North India politically and are now working aggressively to expand their influence in southern states such as Telangana, Karnataka, and Tamil Nadu.

For Modi, strong regional opposition leaders such as M.K. Stalin in Tamil Nadu and Mamata Banerjee in West Bengal have remained major political challenges. Any significant political shifts in states like Tamil Nadu and West Bengal could reshape India’s national political dynamics in the years ahead.

While corruption, nepotism, and vote buying are important issues to consider, it is also necessary to distinguish between political allegations and governance outcomes.

In many ways, the DMK government performed better during the last five years than several previous ADMK and DMK administrations. Social indicators are impressive while Tamil Nadu State has attracted billions of USD investment for iPhone and automobile manufacturing.

During the election results, I was driving through Tiruvannamalai in northern Tamil Nadu and noticed that the streets were unusually silent. There were hardly any people celebrating openly.

If another traditional Dravidian party had won, the roads would likely have been filled with supporters distributing sweets and celebrating publicly.

For the first time, it felt as though a major electoral victory had been shaped more by social media influence and public perception than by traditional ground level welfare based political desires.

On my way back home on Monday, I saw an elderly man sitting at a bus stop equipped with fans that helped ease the intense summer heat.

That moment made me wonder: in the next five years, will political change alone truly improve the lives of ordinary people?

Or will charisma and digital influence matter more than governance, infrastructure, and social-welfare in the long run?

Copy and paste the text from AMT that you want to share

Water India Graph 20260430

India Insider: Water Crisis Has Turned From Severe to Critical

India Needs Sustainable Water Security With Improved Infrastructure

India’s population has been expanding at a rapid pace and stands at 1.4 billion. Due to the urbanization process, industrialization in cities like Chennai, Mumbai and Delhi must continue to emphasize improving public infrastructures in order to maintain vital growth.

The growing population and urbanization adds noteworthy stress to the nation’s water bodies. With more people living in increasingly congested areas and pumping large amounts of water via borewells, groundwater levels are rapidly diminishing.

For instance, India consumes roughly 761 billion cubic meters of water per year, making it the largest water consumer in the world, ahead of China and the United States. 85% of rural India is dependent on ground water for agriculture and consumption, this because lake and pond water are not accessible. Rural India suffers from a lack of maintenance and sewage water that often contaminates these important sources.

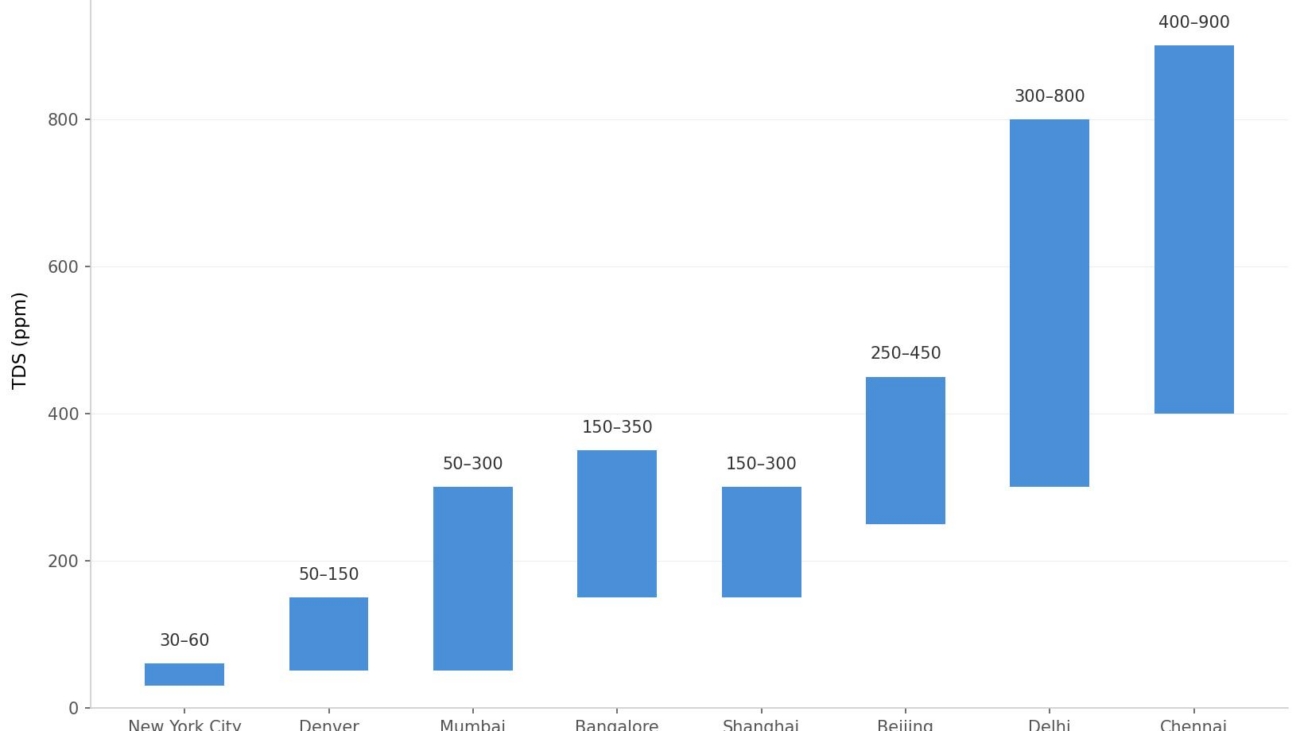
Tap Water via Total Dissolved Solids Comparison in Various Cities Worldwide 

Only a few years ago, water facilities provided by municipalities and urban systems were relatively accessible in India. Low and middle income households relied on pipelines, wells and tap water for their daily usage. However, with sharp rises in population, government capital expenditures on water pipelines and sanitation has not kept pace and often fails to meet needs.

For example, rainfall in Chennai City always ends up staying on roads and platforms in the last few years, this despite the city’s infrastructure which has expanded multifold. In many parts of Chennai, water contamination has become severe with high levels of iron, hardness, turbidity and nitrate levels visible. The government has been inefficient when addressing the contamination. As I witnessed in 2019, many parts of Chennai cannot use ground water due to inadequate rainfall, storage and lack of proper municipal supplies.

And due to excessive extraction of ground water and an inability to channel rain water into the ground, many parts of Tamil Nadu now report total dissolved solids (TDS) ranging from 500 to 1000 parts per million, reaching extreme levels of 3000–5000 ppm in some areas. The World Health Organization recommends much lower levels for safe and palatable drinking water.

Water treatment for households using reverse osmosis plants, which were not normal a few years back have become essential for people seeking safe drinking water. Despite being a coastal region , cities like Chennai cannot rely solely on seawater desalination to meet their drinking water needs. While desalination plants contribute to supply, they account for only a fraction of total demand.

Desalination is an energy intensive and expensive process, making it difficult to scale for universal, affordable access. More importantly, producing water is only one part of the solution and delivering it efficiently remains a major challenge.

India endures 3 to 4 crore (30–40 million) waterborne disease cases every year, mostly from contaminated drinking water. As borewells go deeper, they draw water containing high concentrations of fluoride, arsenic, nitrates, and heavy metals. This creates significant health risks, especially for low income households that cannot afford advanced purification systems. The depletion crisis and contamination crisis are increasingly converging.

Due to rapid urbanization and high population with inefficient audits, many water bodies such as lakes and ponds have been encroached upon by the real estate sector or contaminated by waste disposal by surrounding settlements. This is quite visible in Chennai.

Experts claim that many water officials do not have a clear understanding of how pipeline networks are laid out across cities. As Frontline magazine columnist Vedaant Lakhera wrote in April 2026, India’s water crisis stems less from hydrological scarcity and more from a failure of governance.

The absence of water sensitive designs have allowed cities to expand unchecked, almost freely, contaminating local water sources such as lakes and ponds. This has led to a significant depletion of groundwater availability, which were supposed to act as reserve water reserves.

Addressing this crisis requires a multi-dimensional approach. Rainwater harvesting must be scaled to improve groundwater recharge and long-term availability, while modern purification systems remain essential to ensure safe consumption in the short term. At the same time, systemic reforms such as regular pipeline audits, mandatory replacement of ageing infrastructure, and better urban water management are critical to prevent contamination at its source.

Without such integrated efforts, cities will continue to face a paradox of water scarcity amid abundance. Sustainable water security in India does not depend only on how much water is available, but on how effectively it is managed, protected and delivered.

Copy and paste the text from AMT that you want to share

WTI Crude Oil 20260428

Shift To Economic War Against Iran to Deprive Funds to Regime and IRGC

What If Everyone Is Looking At The Wrong Things About Iran?

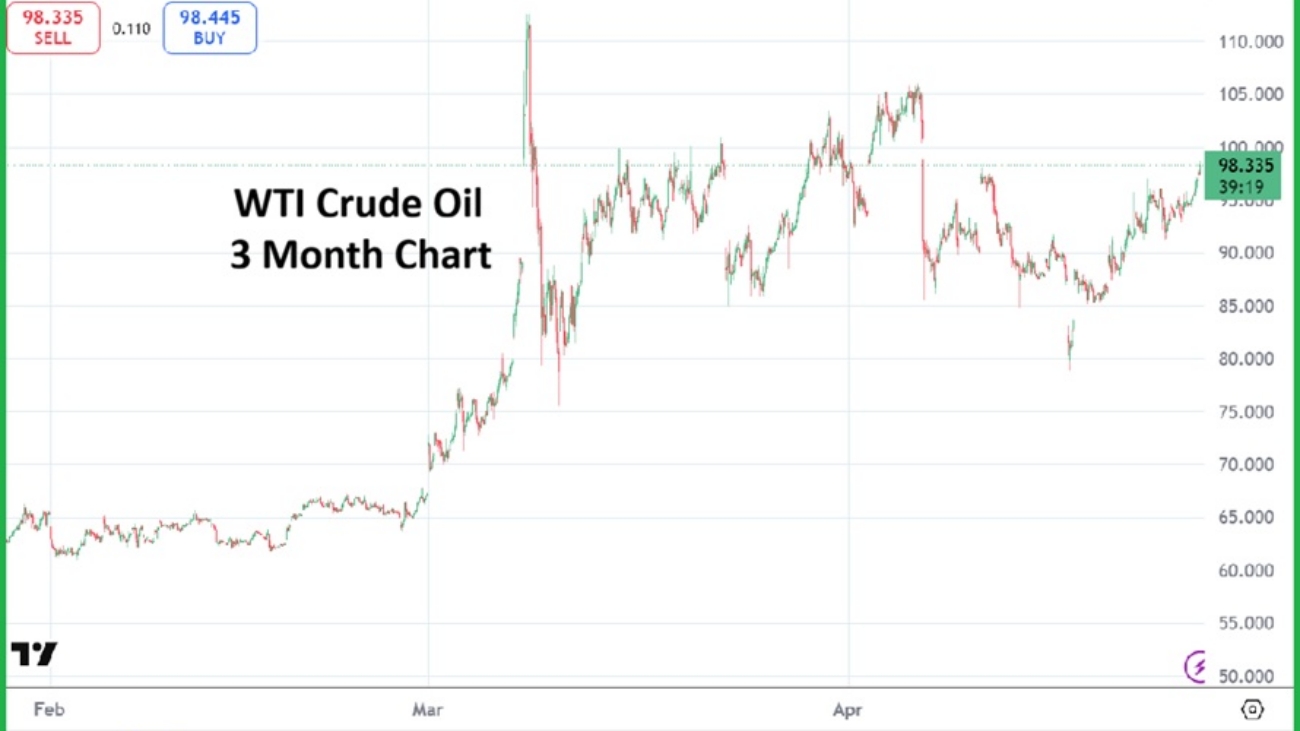
The current futures price for WTI Crude Oil is above $98.00. The cash price for the commodity is above $103.00. While many people continue to fret about what endgame strategy the U.S White House is conducting, what if we are seeing it play out in real time via the price of Crude Oil? Is it possible that President Trump has a coordinated plan to starve the Iranian regime and the IRGC of its much loved and needed money? It appears this is the case.

WTI Crude Oil Futures Three Months Chart on the 28th of April

Simply put, the Iranian Revolutionary Guard Corps is a mafia. They stay in power using the tool of fear brought upon by their ability to be ruthless to the Iranian citizens. They are a terrorist organization in the truest sense. If you disagree with that assessment, you are free to do so. However, facts when they are studied point to the conclusion Iran is a terrorist state led by its regime and the IRGC. 

Iran has made massive amounts of money via its energy products for decades. The shutdown of the Hormuz Strait, or at least the inability to export Crude Oil freely, is putting a strain on global energy prices, and it is causing a major fracture in the main financial export of Iran. 

The U.S has not only shut down easy navigation in the Hormuz Strait, but it is also going after Iran’s cryptocurrency operations. The ability to receive and transfer digital money by Iran is being strangled. What if President Trump is not only listening to the opinions of his military officers, and Secretary of State Rubio and Vice-President Vance, but also Treasury Secretary Scott Bessent who has an abundance of financial knowledge about how money flows internationally and how to create obstacles.

If the IRGC is not able to pay its own members, and other adherents to the Iranian regime are only slowly reimbursed, the apparatus of the IRGC will certainly lose its influence. The inability to pay allies that exists merely because they are employed or corrupted by the IRGC likely is starting to cause fractures regarding loyalties. 

China needs Iranian oil too. And evidence is starting to be speculated upon that China is facing tough decisions about acquiring Crude Oil from other sources. China will not be happy about having to pay higher costs, this because discounted Iranian oil that has abundantly been used is no longer available. 

Equities via the major U.S indices have done incredibly well since the end of March. The Nasdaq 100 has seemingly forgotten about AI overbought concerns, the S&P 500 is within apex territory and the VIX is acting as if sunny days are in the forecast. Forex has been volatile, but the value of the USD is within known realms.  However, the price of WTI Crude Oil is high and it has gotten higher since the 17th of April when futures prices briefly flirted with the $80.00 realm – this before going into a weekend. And this is a clue that something is afoot, beside larger players speculating on what their outlooks are for WTI Crude Oil in the mid-term.

The weekend of the 18th and 19th of April witnessed talk of an end to the Iranian war fall short; and heard President Trump essentially declare the ceasefire is still on but with the caveat that the U.S would create a blockade in the Hormuz Strait. While the semantics of a blockade can be debated, the U.S has caused shipping problems for tankers that were supposed to ship Iranian Crude Oil. The U.S clearly decided to create economic distress for Iran.

The Iranian regime still stands, but its leadership is rather shaken. The IRGC is controlling a lot of the decision making for the time being, and it appears the U.S White House is trying to make the IRGC weaker by ending their financial lifelines. It appears that it has been figured out that an economic war which includes starving Iran of cash is the most certain way to create revolts inside of the nation. When the influence of money is eroded, and temptations via other spheres of power suddenly sound tempting and can be joined, this is when shifts in authority and leadership can occur. 

While many analysts wonder about the lack of an obvious endgame being announced by the Trump administration, maybe it is already being played out. President Trump has a large ego and he is happy to extoll the virtues of his ‘tremendous’ policies frequently, but he also has shown the ability to remain quiet when it comes to plans of action and carrying them out. Yes, this can be argued into the late hours by pro-Trump and anti-Trump people. But maybe Trump is simply telling the truth when it comes to the U.S having time on its side regarding the Iranian ceasefire and the Strait of Hormuz. Maybe the clock is ticking on the eroding cash pile the Iranian regime and IRGC has within its grasp.

Copy and paste the text from AMT that you want to share

Hospitalization Costs 20260421

India Insider: Rising Hospitalization Costs a Growing Concern

Indian Households Face Rising Expenditures for Hospitalization and Critical Care

Many households in India face unexpected hospital expenses that have become almost routine in today’s environment. Rapid urbanization, unclean drinking water, poor air quality due to carbon emissions and industrialization have hit low and middle income homes harder than upper income families. These households are increasingly exposed to diseases that require critical treatment, but the government institutions are ill-equipped to handle the growing patient loads. As a result, many Indians are forced to seek treatment in private hospitals, where costs are significantly higher.

Consider that a middle income household in Madurai earns roughly between 15,000 to 20,000 Rupees per month per person. This per the Periodic Labor Force Survey 2023-2024 Annual Report. So if two people are working in a family, it means empirically, we can estimate the income between 35,000 to 40,000 per month. We need to compute the family’s expenditures – if one member is hospitalized for critical illness or gets hospitalized treatment in private and public hospital.

Even if the income range for this family is better than median estimates, their capacity to absorb medical shocks are limited due to high baseline consumption and minimal household savings.

In the case of hospitalization in a government facility, out of pocket expenditures such as medicines, diagnostics, transport, and wage loss can amount to 12,000 to 40,000, effectively deducting one to two months of household income.

In other words, families need to spend out of pocket by borrowing to finance these gaps for consumption and medical expenses.

However, if a family is forced to take treatment in a private hospital, they would be spending 100,000 to 500,000 Rupees in critical cases, their total spending as a higher percentage of net income and is close to 1,250% in extreme cases.

The Role of Savings and Informal Safety Nets

As observed during Covid-19 and other crises, Gold has often acted as a financial buffer for Indian households.

Families that save during stable periods are able to pledge or sell gold in times of distress, helping them to manage medical expenses without relying entirely on high cost borrowing.

In contrast households without many buffers, often turn to informal lenders or personal loans, where interest rates can range between 36 to 60% compounding the financial distress.

Looking at Government Data for Clues

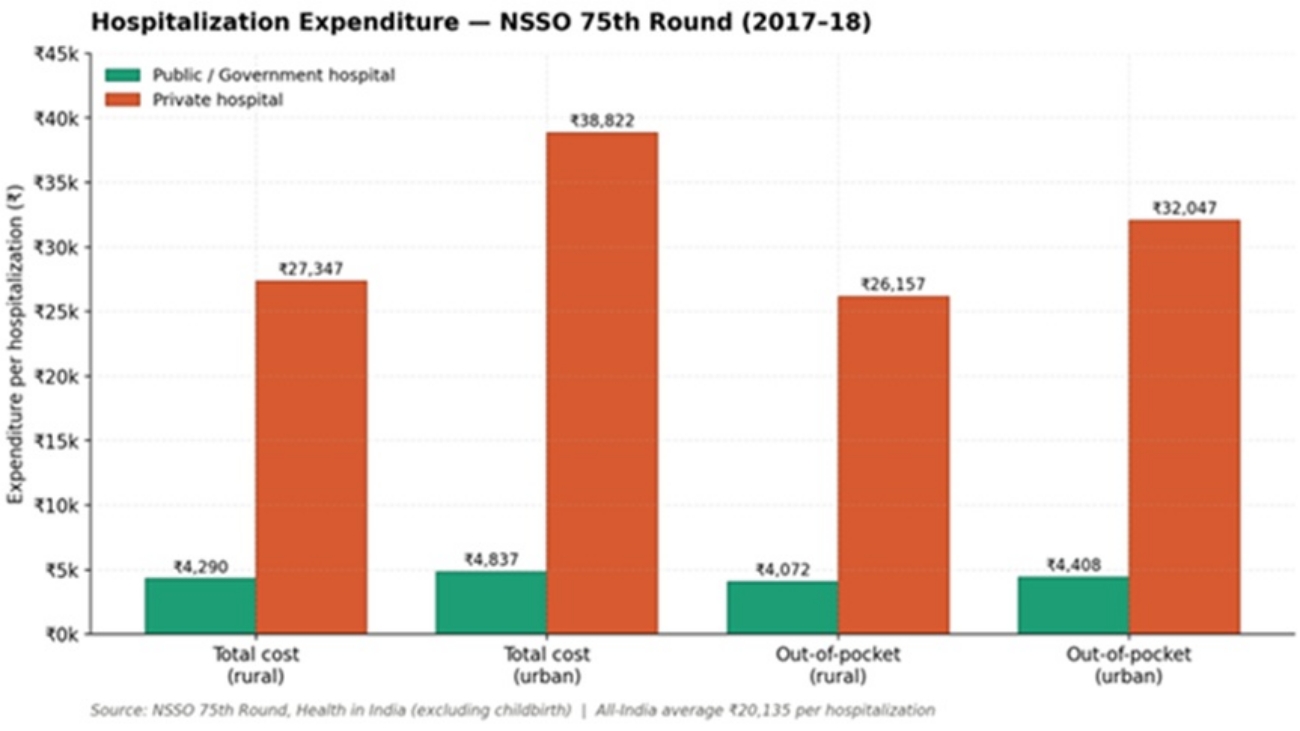
The most authoritative survey on household expenditures on hospitalization comes from National Sample Survey Office’s (NSSO) “Health in India” (2017-2018), and it showed the costs for those hospitalized in private facilities were eight times costlier than government facilitys.

An average hospitalization (excluding child birth) cost 4,290 Rupees in a rural government hospital, and 4,837 in an urban government hospital. The same scenario in a private hospital cost 27,347 in rural India and 38,822 in urban India. Out of pocket expenditures – the amount families pay themselves, follows the same pattern with families having to pay out about 4,000 Rupees in government hospitals, versus 26,000 – 32,000 Rupees in private ones.

Hospitalization Expenditure by Hospital Type and Sector, NSSO 75th Round (2017-2018). Source: MoSPI, Ministry of Statistics.

These were already catastrophic figures for a typical household in 2017-2018. A single private hospital admission cost more than a month’s wages for most Indian families, and it is getting worse.

Seven Years of 12-14% Medical Inflation

Since 2018, the cost of being hospitalized in India has risen at a pace that outstrips almost every other category of spending: Millman’s 2025 medical inflation report pegged the rate at 12% in 2024, more than triple the general CPI inflation of 4.2%.

An urban private hospital admission that cost 38,822 Rupees in 2017-2018 now is in a 76,000 – 91,000 price range, this while real wages are stagnant and not growing. Recent RBI Household surveys conclude that Indians absorb higher debt in order to manage their household expenses.

Critical Illness Can Wipe Out a Household’s Future

Critical illness like heart attacks, a cancer diagnosis, renal failure, kidney transplants costs even more in India – and the problems grow unbearable for Indian families after they are forced to take on more debt. For example, a heart angioplasty with stent that costs 100,000 in 2018 now costs between 200,000 – 300,000 Rupees in private hospitals.  A kidney transplant which costs 400,000 – 600,000 a decade ago now costs 1 million to 1.5 million Rupees. A full course of chemotherapy ranges from 250,000 for early stage diseases to 2.5 million Rupees for advanced cases requiring targeted biologics.

Cost ranges for major critical illness in India, 2024-2025, green bars show public hospital costs, orange bars show private hospital costs. Sources: ACKO India Health Report 2024, HCG Oncology, Hospital Quote Data from Apollo, CARE and others.

Where the Indian Household Stands

As per periodic labor force surveys, the median Indian worker earns 10,000 Rupees a month. The Economic Survey in 2024-2025 recorded average monthly earnings of 13,279 for self-employed workers, 20,702 for salaried workers, and 12,750 for casual laborers. Crucially, only the top 22% of the India’s labor force earns more than 15,000 Rupees per month.

Monthly household income distribution, rural vs urban India (2023-2024). Sources: Periodic Labor Force Surveys, Azim Premji University Income Distribution Study 2019-2024.

Statistically, the household we have taken for the reference is not a poor household by national standards. It is comfortably above the rural and urban median, sitting in the top fifth of the country, and this is what makes the rest of the story so troubling. If this household cannot afford a critical illness, almost no household outside the urban upper middle class can afford rising hospitalization costs.

The Insurance Gap

The government of India has expanded insurance schemes for low income households since 2018 via the Ayushman Bharat PM-JAY with 500,000 Rupees coverage. But the scheme which was set many years ago, does not match the current medical costs scenarios. Income eligibility is an another problem where a majority of people who earn in the middle, slip out of the government insurance schemes and have to take private insurance to cover their health risks. Health insurance penetration in India is low at 3.7% of GDP, well below global statistical standards of 7%.

Across much of India, a single critical illness can effectively destroy years of household income accumulation and trigger debt dependence. In the absence of stronger public healthcare delivery, and without deeper insurance penetration at affordable costs providing better claims services, and lacking robust risk sharing mechanisms – escalating medical costs could act as a drag on India’s economic growth trajectory by weakening household balance sheets.

Notes: 1 USD = 93.24 INR

Copy and paste the text from AMT that you want to share

India Rupee 20260416

Progression Upwards for Indian Rupee and Catalysts

USD/INR Persistent Trajectory Remains in Force and Mid-Term Concerns

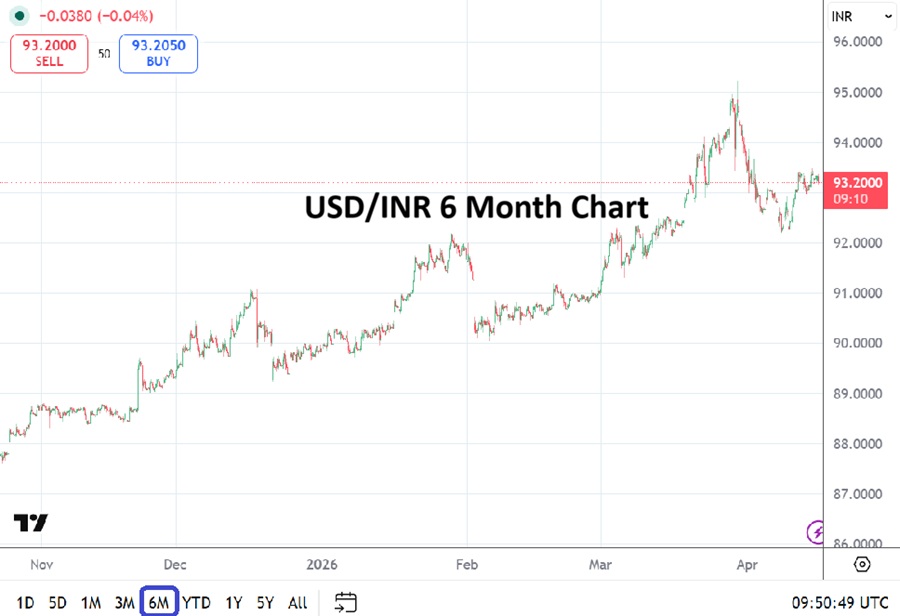
As of this writing the USD/INR is within the 93.2000 vicinity. The price of Gold is around $4,810.00 and Silver close to 79.50. Importantly, WTI Crude Oil is trading around $89.25. Global markets have turned in solid performances the past two weeks, this has been a two step progression for most investors. 

Indian financial institutions began to digest their worries regarding the Iranian war late in March – perhaps acknowledging the risks and ramifications, while adjusting outlooks. Then on Tuesday the 7th of April the establishment of a ceasefire was announced. However, after hitting a low of around the 92.2200 realm on the 8th of April, the USD/INR is back within higher ratios.

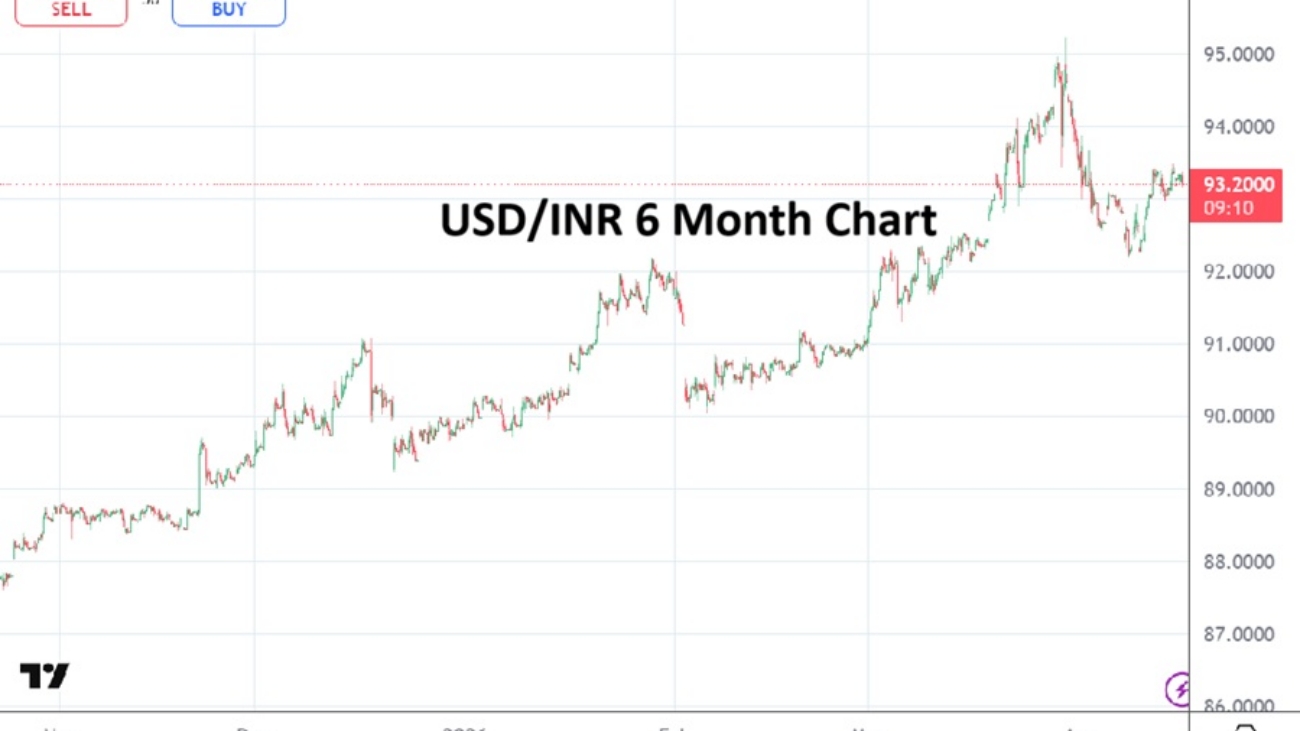
USD/INR Six Month Price Chart as of 16th April 2026

Yes, the USD/INR had been traversing above the 95.0000 ratio late in March, so it can be said the Indian Rupee has gotten stronger. Yet, there will not be many willing participants who will join a parade with the belief this lower trend can be sustained. The bullish trajectory of the USD/INR is not going to vanish.

On the 24th of October 2025, the USD/INR was near 87.7500. At this time last year the currency pair was close to 85.5000. A persistent and long-term move higher has been the theme in the USD/INR. Weakness in the Indian Rupee has been part of India’s economic story rather consistently for a handful of years. 

Narendra Modi has been in power since 2014, he is serving his third term as Prime Minister. His political party the BJP clearly has its chosen people within the Reserve Bank of India.

The government’s position of allowing the Indian Rupee to be weaker is not something they will want to state out loud as part of their mandate, but it is clearly not bothering them.

The pursuit of creating a stronger industrial and manufacturing base for India, including IT and software via good exchange rates for international clients is seen as a cornerstone to build demand. The quality of work and technology provided by the Indian workforce is good and this allows global clients to foster solid relationships with Indian companies.

However, the rise of the USD/INR to above the 95.0000 level in late March was a warning sign, that sometimes price velocity in Forex can become dangerous. And the Iranian war although enjoying a week and half of less noise, still could escalate into a problematic scenario for India that could cause additional concerns in Indian financial institutions who are trying to gauge their mid-term outlooks.

The USD/INR is an important part of this economic math and the prospect that higher energy costs, or in a worst case scenario – shortages incur hardship for Indian citizens and companies is an actual concern.

The current situation in the Hormuz Strait and availability of Crude Oil is significantly important for India. So is supply of LNG (liquefied natural gas) which Qatar, Oman and the UAE play a role. The supply of energy presents a glaring dark shadow for the prospects of the Indian economy should there be shortfalls. 

The 93.5000 resistance level has been durable since early April in the USD/INR. Stability of the exchange rate is crucial for a wide range of business in India, including banking and financial institutions active in the Bombay stock market – particularly since a weaker India Rupee opens the door to Forex concerns for foreign investors who do not have the ability to hedge if they are exposed via the INR too much. Foreign investors are needed in the Nifty indices to help values.

The near-term is likely going to remain a difficult path for the USD/INR and its outlook. The positive sentiment which has prevailed the past couple of weeks has been welcome and certainly stable conditions are hoped for so equilibrium can be kept. However, if the Iranian situation manifests into open military conflict again, or if there is a disruption of supply of energy that cannot be easily solved by India – then the USD/INR could once again face price velocity upwards that is uncomfortable.

While China may be getting the headlines regarding potential ramifications of its Crude Oil supply being threatened, India is estimated to have consumption that is ranked as the 3rd biggest globally. India’s ability to get a supply of energy from a diversified stable of sources is a key for the nation moving forward. 

The USD/INR will continue to move higher, the question is how fast? A slow steady rise in the currency pair – again, this will not be a spoken mandate by the Indian government – will continue. The fear of a rapid debasement is a concern. Financial institutions in India need steady emotions and are certainly hoping for the Iranian war to conclude with a sliver of optimism. 

Copy and paste the text from AMT that you want to share

India Insider GDP Savings and Investment 20260408

India Insider: Education, GDP and Personalized Growth a Difficult Balancing Act

Is India Still 'The Country of the Future'?

In 1991, when India’s foreign exchange reserves had dwindled to barely three weeks of import cover, the government pledged its gold to the Bank of England. It was a moment of humiliation and, paradoxically, of liberation as the crisis forced an opening that three decades of socialist planning had resisted. Fast forward into 2025: India is a $4.1 trillion USD economy, the world’s most populous nation, with a moon rover, a thriving startup ecosystem, and a digital payments infrastructure the developed world now studies with envy.

This article asks if India is still ‘the country of the future’ using the same growth determinants framework applied by Professor Manoel Bittencourt to Brazil, and argues that the answer lies not primarily in corruption (though it matters), not in policy failure (though that matters too), but in two structural features that resist easy reform: the vast informality of the Indian economy, and the depth of its inequality.

Does Growth Matter? The 70/g Rule Applied to India

Before diagnosing India’s problems, we must appreciate what it has already achieved. Using the 70/g rule which tells us how many years it takes for income per capita to double at a given growth rate – India’s average GDP growth of roughly 6.5% since 1991 implies a doubling of income every 11 years. That is extraordinary by historical standards.

But averages mask distributions. If growth accrues predominantly to the formal sector – the top 10% of earners who hold formal employment, own financial assets, and participate in the organized economy, then the 70/g rule tells a story of elite enrichment, not a broad based development. This is India’s core dilemma.

The Eight Growth Determinants: India in the Data

Bittencourt’s framework identifies eight standard growth determinants: savings, fertility, rule of law, government consumption, trade openness, education and health investment, inflation, and finance. Let us examine some of each through Indian data, with Brazil as our comparator.

Savings & Investment

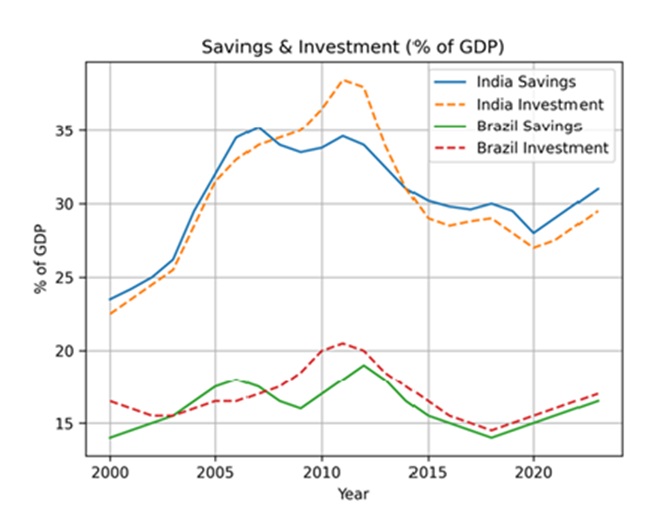
India’s gross savings rate has historically been a strength hovering around 30–32% of GDP through the 2000s and 2010s. But the investment picture is more troubled. Fixed capital formation has declined since its peak around 2011–12, driven by a stressed banking sector, weak private investment appetite, and an infrastructure gap. Brazil shows a similar pattern of savings-investment divergence  but India’s gap has widened more sharply in recent years.

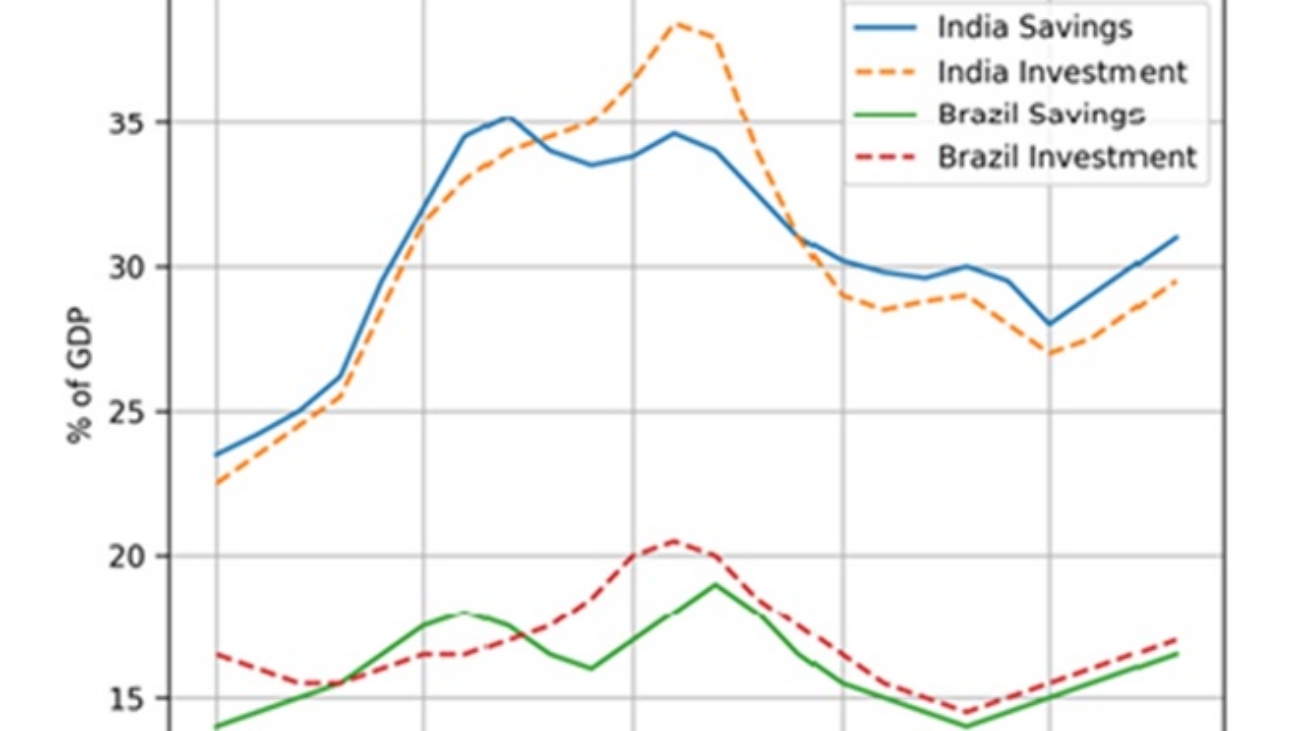
Gross Domestic Savings and Fixed Capital Formation. India vs Brazil. 2000-2023

Education & Health Spending

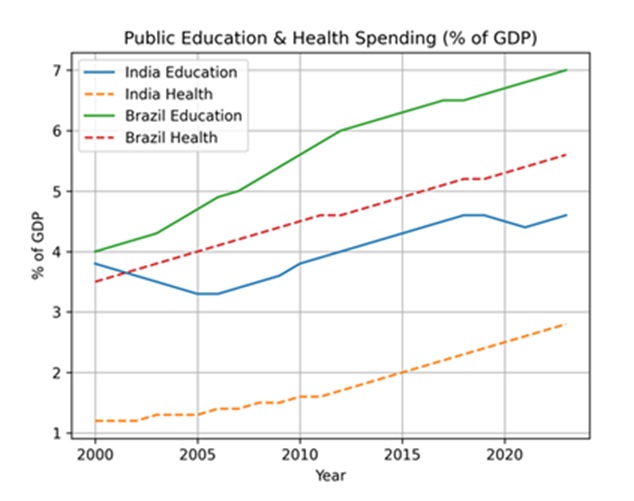
Perhaps nowhere is India’s “policy-delivery gap” more apparent than in social spending. India spends approximately 4.5% of GDP on education and just over 3% on health, and both figures are well below what comparable middle income countries invest. Brazil, despite its own fiscal struggles, consistently outspends India on health as a share of GDP. The consequences are visible in learning outcomes: the Annual Status of Education Report (ASER) consistently finds that a significant share of Indian schoolchildren cannot read a simple paragraph or perform basic arithmetic.

This matters enormously for growth. An economy hoping to absorb millions of workers into formal, productive employment each year needs those workers to arrive with usable skills. When they do not, informal low productivity employment becomes the default  and cycles of informality perpetuate.

Government Spending on Human Capital. India vs Brazil. 2000-2023

The Thesis: Informality as Structural Trap

Bittencourt identified corruption as the growth killer in Brazil. For India, the more precise diagnosis is informality and the inequality it both reflects and reinforces.

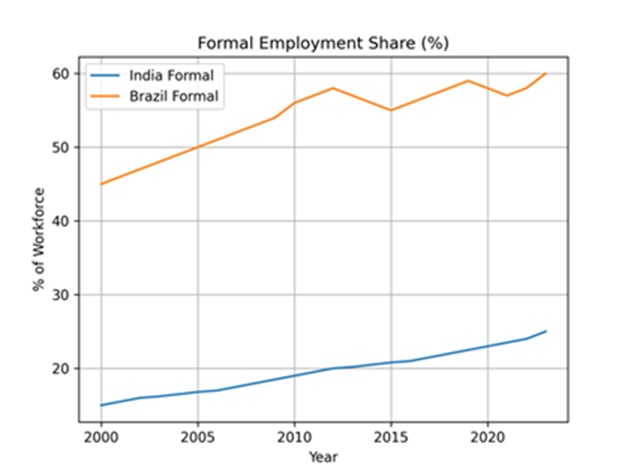
Consider the arithmetic: approximately 80% of India’s workforce is informally employed who are working without contracts, without social protection, without access to formal credit, and largely invisible to the tax system. This informal mass produces perhaps 50% of GDP. The productivity gap between the formal and informal sectors is staggering, and it does not shrink naturally with overall growth.

Share of Workforce in Formal Employment. India vs Brazil. 2000-2023

Brazil is itself a country with significant informality, but its formal sector share has grown meaningfully since the early 2000s, driven by the expansion of the Bolsa Família program, minimum wage policies, and labor formalization drives. India, by contrast, saw its already small formal sector shrink as a share of total employment after demonetization in 2016 and the disruptions of COVID-19. The gap between the two countries on this metric is instructive.

Inequality: When Growth Passes People By

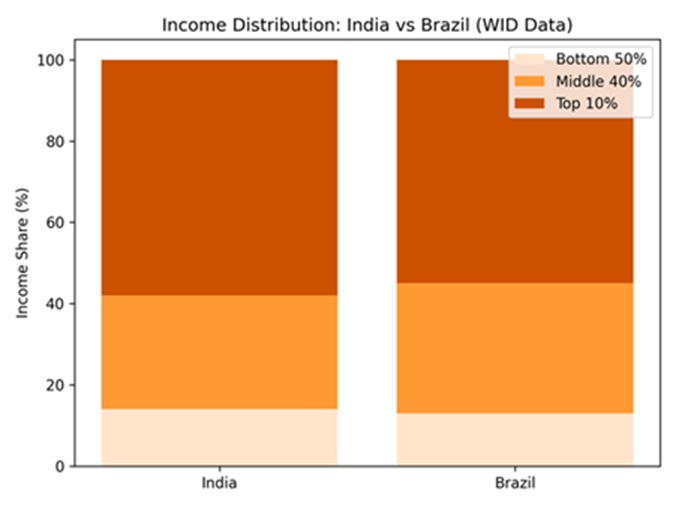
India’s Gini coefficient – a standard measure of income inequality – has risen over the reform era even as aggregate poverty has fallen.  It shows the signature of unequal growth. The bottom quartile has seen real income gains, but the top decile has captured a disproportionate share of the growth dividend. Recent estimates suggest that India’s top 1% now hold a larger share of national income than at any point since Independence.

Income Distribution India vs. Brazil.

Compare this to Brazil, which, despite its own severe inequality, pursued deliberate redistributive policies through the 2000s with Bolsa Família reaching 14 million families at its peak and a concerted minimum wage policy. India’s equivalents – the MNREGA rural employment guarantee, PM-Kisan farm payments are larger in coverage but smaller in benefit size at this stage, and reach informal workers imperfectly.

The Structural Complications

A purely data driven analysis, as Bittencourt himself acknowledged for Brazil, understates the depth of the challenge. India’s informality is not simply a policy failure, it is rooted in structures that predate modern economics.

The caste system, legally prohibited but still socially persistent, has historically sorted populations into occupational roles and those at the bottom of the hierarchy were systematically excluded from property ownership, formal education, and credit. Colonial de-industrialization destroyed the artisan economy that might otherwise have been a pathway to formal employment. The fragmentation of the federal system with 28 states running effectively different labor markets, land acquisition regimes, and social programs means that a policy that works in Tamil Nadu may fail in Uttar Pradesh.

These are not excuses. They are explanatory variables that any honest growth analysis must include.

What Does Growth Theory Tell Us to Do?

The prescription is not mysterious. If informality is the barrier, then the priority is to make formal employment more accessible through labor law simplification, portable social insurance that follows the worker rather than the employer, and a genuine skill based learning infrastructure that reaches the rural poor.

If inequality is the barrier, then the priority is redistribution that enhances human capital at the bottom – not cash transfers alone, but the quality of the school your child attends and the clinic your mother can access. India has the architecture of such systems; it does not yet have substantive results.

The demonstrators on India’s streets – whether farmers in 2020-21, or youth protesting paper leaks, or contract workers demanding permanence – know this intuitively. They are not asking for charity. They are asking to be absorbed into the formal economy that has prospered around them.

Conclusion: Is India Still the ‘Country of the Future’?

The answer to the question is Yes, and it is both an achievement and an indictment. India has built a moon program and yet cannot reliably staff a primary school. It has produced the world’s most used digital payments system and left 200 million people without bank accounts until recently. It exports software engineers to Silicon Valley, while its domestic labor market cannot absorb graduates at scale.

Brazil, our comparison, has struggled with its own version of this duality longer. But Brazil’s welfare state, however fiscally stressed has created a floor. India’s floor is thinner, and the drop beneath it steeper.

Informality is not the destiny for any developing economy. South Korea was deeply informal in the 1960s, China was an overwhelmingly rural agrarian nation in 1980. Both made transitions through deliberate, state led investment in human capital and formal employment creation. The path is known. The question for India in 2026 is whether the political will exists to progress via focused programs, or whether fifty years from now someone else will write another article illuminating the same structural problems.

Article Notes:

Data sources include the World Bank World Development Indicators, ILO Labour Statistics, Transparency International Corruption Perceptions Index, ASER Centre (India), UNESCO Institute for Statistics, and IMF World Economic Outlook. Growth determinant categories follow Barro (2008) as synthesized by Bittencourt.

Copy and paste the text from AMT that you want to share