USDINR 20260615

India Insider: Can We Become a Developed Economy on Low Wages?

The Brutal Nature of a Large and Cheap Workforce

Ms. Nithya (name changed) works in a private school in Tamil Nadu. She gets to school by 9 AM and leaves around 5 PM. The school she works for hasn’t paid a salary for two months and she has no contract. She gets $83.00 USD per month in a small city of Tamil Nadu State. While this may sound extraordinary to some readers, it is not an isolated case in countries like India. 

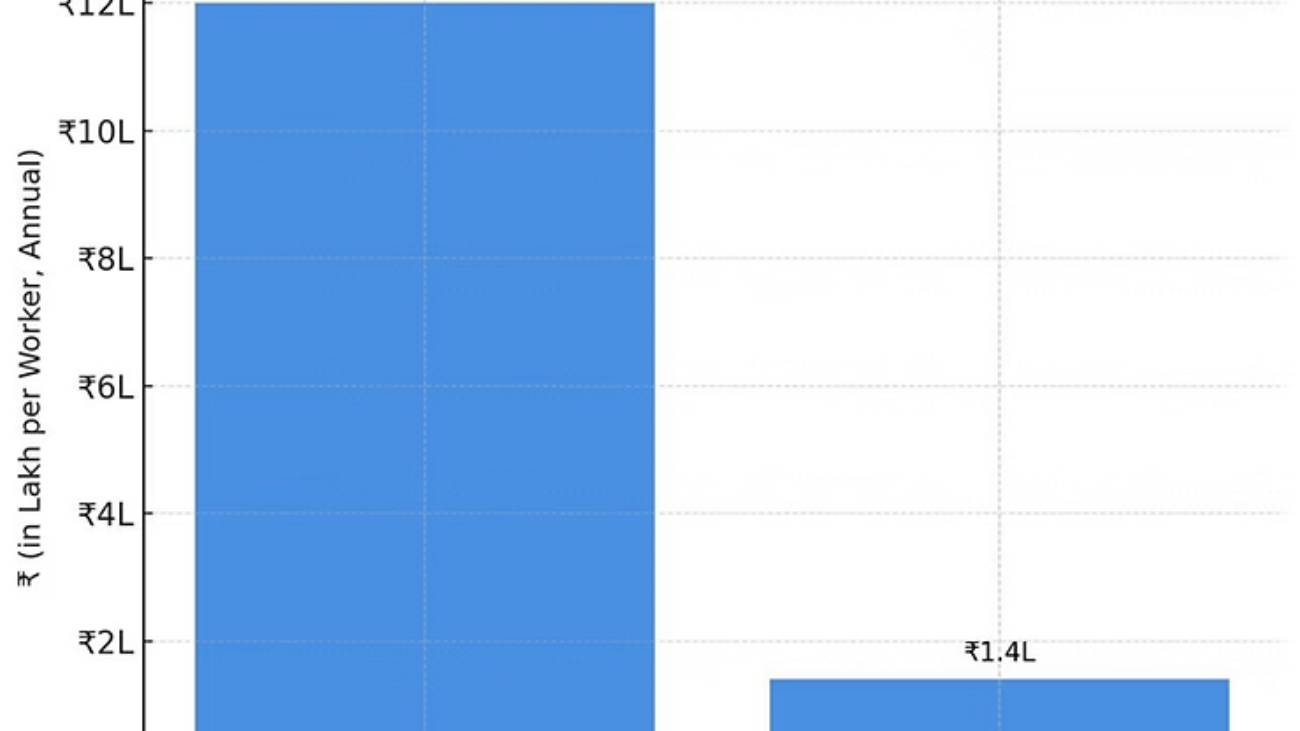
Salary surveys and labour market studies indicate that many private school teachers in smaller towns and rural areas earn between ₹5,000 and ₹15,000 per month, this despite possessing educational qualifications and working full-time schedules. Though private schools in India often collect exorbitant fees, they pay teachers less and it hasn’t changed for years. 

USD/INR Six Month Chart as of 15th June 2026

Indian nurses often are treated in the same manner. Those who prefer to work in government institutions or emigrate to foreign countries earn better wages. Attrition in the nursing industry is quite high in India. Why?

Because of the lower wages in most of the private hospitals in India, and the higher wages offered in Singapore or in the Middle East a career and lifestyle choice arises. That’s why many nurses work for a time in institutions closer to their towns. And then switch to more lucrative opportunities when salaries are more handsome in distant Indian cities or in a foreign country.

Male nurses from rural areas also leave and work in GCC countries. As long as wages remain lower and uncompetitive, attrition will prevail in India’s nursing sector.

Perspectives From The Employees Standpoint

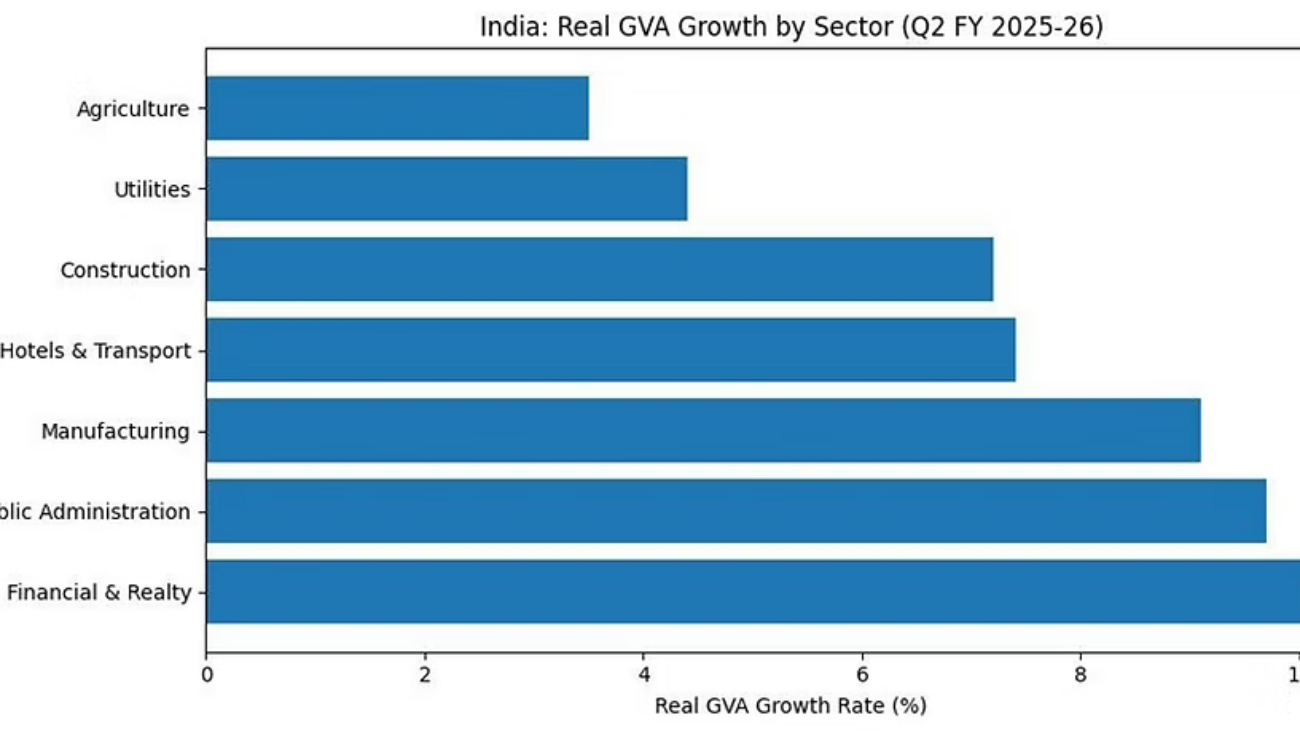
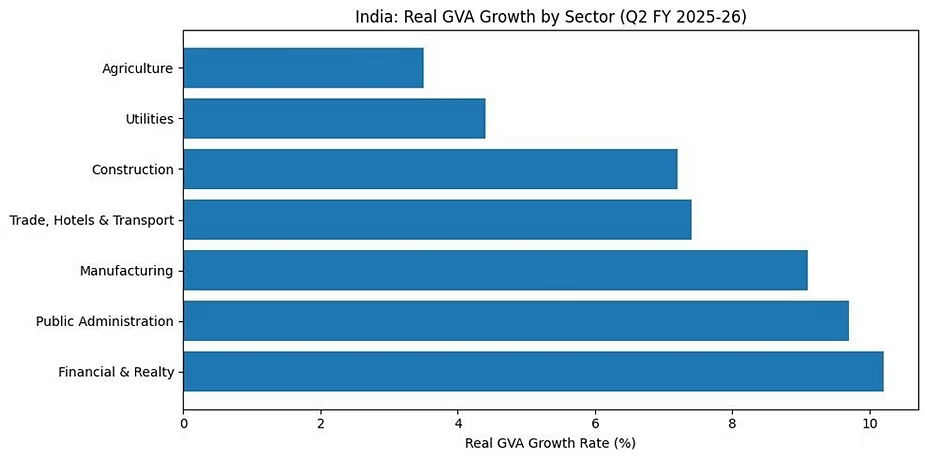
India wants to become a 10 trillion USD economy by 2047. How will India increase its total output to achieve the above target? India has to create jobs and better compensation via salaries for its people.

Without sufficient income, how are people expected to pay for goods and services produced in the economy? And if people are not buying, who will buy the goods? Maybe the generous foreigners, but can India accomplish this goal? India’s service exports such as Information Technology are already facing questions of viability, this as AI confronts and makes strong and sufficient intrusions into existing business models of legacy companies.

Gig workers deliver parcels dictated by soulless algorithms. The algorithm doesn’t understand the burdens of hot summers and cold winters. It dictates rules and regulations according to its capital owners’ protocols. Employees who work in this profession have to work no matter whether they have fevers, cold ,body aches or anything else they might be an affliction.

Like feudal landlords who extracted labour without many concerns for the well being of those who worked under their authority, today’s digital platform economy often places efficiency and profits above human considerations. This is called “techno-feudalism” by some economists.

Though individual states in India have labour laws and regulations, India’s readiness and capability to enforce these laws in order to regulate the welfare of the labour market is still not up to standards elsewhere and difficult to enforce.

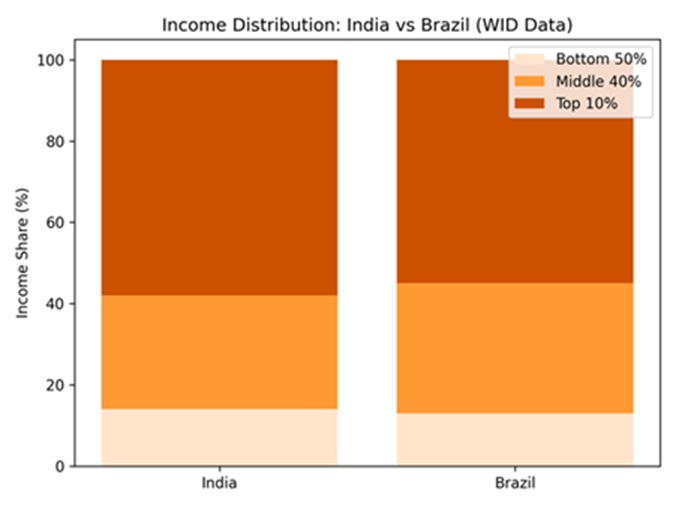
If your income remains low relative to the cost of living, how do you increase your consumption? A question that India’s ultra-wealthy should ask as their companies produce everything from cars to household goods and understand the importance of making money for themselves, is if they understand the other side of the balance sheet? Perhaps they would make investments that create jobs which in turn would help families spend their extra money on their companies goods and services.

India suffers from the availability of a high proportion of cheap and qualified labour that is easy to manipulate and allows a few to profit from the many. Given the tepid investments by private business in consideration for the other side of the balance sheet, the wages that most employees receive via basic economic models are insufficient.

Ironically and sadly, in some parts of India, especially in smaller towns or rural areas it is true that many private sector nurses, schoolteachers, and other service workers earn less than the international poverty line of $3 per day (around ₹285 at current exchange rates).

Education is certainly a tool for women empowerment, but it is often confronted by employers who take advantage of the educated and still pay poor salaries. This ‘accepted truth’ regarding education becomes questionable given the reluctance of institutions to pay a better salary for those who have spent money on improving their knowledge and skills. Those who work for meager pay, while not earning enough income to save money, nor participate in liquid investments or stock investments are caught in India’s labour market trap.

While writing this article, I witnessed a young married woman in her 30s, delivering parcels on behalf of Flipkart (owned by Walmart) in a vehicle which suffered from the brutality of the afternoon sun. Such is the nature of the labour market right now in India .

India shouldn’t allow people to work in a system that enriches techno-feudalists and business people by putting the welfare of their employees at risk. If India wants to be a developed economy, it should put people first. Economic development should not be measured solely by GDP growth, stock market indices, or the wealth of billionaires. It should also be judged by whether the ordinary workers can earn enough to live with dignity, support their families, and participate meaningfully in the prosperity they are helping create.

Note: 1 USD = 94.90 INR as of 12th June 2026

Copy and paste the text from AMT that you want to share

post277

India Insider: Growth without Prosperity, Thoughts and Comparisons

Growth and Prosperity Data Meet India and China's Realities

Economic growth is important for generating prosperity. India as well as China has helped millions be lifted out of poverty using separate development trajectories. Still, questions about income distribution remain a difficult topic that policy makers in both nations often are unwilling to look at with deeper persistence because plenty of inequalities still exists and the subject remains potentially divisive.

China’s low income population is extremely large. Professor Li Shi’s research argues that nearly 300 million people in China are earning less than 1000 Yuan ($149 USD) per month in 2021, while nearly 98 million had monthly incomes below 500 Yuan ($75 USD).

The same is true for the majority in India. As per the Pahle Foundation research shows nearly 91% of India’s workforce remains in the informal sector where their annual per capita incomes are below ₹2.5 lakh Rupees or ₹20,800 Rupees per month ($217 USD per month).

Although industrial and wage models are different comparatively, for instance in China the industrial sector includes 32% of the total working age population and produces an estimate of 36 to 37% of the GDP. And 22% of China’s workforce are employed in agriculture and produce close to 7% of GDP. In India a higher share of the people are in agriculture – close to 45%, and generate roughly 15-18% of the nation’s GDP.

However, there are still problems in both countries regarding inequality via wage disparities of citizens. When income growth is stagnated or not growing, fixed assets capital formation is difficult. People save less and invest less, which in turn makes the economic consumption story difficult. This is happening in China and in India.

Regarding growth, Professor Li listed a series of mounting pressures: China’s growth rate has fallen from its high-speed era of 8 to 10% to around 5%. Household income growth has slowed sharply and the weakest gains are among the poorest groups. Urban wage growth has also softened. Consumption remains structurally weak. Fixed-asset investment, especially private investment has lost momentum. Unemployment, particularly among young people remains elevated. These are not separate problems. Taken together they raise a harder question, whether China can still generate the level of growth needed to meet its 2035 and 2050 prosperity targets?

India between 2015–2016 experienced significant growth driven by consumption, investment and services expansion. After Covid-19 its growth has stabilized around 6 to 7%, yet higher levels of prosperity are not clearly visible for many and inequality has widened.

The unemployment rate among those aged 16 to 24 in China has remained around 16% for an extended period, fluctuating during seasonal reasons. Unemployment among other age groups have also risen gradually, indicating clear pressure in the labor markets.

In India the unemployment for youth aged between 16 to 25 of age is 42%, per a Azim Premji University Surveys and State of Working India report in 2023. This unemployment rate is double the ratio of what we are witnessing in China.

While in China the education departments have shifted towards STEM (Science, Technology, Engineering and Medicine). India still focuses on Social Science curriculums and students who study within these fields often cannot find job opportunities in the labor market.

India for many years hasn’t invested a substantial amount of energy and commitment to build a vibrant manufacturing sector. Yet, studies have shown that every job created by manufacturing exports creates two additional jobs in related sectors like transportation and logistics. 

China’s wealth inequality via income has risen sharply, Professor Li Shi estimates the wealth Gini coefficient above 0.7 in 2023. India’s wealth inequality may be even more concentrated. Various estimates place India’s wealth inequality/income distribution per the Gini coefficient above 0.80, indicating an extremely unequal distribution of assets and accumulated capital. 

However, the structures of inequality differ between the two economies. In China inequality emerged alongside rapid industrialization, urbanization and export, and led to manufacturing growth. A large industrial economy generated substantial wealth – but distributed it unevenly between labor and capital. 

In India inequality is shaped not only by a wealth concentration at the top, but also by the persistence of low productivity via employment, informal labor markets, weak wage growth, and limited human capital investment across large sections of the population. Thus, while China faces the challenge of emphasizing prosperity within a middle income industrial economy, India continues to struggle with the deeper structural problem of trying to create broad based household income growth in the first place. The differential also sheds light on industrial sector based employment and those in agricultural jobs comparatively between the two nations regarding wage context.

Hard questions that China should ask include if their employment force – who are without many social protections and suffer a lack of higher wages, will allow China to attain competitive advantage over the rest of the world? While its manufacturing products are in demand, it doesn’t help the average Chinese person see realized wages go up and nor creates a dignified life. And China’s trading partners do not benefit, because a lack of competitive advantage destroys industries and makes unemployment problems even worse in other nations. It’s not a question about advantage only, it’s also about why this surplus and deficit competitive problem is growing rapidly and makes stable prosperity unachievable over the long term.

In India despite being proclaimed as the fastest growing global economy, if the young population don’t get jobs and cannot create income for their families, then what’s the purpose of this high GDP growth? Yes, the nation gets to show good growth numbers while hoping to achieve additional investment, but problematic results still occur.

Economic growth without wage growth leads to widening inequality, social unrest and sometimes political backlash. For growth to be inclusive, wages need to rise along with GDP. This requires not just distribution, but a transformation like raising the average productivity of every worker and ensuring they receive their fair share of the economic pie.

Copy and paste the text from AMT that you want to share

India Insider GDP Savings and Investment 20260408

India Insider: Education, GDP and Personalized Growth a Difficult Balancing Act

Is India Still 'The Country of the Future'?

In 1991, when India’s foreign exchange reserves had dwindled to barely three weeks of import cover, the government pledged its gold to the Bank of England. It was a moment of humiliation and, paradoxically, of liberation as the crisis forced an opening that three decades of socialist planning had resisted. Fast forward into 2025: India is a $4.1 trillion USD economy, the world’s most populous nation, with a moon rover, a thriving startup ecosystem, and a digital payments infrastructure the developed world now studies with envy.

This article asks if India is still ‘the country of the future’ using the same growth determinants framework applied by Professor Manoel Bittencourt to Brazil, and argues that the answer lies not primarily in corruption (though it matters), not in policy failure (though that matters too), but in two structural features that resist easy reform: the vast informality of the Indian economy, and the depth of its inequality.

Does Growth Matter? The 70/g Rule Applied to India

Before diagnosing India’s problems, we must appreciate what it has already achieved. Using the 70/g rule which tells us how many years it takes for income per capita to double at a given growth rate – India’s average GDP growth of roughly 6.5% since 1991 implies a doubling of income every 11 years. That is extraordinary by historical standards.

But averages mask distributions. If growth accrues predominantly to the formal sector – the top 10% of earners who hold formal employment, own financial assets, and participate in the organized economy, then the 70/g rule tells a story of elite enrichment, not a broad based development. This is India’s core dilemma.

The Eight Growth Determinants: India in the Data

Bittencourt’s framework identifies eight standard growth determinants: savings, fertility, rule of law, government consumption, trade openness, education and health investment, inflation, and finance. Let us examine some of each through Indian data, with Brazil as our comparator.

Savings & Investment

India’s gross savings rate has historically been a strength hovering around 30–32% of GDP through the 2000s and 2010s. But the investment picture is more troubled. Fixed capital formation has declined since its peak around 2011–12, driven by a stressed banking sector, weak private investment appetite, and an infrastructure gap. Brazil shows a similar pattern of savings-investment divergence  but India’s gap has widened more sharply in recent years.

Gross Domestic Savings and Fixed Capital Formation. India vs Brazil. 2000-2023

Education & Health Spending

Perhaps nowhere is India’s “policy-delivery gap” more apparent than in social spending. India spends approximately 4.5% of GDP on education and just over 3% on health, and both figures are well below what comparable middle income countries invest. Brazil, despite its own fiscal struggles, consistently outspends India on health as a share of GDP. The consequences are visible in learning outcomes: the Annual Status of Education Report (ASER) consistently finds that a significant share of Indian schoolchildren cannot read a simple paragraph or perform basic arithmetic.

This matters enormously for growth. An economy hoping to absorb millions of workers into formal, productive employment each year needs those workers to arrive with usable skills. When they do not, informal low productivity employment becomes the default  and cycles of informality perpetuate.

Government Spending on Human Capital. India vs Brazil. 2000-2023

The Thesis: Informality as Structural Trap

Bittencourt identified corruption as the growth killer in Brazil. For India, the more precise diagnosis is informality and the inequality it both reflects and reinforces.

Consider the arithmetic: approximately 80% of India’s workforce is informally employed who are working without contracts, without social protection, without access to formal credit, and largely invisible to the tax system. This informal mass produces perhaps 50% of GDP. The productivity gap between the formal and informal sectors is staggering, and it does not shrink naturally with overall growth.

Share of Workforce in Formal Employment. India vs Brazil. 2000-2023

Brazil is itself a country with significant informality, but its formal sector share has grown meaningfully since the early 2000s, driven by the expansion of the Bolsa Família program, minimum wage policies, and labor formalization drives. India, by contrast, saw its already small formal sector shrink as a share of total employment after demonetization in 2016 and the disruptions of COVID-19. The gap between the two countries on this metric is instructive.

Inequality: When Growth Passes People By

India’s Gini coefficient – a standard measure of income inequality – has risen over the reform era even as aggregate poverty has fallen.  It shows the signature of unequal growth. The bottom quartile has seen real income gains, but the top decile has captured a disproportionate share of the growth dividend. Recent estimates suggest that India’s top 1% now hold a larger share of national income than at any point since Independence.

Income Distribution India vs. Brazil.

Compare this to Brazil, which, despite its own severe inequality, pursued deliberate redistributive policies through the 2000s with Bolsa Família reaching 14 million families at its peak and a concerted minimum wage policy. India’s equivalents – the MNREGA rural employment guarantee, PM-Kisan farm payments are larger in coverage but smaller in benefit size at this stage, and reach informal workers imperfectly.

The Structural Complications

A purely data driven analysis, as Bittencourt himself acknowledged for Brazil, understates the depth of the challenge. India’s informality is not simply a policy failure, it is rooted in structures that predate modern economics.

The caste system, legally prohibited but still socially persistent, has historically sorted populations into occupational roles and those at the bottom of the hierarchy were systematically excluded from property ownership, formal education, and credit. Colonial de-industrialization destroyed the artisan economy that might otherwise have been a pathway to formal employment. The fragmentation of the federal system with 28 states running effectively different labor markets, land acquisition regimes, and social programs means that a policy that works in Tamil Nadu may fail in Uttar Pradesh.

These are not excuses. They are explanatory variables that any honest growth analysis must include.

What Does Growth Theory Tell Us to Do?

The prescription is not mysterious. If informality is the barrier, then the priority is to make formal employment more accessible through labor law simplification, portable social insurance that follows the worker rather than the employer, and a genuine skill based learning infrastructure that reaches the rural poor.

If inequality is the barrier, then the priority is redistribution that enhances human capital at the bottom – not cash transfers alone, but the quality of the school your child attends and the clinic your mother can access. India has the architecture of such systems; it does not yet have substantive results.

The demonstrators on India’s streets – whether farmers in 2020-21, or youth protesting paper leaks, or contract workers demanding permanence – know this intuitively. They are not asking for charity. They are asking to be absorbed into the formal economy that has prospered around them.

Conclusion: Is India Still the ‘Country of the Future’?

The answer to the question is Yes, and it is both an achievement and an indictment. India has built a moon program and yet cannot reliably staff a primary school. It has produced the world’s most used digital payments system and left 200 million people without bank accounts until recently. It exports software engineers to Silicon Valley, while its domestic labor market cannot absorb graduates at scale.

Brazil, our comparison, has struggled with its own version of this duality longer. But Brazil’s welfare state, however fiscally stressed has created a floor. India’s floor is thinner, and the drop beneath it steeper.

Informality is not the destiny for any developing economy. South Korea was deeply informal in the 1960s, China was an overwhelmingly rural agrarian nation in 1980. Both made transitions through deliberate, state led investment in human capital and formal employment creation. The path is known. The question for India in 2026 is whether the political will exists to progress via focused programs, or whether fifty years from now someone else will write another article illuminating the same structural problems.

Article Notes:

Data sources include the World Bank World Development Indicators, ILO Labour Statistics, Transparency International Corruption Perceptions Index, ASER Centre (India), UNESCO Institute for Statistics, and IMF World Economic Outlook. Growth determinant categories follow Barro (2008) as synthesized by Bittencourt.

Copy and paste the text from AMT that you want to share

postN71

India Insider: The 8.2% Growth Mirage Needs a Reality Check

India Insider: The 8.2% Growth Mirage Needs a Reality Check

India is celebrating the 8.2% real GDP growth result for Q2 FY26, as if it has entered a new economic orbit. Politicians are claiming victory and media is packaging optimism. The narrative is simple: India cannot be stopped. But once we move beyond the headline, the number loses credibility. It rests on a broken deflator, a statistical gap that no one can trace, and data architecture that doesn’t consider half the economy. This is not a story of unstoppable growth. This is a story of statistical convenience.

The Production–Expenditure Divide

On the production side, the numbers look heroic. Manufacturing allegedly grew 9.1%, and financial and professional services posted more than 10% growth. Corporate India looks like it is flying. But when the same activity is measured from the expenditure side – who actually spends this income – the story weakens.

Private consumption at 7.9% is respectable, not outstanding. The real shock is government consumption, which contracted by 2.7%. A shrinking government should normally mute growth, not accelerate it. Yet the GDP shoots up. How does that make sense? It doesn’t unless the number is being propped up somewhere else – and this is the case.

₹1.63 Lakh Crore of ‘Unknown Growth’

GDP includes a category called ‘discrepancy’. It exists because the two methods – production and expenditure – never perfectly align. The discrepancy stands at ₹1.63 lakh crore ($18.2 Billion USD) which equates into roughly 3.3% of real GDP. That means a chunk of this 8.2% growth has no identifiable spender: No households. No firms. No government.

It is income without absorption. A statistical plug. When a number this large is called ‘discrepancy’, the headline becomes unreliable – suspicious. You cannot claim world beating growth when your own data admits it cannot explain where that growth came from.

Chart via the National Statistical Office

The Deflator Illusion

The next distortion is the nominal vs real GDP gap. Nominal GDP is growing at 8.7% and real GDP at 8.2%. A gap of 0.5 percentage points implies inflation has almost vanished. Every Indian knows this is not true. Costs did not collapse. Food inflation has not disappeared.

The explanation is mechanical: India still uses the Wholesale Price Index (WPI) to deflate nominal output. Global commodity prices fell, WPI softened sharply, and that flattening pushed up the real number. In other words, GDP grew because the denominator fell, not because production surged.

This creates a fiscal problem. The Union Budget assumed 10.1% nominal growth. At 8.7%, tax buoyancy will weaken, deficit targets become more difficult, and next year’s fiscal capability shrinks. Real GDP does not pay the bills, Nominal GDP does.

The Informal Blind Spot

India still cannot measure its informal economy accurately. Nearly half of GDP and employment sits outside the formal system, yet the NSO uses formal sector proxies such as corporate balance sheets, GST data, and financial flows to estimate the rest of the economy. If a small business collapses and a corporate giant expands, the data shows a net gain, erasing distress at the bottom which means real economic circumstances are not portrayed accurately for Indian citizens.

Agriculture grew at 3.5%, but it still supports 46% of India’s workforce. That means growth is concentrated in capital intensive and balance-sheet heavy sectors, not into areas that put cash into rural hands. A booming Nifty Index via the stock market does not translate into household prosperity.

An Economy Measured with Old Tools

India continues to measure GDP using a 2011–12 base year, an era before UPI (Unified Payments Interface), before fintech credit, before e-commerce, before gig workforces, before the pandemic rewired supply chains and consumption patterns. India is living in a digital economy, but measuring activity with analog instruments.

A shift to a 2022–23 base year, plus replacing WPI with a Producer Price Index, may finally align the numbers realistically. But until then, headlines are running ahead of bona-fide measurements.

India’s 8.2% print is impressive, but growth estimates that don’t reflect grounded realities produce illusionary optics rather than useful insights. For India to strengthen fiscal and economic credibility, measurements must capture households, labor markets, and productivity, not solely corporate outputs. Policy cannot be shaped by statistical ambiguity, it requires transparency and trusted data.

307

India Insider: The Need for Quality Jobs and Improved Safety

India Insider: The Need for Quality Jobs and Improved Safety

Recent data released from the Ministry of Labor Statistics depicts a worrying aspect of India’s labor market. Every second urban young woman in Bihar and Rajasthan is unemployed. Nationally, one in four young women remains without work. This reflects deep structural issues in India’s workforce and the job market’s inability to provide high-quality employment.

Industries in urban India are not generating enough decent jobs to absorb educated youth, especially women. Even when jobs exist, they are often of poor quality, lacking social safety standards and sometimes damaging workers’ health and well being.

Via the National Statistics Office of India Unemployment Data

A recent piece in The Diplomat, a magazine covering the Asia-Pacific region with current affairs, highlighted how workers trade off their health and welfare well-being for the opportunity of precarious living. If an economist like Robert Gordon, who wrote “The Rise and Fall of American Growth“, were to look at their lives, it would remind him of the 19th-century United States.

Migrant workers from Bihar and Uttar Pradesh toil in textile recycling plants under hazardous conditions for just ₹5,000 ($58.00) a month. Women form a significant share of this workforce, often assigned trivial tasks in unsafe factories. Many have developed asthma and tuberculosis after prolonged exposure to dust and poor ventilation.

The Rise of the Informal Sector

Formal workers generate an annual GVA (Gross Value Added) of ₹12 lakh, while informal workers produce just ₹1.4 lakh, according to the Annual Survey of Industries (ASI) and the Annual Survey of Unincorporated Sector Enterprises (ASUSE) 2022–23.

Neoclassical economics says wages reflect a worker’s productivity. But this logic collapses in economies like India’s, where a vast army like reserve of labor, keeps wages low – even when productivity rises.

Excess labor supply depresses pay across sectors, from private school teachers to gig workers. Many gig workers spend long hours to earn a modest income, without access to provident funds, health insurance, or paid leave. This precarity extends from India to the United States and Indonesia.

Statistics via Kuntala Karkun & Samriddhi Prakash, Pahle India Foundation

The Gap Between Law and Reality

India has strong labor codes, streamlined in 2020, yet they remain largely unenforced. Companies often ignore them due to cost pressures, effective lobbying, or weak state monitoring.

Economic growth without wage growth widens inequality and breeds social tension. For growth to be inclusive, wages must rise with GDP.

This demands more than redistribution. It requires the transformation of raising workers’ productivity, ensuring labor rights, and giving every worker their fair share of India’s prosperity.

post303

India and the U.S Govt Shutdown: Quick Market Thoughts

India and the U.S Govt Shutdown: Quick Market Thoughts

President Trump has been ramping up his claims that India is no longer going to buy Russian oil, he made a statement regarding this belief yesterday once again. As the White House threatened to initiate tougher sanctions against India, there seems to have been some movement towards a reconciliation between the two powerful nations.

The Trump administration is clearly trying to limit the amount of purchases of Russian oil by India to increase economic pressures on Russia, and reportedly India may be starting to actually buy less oil. India has certainly not stopped buying Russian oil in a maximum ‘fait accompli’, but if the nation continues to show a willingness to purchase less energy resources from Russia, this will go a long way in preserving a good U.S and India association. A stronger relationship between the U.S and India can achieve a vital economic and military correlation for the both nations. Improved friendlier tones from New Delhi and Washington D.C appear to have reassured investors in the Indian equity markets via highs currently being seen on Nifty 50, which are now within sight of apex values from late September last year.

Nifty 50 One Year Chart as of 23rd October 2025

India is a vital and important part of U.S policy as it attempts to also create pressure on China too. By maintaining political and business dealings with India, the U.S can and should look upon this joint relationship as a vast long-term strategic interest. India understands this as well. The ability of India and the U.S to remain ‘friendly’ allies, and the prospect of creating a vigorous economic and military partnership should be one of the U.S government’s essential missions.

India does have strong connections to Russia the past handful of decades politically and economically via its non-aligned status. India will certainly maintain its dialogue and sometimes cooperative dealings with Russia. However, if India and the U.S maintain a solid relationship with the prospect of increasing their economic and political ties this could substantially change dynamics on the Asian continent.

U.S Government Shutdown Since the 1st of October

The U.S government has now been shutdown for over three weeks as Republicans and Democrats remain stubborn about compromise. Both sides have made the shutdown a political game. While each party claims they are doing what is best for the nation and preach to their collective voting bases, the stalemate could start to have uglier effects regarding wages not paid for many U.S employees on the 1st of November.

Dow Jones 30 One Year Chart as of 23rd October 2025

A lack of government salaries not being dispersed will cause an economic hit via consumer spending and create at a minimum some temporary damage for GDP numbers. Remarkably, and to be clear about this potential impact, Wall Street hasn’t seemed to care yet, but this could start to change. As the U.S economy rumbles powerfully forward without a major downturn in the major equity indices, politicians appear to be comfortable acting like spoiled children on both sides of the aisles engaged in accusing the other side of misdeeds.

Likely to start changing attitudes among Republicans and Democrats in the next two weeks are the coming Federal Reserve’s FOMC Statement during the end of October, and voting results via key political races in the first week of November.

Wall Street wants clarity regarding interest rate outlooks for November, December and early next year. Investors might not get a clear picture from the Fed next week, taking into consideration the Federal Reserve will not have up to date official U.S economic data because of the government shutdown. Meaning the Fed will likely issue a 25 basis point rate cut on the 29th of October and say it is uncertain about the coming few months because it does not have enough inflation, employment and GDP information to form a concrete opinion. The joke of coarse being the Fed seldom seems to have a strong opinion, but now can use the government shutdown as an excuse.

And now for contemplation, let’s look at the election in NYC for Mayor. A bona fide socialist may get elected in New York City who carries the historically misguided and dangerous wisdom of a Marxist. The economic and social practices of Marxism have proven utter failures for over one hundred years consistently. If NYC suffers a victory from the socialist candidate running as a Democrat, Wall Street and many financial institutions based in the city will not react favorably.

In the meantime, U.S equity indices remain elevated, cautious and within sight of record highs. The Nasdaq, Dow Jones and S&P along with other financial assets are producing choppy dangerous conditions for day traders who are attempting to wager on daily changes and suffering from the cautious behavioral sentiment being generated. Investors who look towards the mid and long-term are likely more comfortable, but are certainly keeping an eye on what is going to transpire over the next two weeks. Gold and Silver have come off their speculative highs. Forex continues to create volatile conditions as financial institutions appear unready to make bold predictions about what the Federal Reserve will do into January 2026.
post262

India Insider: Booming GDP & Fragile Foundations of Growth

India Insider: Booming GDP & Fragile Foundations of Growth

India’s economic footprint on the global stage is expanding significantly each year. As the world’s largest democracy, the nation achieved a remarkable 7.4% GDP growth rate January to March of this fiscal year. Yet, beneath this impressive headline, job creation remains tepid, overshadowed by slowing foreign direct investments (FDI) and lower corporate investments from India’s domestic market.

Despite Prime Minister Narendra Modi’s initiative to attract manufacturing into India and boost jobs, the manufacturing share of GDP has stubbornly clung to 16% for the last decade. While India’s services sector accounts around 55% of GDP, the IT and allied services sectors contributes a mere 3-4% of total employment. Even after the last two decades in which India’s Asian neighbors have shifted labor force out of agriculture and into high scale manufacturing, 45% of India’s workforce still are employed in agriculture and aligned services constituting only 15-17% of GDP.

Speculative Capital, Excessive Credit and Rising Financial Risk

Between 2003 and 2023, India attracted approximately $275 Billion USD from foreign capital inflows, encompassing mostly equity and debt foreign portfolio investments. These capital injections are speculative in nature, primarily chasing returns in financial markets, rather than being directly invested into long-term productive infrastructure like manufacturing and export oriented industries.

Foreign Portfolio Investment into India 2003 to 2023

Interestingly, India’s public sector banks especially between 2008 and 2015 aggressively lent to infrastructure, real estate and capital intensive projects. The state owned banks tried to fill the gap left behind by private investors. A substantial share of these loans later turned into non-performing loans, exacerbating a duel crisis as corporate and bank balance sheets came under severe stress within a few years. The government of India stepped in and injected 3.1 lakh crore Rupees ($45 Billion USD) to recapitalize the struggling banks, and also orchestrated mergers of weaker banks with stronger banks. India’s citizens helped cover these costs via higher taxes and hidden banking charges.

Reserve Bank of India: FX Reserves and Liquidity Dynamics 

As of financial year 2025, the RBI’S Foreign Exchange Reserves stand at around $696 billion USD. While a stronger reserve buffer is crucial for maintaining external stability, the Reserve Bank of India’s purchase of foreign currency to build reserves leads to problems with domestic Rupee liquidity and creates liabilities for the RBI’s balance sheet. Unless it’s not fully absorbed via Open Market operations, it will end up as excess liquidity in the banking system.

Post 2020 and the Covid19 pandemic, loose monetary policy and excess liquidity within the banking system has culminated with more reckless lending. Unsecured retail credit particularly in personal loans, credit cards and consumer finance is troubling. Non-banking financial companies (shadow banking) and fintech enterprises also expanded rapidly into this segment and now pose risks.

India Falling into Debt Trap 

Per a recent survey conducted by the RBI,  household financial savings have sharply declined to a five decade low of 5.1% of GDP in FY2023, down from 11.5% in 2021. Concurrently, household liabilities have risen, particularly in the unsecured credit segment.

Delinquencies in small ticket personal loans and “Buy Now, Pay Later“ programs are on the rise, prompting the RBI to intervene recently with tightening of personal loan norms in late 2023. This dynamic suggests that excessive credit creation, unaccompanied by productive or real income growth, is fueling a fragile boom in consumption backed predominately by debt especially among middle and lower income groups.

Lower Net Foreign Direct Investment amid Higher Repatriation

Even with coordinated efforts from the likes of Apple, Foxconn (Hon Hai Technology Group) and other electronics companies setting up facilities, and the assembly of manufactured goods like iPhones as part of the “China Plus“ strategy, a more comprehensive method of doing business and improved proactive FDI policy is needed. Overall results are still falling short. Evidence shows many companies continue to choose Vietnam and Mexico over India, which is clearly reflected in the lower net FDI figures in India’s Balance of Payments. In financial year 2024-25, net FDI fell 96% to $353 million USD, caused by a surge of money being repatriated out of India led by foreign companies, and also increased foreign investments by Indian companies to other nations, per the Hindu magazine.

The irony is that India needs foreign capital to finance its current accounts deficit, long-term capital investment would boost jobs and increase wages. As the central Indian government practices an austerity drive and its corporations show an unwillingness to invest, India needs higher foreign capital at this crucial juncture. How will India achieve this task? Without better employment and raising wages, India’s celebrated growth faces risks from underlying cracks.

post236

Examination Time: Nasdaq 100 and Trump Behavioral Sentiment

Examination Time: Nasdaq 100 and Trump Behavioral Sentiment

Nasdaq 100 Six Month Chart as of 25th March

Near-term trading in the Nasdaq 100 will face an examination of behavioral sentiment today and the remainder of the week. The stock index finished yesterday’s trading around 20,180.44, essentially traversing near levels directly before the U.S election results were known on the 5th of November. When trading reopened on the 6th following Donald Trump’s victory, the Nasdaq 100 jumped higher and began its trading near the 20,560.00 vicinity.

On the 29th of October 2024, the Nasdaq 100 also tested the 20,560.00 ratio, before reversing lower and finding choppy conditions leading up to the election date. Behavioral sentiment was certainly a factor in the outcome of these results. It cannot be proven, but can be asked and guessed that financial institutions may have started to bet on a Donald Trump victory before the election. Big trading influences may have turned anxious in the immediate days preceding the vote, then after the results were known returned the Nasdaq 100 to highs seen the week before on the 29th of October. By the 7th of November the Nasdaq 100 was trading above 21,100.00 and this was likely a result of optimistic outlooks.

The ability to climb back above the 20,000.00 mark yesterday and sustain the level was important. Yes, if the mark fades and another downturn now occurs it will show financial institutions are still leaning into negative outlooks as they consider the implications of tariffs and potential knock-on effects from the unknown.

However, if financial institutions have decided that they have priced in maximum risk premium and the selloff of the Nasdaq 100 to the level of nearly 19,150.00 seen on the 11th of March, which tested ratios last seen in early September 2024, was extremely oversold. We then have evidence that yesterday’s results back to values seen on election day, set the table for an important examination of behavioral sentiment.

There is plenty of room to traverse from 20,180.44 to 20,560.00. Yet, if financial institutions have decided that they once again want to test optimistic mid and long-term outlooks, the price level of 20,560.00 is where they will likely aim. Day traders should not get overly ambitious and remain cautious while looking for upside momentum if that is their chosen direction.

U.S economic numbers will be light today. Tomorrow the monthly Core Durable Goods Orders data will be published, the results will be of interest because they will show manufacturing sentiment and the statistics are considered a leading indicator. Thursday will also be noteworthy because the Final GDP results will be brought forth, but because this data is based on quarterly factors, the data may not be as important as tomorrow’s opening act – the Core Durable Goods Orders.

While the economic data will be important, President Trump will remain the focus. Behavioral sentiment obviously is being swayed by the winds circulating from the White House. This is not going to change until financial institutions begin to believe the threat of rhetoric can be dismissed without fear. The 2nd of April is now being counted down and in the sights of financial institutions as they consider the implications and outcomes of tariff negotiations. The word ‘agreement’ is sought as a salve by financial institutions. Whether a soothing ointment will be provided remains unknown.

The near-term will provide a test for traders which may be quite a bit like the week before the U.S election from late October and into November 5th when the voting results were still being counted. The Nasdaq 100 has room to traverse upwards and test values from the 29th of October and after Donald Trump was elected President. The 2nd of April is next Wednesday, and trading up until then will reflect on the outlooks financial institutions have regarding tariff negotiations.

It is examination week. It is not a coincidence that the price levels of the Nasdaq 100 are treading water while waiting for impetus. Speculating on the outcome before the 2nd of April needs to be undertaken carefully. An important question each speculator (including financial institutions) taking this test must answer is this: How good is President Trump as a negotiator and will he be able to claim a victory on the 2nd of April?

postR186.1

Risk Appetite: Forex and Equities and Cautious Optimism

Risk Appetite: Forex and Equities and Cautious Optimism

Day traders can clearly see that risk appetite has taken hold of behavioral sentiment early this week. USD centric price action has created highs for the British Pound, South African Rand, Singapore Dollar and a host of other major currencies paired against the USD. Yesterday’s poor showing via the CB Consumer Confidence reading in the U.S poured additional fire onto the notion the U.S economy is not doing as well as Fed Chairman Jerome Powell expressed last week, which means caution should be used when looking at the broad markets. Speculators who only make short-term wagers cannot let blind optimism be the guiding light.

USD/SGD Three Month Chart as of 25th Sept. 2024

While today will be thin with economic data, Thursday’s Gross Domestic Product results could prove to be another ignition switch for market impetus. The quarterly Final GDP result is widely expected by analysts to produce a gain of 3.0%. The Final GDP Price Index statistics are anticipated to show a 2.5% ratio. If the growth and inflation numbers miss their marks this could set off a momentary storm in the markets. A good example of trading that has already been baked into the cake regarding values and mid-term outlook is the USD/JPY, which while maintaining its bearish stance has clearly found a price realm financial institutions are now maneuvering carefully within as equilibrium is battled.

GBP/USD Three Month Chart as of 25th Sept. 2024

Yet, many financial institutions have clearly leaned further into their optimistic stances particularly via the U.S major equity indices and day traders are likely trying to follow the momentum being generated. Yes, New Home Sales will be published in the U.S today, but these numbers carry a lot of complex considerations which analysts tend to dissect in a myriad of ways, meaning that while they will get some attention, the largest players will stay focused on tomorrow’s growth and inflation data coming via the U.S GDP outcomes.

USD/ZAR Three Month Chart as of 25th Sept. 2024

Forex traders should keep an eye on U.S Treasury yields, yesterday’s slight climbs early in they day were mostly met by reversals lower later on. There is also the knowledge that the yields are traversing long-term depths and there is an assumption they don’t appear ready to see a large shift in momentum. The Federal Reserve is widely expected to cut the Federal Funds Rate again in November by another 0.25%. Numbers via reports like tomorrow’s GDP statistics, and Friday’s Core Personal Consumption Expenditures Price Index will shake existing behavioral sentiment and the Fed’s outlook. The Core PCE number has an estimate of 0.2% per its monthly reading, the last three reports have met expectations.

USD/JPY Three Month Chart as of 25th Sept. 2024

Fed Chairman Jerome Powell will speak tomorrow at the U.S Treasury Markets Conference in New York, but his remarks will have been pre-recorded and presented via video. Treasury Secretary Janet Yellen will also speak afterwards at the meeting. However, their thinking is widely known and they are expected to sound rather tame. It also needs to be added that both Powell and Yellen are fully aware the U.S Presidential election is approaching. Neither one of them is going to risk saying something that can be interpreted as economically defiant.

Traders should expect the potential of volatility developing tomorrow as financial institutions and larger market participants position for the GDP reports, but if the numbers are within sight of expectations, it is likely current price equilibriums will continue to reflect current risk appetite dynamics. Proper risk management and the use of conservative leverage should be fully practiced. Retail traders should also begin to start considering that Non-Farm Employment Change data that will come from the U.S on Friday, October the 4th. The jobs numbers next week could pose a significant threat.

The Fed last week made it clear they believe there was reason to lower the Federal Funds Rate (while playing catch up) and there is the potential to enact further dovish actions in the months ahead. However, Jerome Powell also insisted – paraphrasing – the U.S economy is rather strong and added this is being reflected in solid growth statistics and a jobs market which may be weaker but remains stable.

Given the Fed’s propensity for a conservative approach, they have crawled out a rather precarious limb regarding their rather positive attitude. The coming economic data will certainly be noteworthy tomorrow and Friday, and via next week’s job numbers. Will optimistic equilibrium in Forex prevail over the next week? The major currency pairs will certainly be tested.

postR185.1

Fed Plays Catch Up and Sets a Calm Table for Day Traders

Fed Plays Catch Up and Sets a Calm Table for Day Traders

The Fed essentially played a game of catch up on Wednesday when they cut the Federal Funds Rate by 0.50%. The interest rate cut was bigger than AMT expected because of the Fed’s rather cautious stance the past handful of years. However, the move by the FOMC was certainly justified and welcomed, and now financial institutions have been given what most thought was bound to happen, a roadmap to at least a 0.75% Federal Funds Rate cut over the next six months. Longer term many believe the Fed will continue to be aggressively dovish if U.S economic conditions cooperate.

USD/JPY One Year Chart on the 20th of Sept. 2024

Traders certainly seem to be leaning into the notion another 0.25% will be trimmed by the Federal Reserve in November. And this sets the table for day traders to now face potentially calmer market conditions that react solely to economic data, geopolitical events and the occasional flashes of news. The U.S presidential election will certainly be a big event on the 5th of November. Long-term investors are likely feeling rather tranquil and have not been surprised. Behavioral sentiment over the next month should be easier to gauge.

USD Cash Index One Year Chart on the 20th of Sept. 2024

So what happens near-term? The Bank of Japan today, like the BoE yesterday, stood in place. The USD/JPY is trading near 142.300 as of this writing. The GBP/USD is near 1.32890. Gold is hovering near 2,600.00 and WTI Crude Oil is approximately 72.00 USD. Perhaps short-term traders should keep one eye on the Middle East this weekend, but for the moment it doesn’t appear a major escalation is about to ignite in the region. Yes, there is saber rattling, but composure may actually prevail. Those looking for a sudden emergence of a strong USD trend may find that headwinds keep the greenback within the lower realms of the USD Cash Index.

Gold One Year Chart on the 20th of Sept. 2024

Next week’s U.S GDP numbers on Thursday the 26th, and the Core PCE Price Index results on Friday the 27th will get plenty of attention. What the Fed and financial institutions would like to see are stable economic numbers which do not spark fears of a recession. The almighty ‘soft landing’ being pursued by the Federal Reserve is likely being hoped for too by financial institutions via their mid-term outlooks.

The Federal Reserve is supposed to be an independent entity not associated with the Executive Branch of the U.S government regarding oversight. There has been some bantering about the potential that the Fed cut by 0.50% before the U.S elections and Powell proclaimed the U.S economy is doing well to help the Democrats, but this is unlikely. Conspiracy thinking aside, the broad markets are now going to be a barometer regarding economic outlook based on data such as growth, jobs numbers and inflation; clarity regarding a more dovish Fed has been delivered in many respects, data has to justify their decision moving forward.

Day traders may have the ability to follow their technical charts and gather behavioral sentiment perspectives over the next month serenely by watching barometers like gold and U.S Treasury yields. As the U.S election draws closer financial institutions may start to position for potential outcomes, but with polls indicating a tight race currently they would be foolish to bet on one particular outcome. Meaning the broad markets including equity indices, Forex, U.S Treasury yields and even commodities may be moving within fairly priced equilibriums for the moment.

As the Dow 30 and S&P 500 move within record heights, the Nasdaq 100 is slightly below its all-time highs. Yet, it should be remembered the Nasdaq 100 still has done remarkably well the past year and although not at an apex level has the potential to scale upwards quickly. Optimism for the moment seems to be driving the financial markets and day traders should keep this in mind. However, speculators should remember risk management is essential, not over leveraging ideal, and keeping realistic price targets remains always important.

postR180.1

Summer Optimism as Forex and Equities Focus on Fall Outlooks

Summer Optimism as Forex and Equities Focus on Fall Outlooks

Fed Chairman Jerome Powell admitted the obvious at the Kansas City’s Fed’s Jackson Hole Symposium last Friday. The realization the U.S Federal Reserve is going to cut interest rates confirmed what many financial institutions had positioned their trading desks for via forward cash Forex contracts over the past month.

USD Cash Index One Year Chart on the 27th August 2024

The USD has been expected to grow weaker by many people because most knew the Fed would have to state a September rate cut would be delivered. The question that was also somewhat answered is the notion if the Fed will also cut in November. Though Powell certainly did not say a rate cut would happen in November, his rhetoric made it clear the Federal Reserve is considering a dovish perspective which could translate into additional cuts down the road.

The Fed has been criticized for being too passive and while Powell can be congratulated for his rather unemotional Federal Reserve leadership, he and the Fed can certainly be faulted for not reacting quickly enough to ‘transitory’ inflation and then not responding until this past weekend to the need for cutting interest rates with dovish rhetoric. Let’s also remember the U.S Treasury (government) is on the line to pay exorbitant costs for debt repayments because of bad U.S fiscal policy.

As an interesting related side note, the head of the Brazilian Central Bank, Roberto Campos Neto, made a strong appeal for governments to be fiscally responsible while speaking at the Jackson Hole Symposium this past weekend. While he could have been talking to any number of nations regarding spending, his points were obviously meant to highlight his disagreements with the Brazilian government led by Lula da Silva and the Workers Party. Roberto Campos-Neto stated that approximately 50,000,000 (yes, million) people in Brazil receive government allowances, while only about 43,000,000 people are earning money via employment and business enterprises. Traders who want to keep an eye on the USD/BRL this week may be entertained by the potential volatility within the currency pair which is trading a hair below 5.5000 before it opens today. The USD/BRL has certainly not been correlating to broad Forex USD centric weakness, and demonstrates the internal domestic fight between Lula da Silva and the Brazilian Central Bank regarding fiscal policy.

Jobs data from the U.S has continued to turn negative, particularly via revised reports which are being published rather ‘quietly’ as election season approaches. Yet, financial institutions have been aware of the weaker jobs numbers. While the poor jobs numbers combined with eroding inflation is good for USD centric weakness due to the knowledge the Fed will have to reverse from its rather high interest rates, the question becomes how much per the financial institutions selling of the USD has been acted upon in Forex. Is the USD oversold for the time being? It depends on trading timeframes certainly.

Weaker USD centric positions will need more impetus for further bearish trajectories to be seen near-term. Financial institutions may believe equilibrium is being approached, this because it appears interest rate cuts equaling a 0.50% decline seem to have been factored into Forex. Will the Federal Reserve be put into a position in which they will be able to cut by a full basis point (-1.00%) over the next six months?

Gold Six Month Chart on the 27th of August 2024

Gold is trading near 2,500.00 plus at the time of this writing. Gold has touched higher levels in the past week and is getting a round of applause from its throngs of believers who proclaim the precious metal the ultimate safe haven against inflation and erosion fears via fiat currencies – including the USD. As a reminder, Bitcoin is highly speculative and doesn’t have the historical (thousands of years) track record that gold has acquired.

GBP/USD Five Year Chart on the 27th of August 2024

The EUR and GBP are traversing higher territories not seen in a while. The EUR/USD is near the 1.11700 level, which was last traded in July of 2023, and it has been since 2022 that sustained prices above this current realm have been traded. The GBP/USD is near 1.32000 and is within a value ratio last seen in March of 2022. Central banks will remain in focus as summer ends and the fall trading season gets underway. The ECB will release their Main Refinancing Rate on the 12th of September, the Fed will present the Federal Funds Rate on the 18th, and the BoE will follow suit with the Official Bank Rate on the 19th.

However, those September dates are still a few weeks away and financial institutions do have data this week which could stir Forex, equity indices and U.S Treasuries in the near-term. Day traders often do not have the ability to rely upon mid and long-term outlooks, and instead have to be content with trying to ride the momentum trends being caused by larger players. While the USD weaker outlook is tempting to rely upon, speculators who are looking for quick hitting wagers need to judge technical charts and try to grasp existing behavioral sentiment which can shift rapidly depending on lengths of time.

Traders should remember the U.S will celebrate its Labor Day holiday next Monday, which sets the stage for potential sudden volatility to flourish before big financial institutions in the States leave for their long weekend. The last week of August should be rather tranquil. Certainly most long-term investors feel as if they have more clarity regarding interest rates and will be able to relax. The hope is that the current calm is not the quiet before the storm due to lingering political issues in the U.S, France and elsewhere. And that escalation of the Ukrainian and Russia war, and the Middle East conflict do not cause sudden surges of bedlam.

Economic data events the remainder of this week that should be given consideration includes the U.S CB Consumer Sentiment reading today. Yesterday’s U.S Durable Goods Orders came in with mixed results as the Core number fell by minus -0.2%, but the broad number came in with a substantial gain of 9.9%.

USD/JPY Three Month Chart on the 27th of August 2024

The Bank of Japan has published their Core CPI data today and the outcome came in below expectations with a gain of 1.8% compared to the estimate of 2.1%. The USD/JPY is trading near 144.790 at the time of this writing as it continues to show bearish tendencies. The Bank of Japan which was heavily criticized in many circles may actually be achieving what they have planned, this as they have tried to stimulate stronger export and confront inflation. Their battle is not over yet.

Australian CPI data will be published on Wednesday. And on Thursday, German Preliminary Consumer Price Index numbers will be released. The EUR/USD could react to this report, but the European Single Currency remains highly USD centric. Which sets the table for the U.S Prelim Gross Domestic Product report also on Thursday. The growth number from the U.S could diminish selling considerations for the USD if the report comes in stronger than expected. However, the GDP Price Index and weekly Unemployment Claims from the U.S could also impact short-term behavioral sentiment and cause a bit of turbulence if negative results are published.

Friday will see more CPI numbers from Japan, CPI and GDP numbers from France, and GDP data from Canada. But before going into the long holiday weekend the U.S will present one more major report with its Core PCE Price Index and the monthly statistic is expected to show a slight gain of 0.2%.

China watchers will get Manufacturing PMI numbers early on Saturday. Recent China data continues to show signs of economic stress regarding foreign investment, domestic consumer spending, and deflationary results. Buyers beware.

postN38.1

Reactions and Risks as Trading Clarity Remains Hard to Grasp

Reactions and Risks as Trading Clarity Remains Hard to Grasp

While many U.S government officials try to shrug off the downgrade of U.S Treasuries by Fitch Ratings last week, a warning shot has been fired regarding U.S spending and the nation’s growing deficit. Janet Yellen and others may believe the downgrade should not have happened, but the prospect that the U.S golden goose is going to stop eventually producing enough eggs is a realistic viewpoint from Fitch. Risk adverse trading on the news was seemingly sparked from the U.S Treasuries downgrade, while many prominent figures including Warren Buffet have claimed they are not worried. However, one thing that the downgrade did was certainly create more clouds for financial institutions which have already been suffering from a lack of clarity the past three weeks.

U.S economic policy remains troubling regarding its spending, and while the government believes its bonds will remain the best in the world for the foreseeable future, it would certainly help matters if responsible ‘adults’ would be allowed a voice regarding stimulus, expenditures and debt ceiling concerns. The U.S has been warned, but with a major presidential campaign approaching on the horizon, more promises to the U.S public will likely carry greater long-term costs.

Gold One Week Chart as of 8th August 2023

While the USD did get stronger across Forex and gold finished last week near lows, some major currencies finished Friday with slight reversals higher against the USD before going into the weekend, based on the weaker than anticipated Non-Farm Employment Change outcome. However, Average Hourly Earnings came in slightly higher. The rise in wages for employees wasn’t expected, but the gains via the inflation number may not have been considered significant enough to cause a panic.

Day traders trying to navigate through the news of the ratings downgrade and the mixed jobs numbers from the U.S may have gotten ripped apart from the volatility late last week. Forex brokers likely had a good week if the majority of their speculators were ‘B’ book – virtual – traders. Survivors of last week’s dynamic price action should be aware that financial institutions do not have the best of outlooks for global central banks. This week’s coming data may help a bit, but trading could also remain rather dangerous and churn volatility.

Global Outside Influence to Give Attention:

Although Niger may seem like a world far away for most day traders, they should keep an eye on the developments of the African nation. A military coup has gotten the attention of global powers and there are threats of military intervention rattling. France, the U.S and Nigeria and other ‘Western’ leaning nations have a stake in the Niger drama, on the other side is Russia and its Wagner affiliated mercenaries. The potential for a war to to start in this landlocked northern African nation appears to be growing. A conflict in Niger could include a wide range of competing sides and create loud rhetoric and hyperbole. It could also cause uncomfortable feelings at the BRICS summit scheduled to begin on the 22nd of August in Johannesburg, South Africa.

GBP/USD One Month Chart as of 8th August 2023

Monday, 7th of July, U.K Halifax Home Price Index – this data is expected to remain rather stable, but the past three results have been negative. Mortgages are getting expensive in the U.K and the pressure added from higher interest rates is not helping. The GBP/USD could react briefly to this outcome.

Monday, 7th of July, E.U Sentix Investor Confidence – the reading is anticipated to be worse than last month’s outcome regarding investor outlook. The past three months have been negative. The E.U is certainly facing recessionary pressure. Oddly enough, a poor outcome could spur on the belief the ECB may have to become less aggressive regarding their higher interest rates. The EUR/USD may see a flurry of reactions from this report.

Tuesday, 8th of July, China Trade Balance – the results will get plenty of attention because recent economic data from the nation has been troubling. Export demand is important for China’s economy.

Tuesday, 8th of July, Germany Final Consumer Price Index – the result is expected to match the forecast of a 0.3% gain. This inflation report will be watched by EUR/USD, but if expectations are met this could create rather consolidated trading until Thursday for the currency pair.

Wednesday, 9th of July, China CPI – the inflation data from the nation will be watched by global investors. Recent statistics from China have signaled concerns about ‘deflation’. An outcome of minus -0.5% is expected. Economic issues are shadowing China, this as it remains active in global affairs.

Last week Argentina announced China helped facilitate a ‘bridge loan’ for the South American nation so it could make a repayment to the IMF. Rising economic concerns in China could start to squeeze its ‘cash power’ as it tries to gain influence globally by pumping Yuan (CNY) into international finance. China has certainly been bold and is playing a ‘long game’, because its choice of Argentina as a nation to help can certainly not expect to produce short-term financial gains.

Thursday, 10th of July, U.S CPI – Consumer Price Index results from the States will cause potentially dynamic broad market movement. Inflation is expected to match last month’s rise of 0.2% via the broad and core numbers. However, traders should note that some analysts have voiced concerns rising energy prices the past month will hit the inflation numbers, if this occurs it could spark a volatile USD. Higher Crude Oil prices combined with a streak of U.S hot weather may create an intriguing outcome. Risk management should be used by day traders who are wagering in the markets as the CPI readings are released.

Friday, 11th of July, U.K GDP – the Gross Domestic Product numbers will be important immediately for the GBP/USD. Although last month’s outcome was slightly stronger than anticipated it was still negative with a minus -0.1% reading. The growth number this time around is expected to gain 0.2% per the monthly report.

Friday, 11th of July, U.S Producer Price Index – economic numbers from the States have been mixed recently. These inflation numbers are expected to show a slight rise, if the outcome meets expectations – the broad markets may remain calm. However, if inflation is stronger than expected, the result could set off fireworks if the outcome sets off fears about the U.S Fed maintaining it hawkish rhetoric.