Hospitalization Costs 20260421

India Insider: Rising Hospitalization Costs a Growing Concern

Indian Households Face Rising Expenditures for Hospitalization and Critical Care

Many households in India face unexpected hospital expenses that have become almost routine in today’s environment. Rapid urbanization, unclean drinking water, poor air quality due to carbon emissions and industrialization have hit low and middle income homes harder than upper income families. These households are increasingly exposed to diseases that require critical treatment, but the government institutions are ill-equipped to handle the growing patient loads. As a result, many Indians are forced to seek treatment in private hospitals, where costs are significantly higher.

Consider that a middle income household in Madurai earns roughly between 15,000 to 20,000 Rupees per month per person. This per the Periodic Labor Force Survey 2023-2024 Annual Report. So if two people are working in a family, it means empirically, we can estimate the income between 35,000 to 40,000 per month. We need to compute the family’s expenditures – if one member is hospitalized for critical illness or gets hospitalized treatment in private and public hospital.

Even if the income range for this family is better than median estimates, their capacity to absorb medical shocks are limited due to high baseline consumption and minimal household savings.

In the case of hospitalization in a government facility, out of pocket expenditures such as medicines, diagnostics, transport, and wage loss can amount to 12,000 to 40,000, effectively deducting one to two months of household income.

In other words, families need to spend out of pocket by borrowing to finance these gaps for consumption and medical expenses.

However, if a family is forced to take treatment in a private hospital, they would be spending 100,000 to 500,000 Rupees in critical cases, their total spending as a higher percentage of net income and is close to 1,250% in extreme cases.

The Role of Savings and Informal Safety Nets

As observed during Covid-19 and other crises, Gold has often acted as a financial buffer for Indian households.

Families that save during stable periods are able to pledge or sell gold in times of distress, helping them to manage medical expenses without relying entirely on high cost borrowing.

In contrast households without many buffers, often turn to informal lenders or personal loans, where interest rates can range between 36 to 60% compounding the financial distress.

Looking at Government Data for Clues

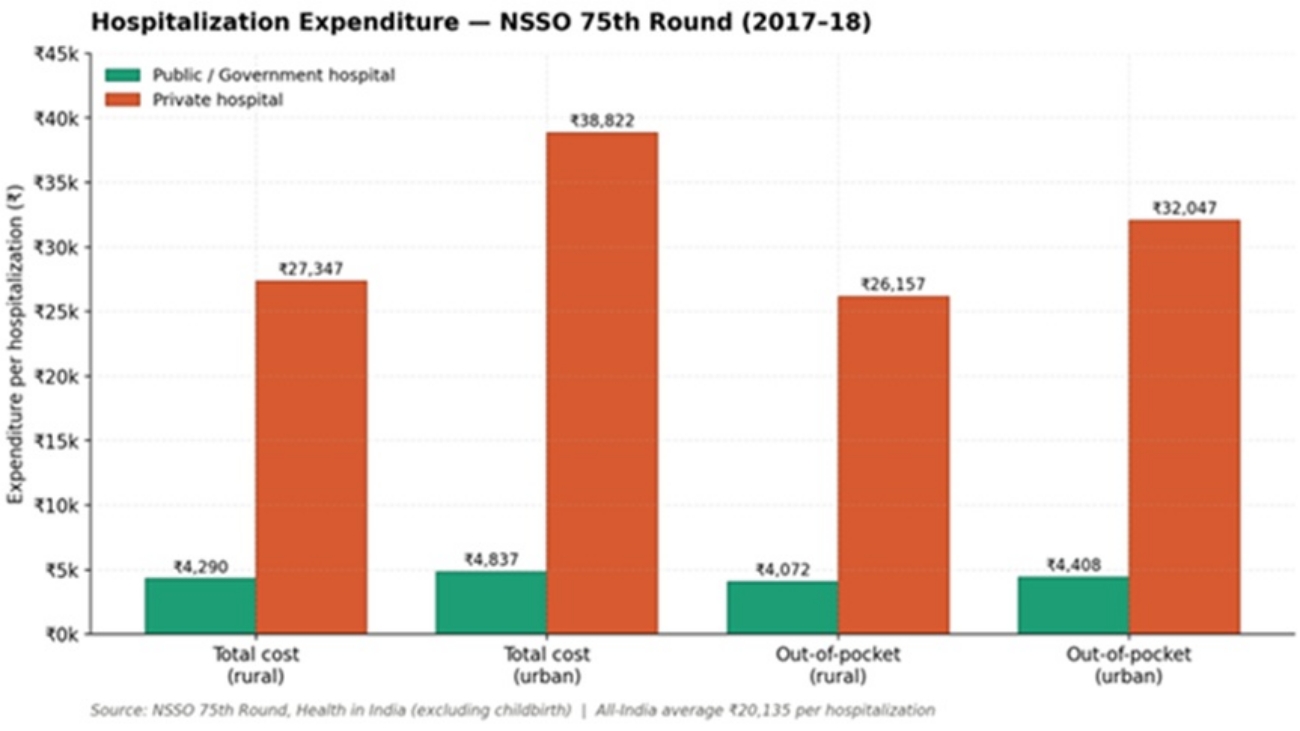
The most authoritative survey on household expenditures on hospitalization comes from National Sample Survey Office’s (NSSO) “Health in India” (2017-2018), and it showed the costs for those hospitalized in private facilities were eight times costlier than government facilitys.

An average hospitalization (excluding child birth) cost 4,290 Rupees in a rural government hospital, and 4,837 in an urban government hospital. The same scenario in a private hospital cost 27,347 in rural India and 38,822 in urban India. Out of pocket expenditures – the amount families pay themselves, follows the same pattern with families having to pay out about 4,000 Rupees in government hospitals, versus 26,000 – 32,000 Rupees in private ones.

Hospitalization Expenditure by Hospital Type and Sector, NSSO 75th Round (2017-2018). Source: MoSPI, Ministry of Statistics.

These were already catastrophic figures for a typical household in 2017-2018. A single private hospital admission cost more than a month’s wages for most Indian families, and it is getting worse.

Seven Years of 12-14% Medical Inflation

Since 2018, the cost of being hospitalized in India has risen at a pace that outstrips almost every other category of spending: Millman’s 2025 medical inflation report pegged the rate at 12% in 2024, more than triple the general CPI inflation of 4.2%.

An urban private hospital admission that cost 38,822 Rupees in 2017-2018 now is in a 76,000 – 91,000 price range, this while real wages are stagnant and not growing. Recent RBI Household surveys conclude that Indians absorb higher debt in order to manage their household expenses.

Critical Illness Can Wipe Out a Household’s Future

Critical illness like heart attacks, a cancer diagnosis, renal failure, kidney transplants costs even more in India – and the problems grow unbearable for Indian families after they are forced to take on more debt. For example, a heart angioplasty with stent that costs 100,000 in 2018 now costs between 200,000 – 300,000 Rupees in private hospitals.  A kidney transplant which costs 400,000 – 600,000 a decade ago now costs 1 million to 1.5 million Rupees. A full course of chemotherapy ranges from 250,000 for early stage diseases to 2.5 million Rupees for advanced cases requiring targeted biologics.

Cost ranges for major critical illness in India, 2024-2025, green bars show public hospital costs, orange bars show private hospital costs. Sources: ACKO India Health Report 2024, HCG Oncology, Hospital Quote Data from Apollo, CARE and others.

Where the Indian Household Stands

As per periodic labor force surveys, the median Indian worker earns 10,000 Rupees a month. The Economic Survey in 2024-2025 recorded average monthly earnings of 13,279 for self-employed workers, 20,702 for salaried workers, and 12,750 for casual laborers. Crucially, only the top 22% of the India’s labor force earns more than 15,000 Rupees per month.

Monthly household income distribution, rural vs urban India (2023-2024). Sources: Periodic Labor Force Surveys, Azim Premji University Income Distribution Study 2019-2024.

Statistically, the household we have taken for the reference is not a poor household by national standards. It is comfortably above the rural and urban median, sitting in the top fifth of the country, and this is what makes the rest of the story so troubling. If this household cannot afford a critical illness, almost no household outside the urban upper middle class can afford rising hospitalization costs.

The Insurance Gap

The government of India has expanded insurance schemes for low income households since 2018 via the Ayushman Bharat PM-JAY with 500,000 Rupees coverage. But the scheme which was set many years ago, does not match the current medical costs scenarios. Income eligibility is an another problem where a majority of people who earn in the middle, slip out of the government insurance schemes and have to take private insurance to cover their health risks. Health insurance penetration in India is low at 3.7% of GDP, well below global statistical standards of 7%.

Across much of India, a single critical illness can effectively destroy years of household income accumulation and trigger debt dependence. In the absence of stronger public healthcare delivery, and without deeper insurance penetration at affordable costs providing better claims services, and lacking robust risk sharing mechanisms – escalating medical costs could act as a drag on India’s economic growth trajectory by weakening household balance sheets.

Notes: 1 USD = 93.24 INR
Copy and paste the text from AMT that you want to share

India Insider GDP Savings and Investment 20260408

India Insider: Education, GDP and Personalized Growth a Difficult Balancing Act

Is India Still 'The Country of the Future'?

In 1991, when India’s foreign exchange reserves had dwindled to barely three weeks of import cover, the government pledged its gold to the Bank of England. It was a moment of humiliation and, paradoxically, of liberation as the crisis forced an opening that three decades of socialist planning had resisted. Fast forward into 2025: India is a $4.1 trillion USD economy, the world’s most populous nation, with a moon rover, a thriving startup ecosystem, and a digital payments infrastructure the developed world now studies with envy.

This article asks if India is still ‘the country of the future’ using the same growth determinants framework applied by Professor Manoel Bittencourt to Brazil, and argues that the answer lies not primarily in corruption (though it matters), not in policy failure (though that matters too), but in two structural features that resist easy reform: the vast informality of the Indian economy, and the depth of its inequality.

Does Growth Matter? The 70/g Rule Applied to India

Before diagnosing India’s problems, we must appreciate what it has already achieved. Using the 70/g rule which tells us how many years it takes for income per capita to double at a given growth rate – India’s average GDP growth of roughly 6.5% since 1991 implies a doubling of income every 11 years. That is extraordinary by historical standards.

But averages mask distributions. If growth accrues predominantly to the formal sector – the top 10% of earners who hold formal employment, own financial assets, and participate in the organized economy, then the 70/g rule tells a story of elite enrichment, not a broad based development. This is India’s core dilemma.

The Eight Growth Determinants: India in the Data

Bittencourt’s framework identifies eight standard growth determinants: savings, fertility, rule of law, government consumption, trade openness, education and health investment, inflation, and finance. Let us examine some of each through Indian data, with Brazil as our comparator.

Savings & Investment

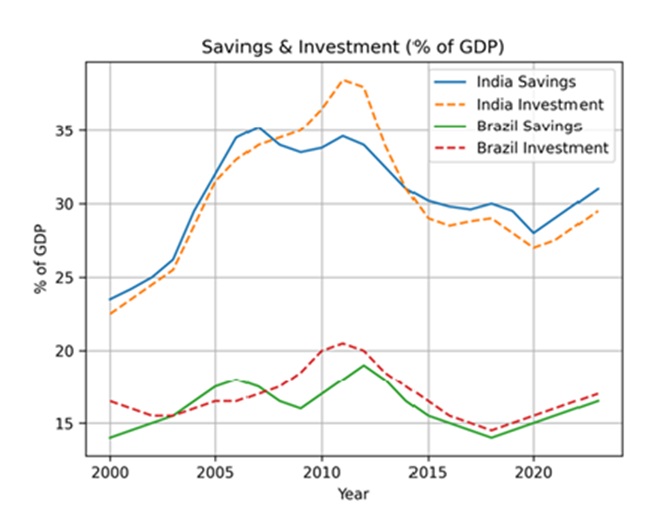
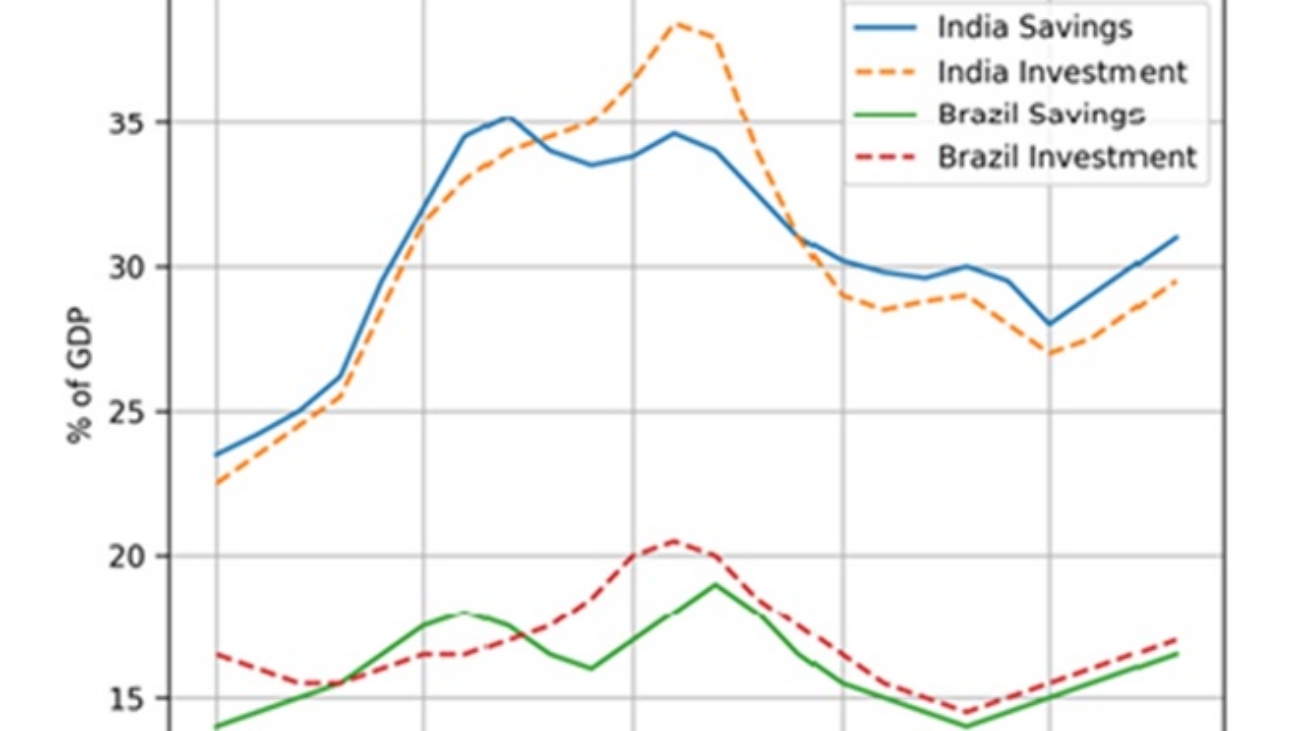
India’s gross savings rate has historically been a strength hovering around 30–32% of GDP through the 2000s and 2010s. But the investment picture is more troubled. Fixed capital formation has declined since its peak around 2011–12, driven by a stressed banking sector, weak private investment appetite, and an infrastructure gap. Brazil shows a similar pattern of savings-investment divergence  but India’s gap has widened more sharply in recent years.

Gross Domestic Savings and Fixed Capital Formation. India vs Brazil. 2000-2023

Education & Health Spending

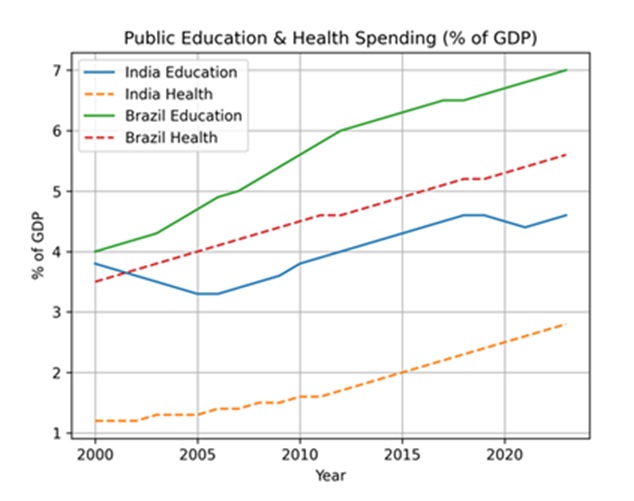
Perhaps nowhere is India’s “policy-delivery gap” more apparent than in social spending. India spends approximately 4.5% of GDP on education and just over 3% on health, and both figures are well below what comparable middle income countries invest. Brazil, despite its own fiscal struggles, consistently outspends India on health as a share of GDP. The consequences are visible in learning outcomes: the Annual Status of Education Report (ASER) consistently finds that a significant share of Indian schoolchildren cannot read a simple paragraph or perform basic arithmetic.

This matters enormously for growth. An economy hoping to absorb millions of workers into formal, productive employment each year needs those workers to arrive with usable skills. When they do not, informal low productivity employment becomes the default  and cycles of informality perpetuate.

Government Spending on Human Capital. India vs Brazil. 2000-2023

The Thesis: Informality as Structural Trap

Bittencourt identified corruption as the growth killer in Brazil. For India, the more precise diagnosis is informality and the inequality it both reflects and reinforces.

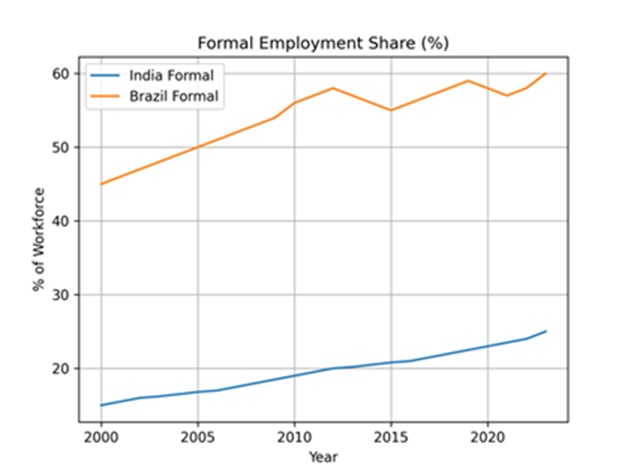
Consider the arithmetic: approximately 80% of India’s workforce is informally employed who are working without contracts, without social protection, without access to formal credit, and largely invisible to the tax system. This informal mass produces perhaps 50% of GDP. The productivity gap between the formal and informal sectors is staggering, and it does not shrink naturally with overall growth.

Share of Workforce in Formal Employment. India vs Brazil. 2000-2023

Brazil is itself a country with significant informality, but its formal sector share has grown meaningfully since the early 2000s, driven by the expansion of the Bolsa Família program, minimum wage policies, and labor formalization drives. India, by contrast, saw its already small formal sector shrink as a share of total employment after demonetization in 2016 and the disruptions of COVID-19. The gap between the two countries on this metric is instructive.

Inequality: When Growth Passes People By

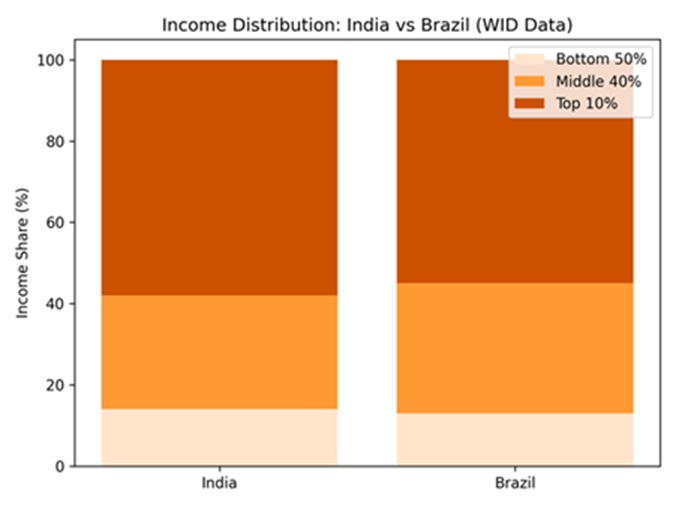
India’s Gini coefficient – a standard measure of income inequality – has risen over the reform era even as aggregate poverty has fallen.  It shows the signature of unequal growth. The bottom quartile has seen real income gains, but the top decile has captured a disproportionate share of the growth dividend. Recent estimates suggest that India’s top 1% now hold a larger share of national income than at any point since Independence.

Income Distribution India vs. Brazil.

Compare this to Brazil, which, despite its own severe inequality, pursued deliberate redistributive policies through the 2000s with Bolsa Família reaching 14 million families at its peak and a concerted minimum wage policy. India’s equivalents – the MNREGA rural employment guarantee, PM-Kisan farm payments are larger in coverage but smaller in benefit size at this stage, and reach informal workers imperfectly.

The Structural Complications

A purely data driven analysis, as Bittencourt himself acknowledged for Brazil, understates the depth of the challenge. India’s informality is not simply a policy failure, it is rooted in structures that predate modern economics.

The caste system, legally prohibited but still socially persistent, has historically sorted populations into occupational roles and those at the bottom of the hierarchy were systematically excluded from property ownership, formal education, and credit. Colonial de-industrialization destroyed the artisan economy that might otherwise have been a pathway to formal employment. The fragmentation of the federal system with 28 states running effectively different labor markets, land acquisition regimes, and social programs means that a policy that works in Tamil Nadu may fail in Uttar Pradesh.

These are not excuses. They are explanatory variables that any honest growth analysis must include.

What Does Growth Theory Tell Us to Do?

The prescription is not mysterious. If informality is the barrier, then the priority is to make formal employment more accessible through labor law simplification, portable social insurance that follows the worker rather than the employer, and a genuine skill based learning infrastructure that reaches the rural poor.

If inequality is the barrier, then the priority is redistribution that enhances human capital at the bottom – not cash transfers alone, but the quality of the school your child attends and the clinic your mother can access. India has the architecture of such systems; it does not yet have substantive results.

The demonstrators on India’s streets – whether farmers in 2020-21, or youth protesting paper leaks, or contract workers demanding permanence – know this intuitively. They are not asking for charity. They are asking to be absorbed into the formal economy that has prospered around them.

Conclusion: Is India Still the ‘Country of the Future’?

The answer to the question is Yes, and it is both an achievement and an indictment. India has built a moon program and yet cannot reliably staff a primary school. It has produced the world’s most used digital payments system and left 200 million people without bank accounts until recently. It exports software engineers to Silicon Valley, while its domestic labor market cannot absorb graduates at scale.

Brazil, our comparison, has struggled with its own version of this duality longer. But Brazil’s welfare state, however fiscally stressed has created a floor. India’s floor is thinner, and the drop beneath it steeper.

Informality is not the destiny for any developing economy. South Korea was deeply informal in the 1960s, China was an overwhelmingly rural agrarian nation in 1980. Both made transitions through deliberate, state led investment in human capital and formal employment creation. The path is known. The question for India in 2026 is whether the political will exists to progress via focused programs, or whether fifty years from now someone else will write another article illuminating the same structural problems.

Article Notes:

Data sources include the World Bank World Development Indicators, ILO Labour Statistics, Transparency International Corruption Perceptions Index, ASER Centre (India), UNESCO Institute for Statistics, and IMF World Economic Outlook. Growth determinant categories follow Barro (2008) as synthesized by Bittencourt.

Copy and paste the text from AMT that you want to share

Indian Diaspora 20260325

India Insider: Why the Gulf Remains a Vital Economic Lifeboat

Indian Expat Labour and Recalibration Realities

The skyline of Dubai, once a symbol of untouchable prosperity, now sits under a shadow of regional recalibration. As Reuters recently noted, Dubai has successfully transitioned to a non-oil economy, with oil accounting for less than 2% of its GDP. It is now a powerhouse of trade, high-end real estate, and financial services. 

However, its “backyard” – the Strait of Hormuz – remains a strategic bottleneck. With 20% of global seaborne crude passing through this narrow vein, the recent tensions in March 2026 have forced a shift in perception: the Gulf is no longer an insulated sanctuary, including Dubai where millions of Indians work and earn for their families in India.

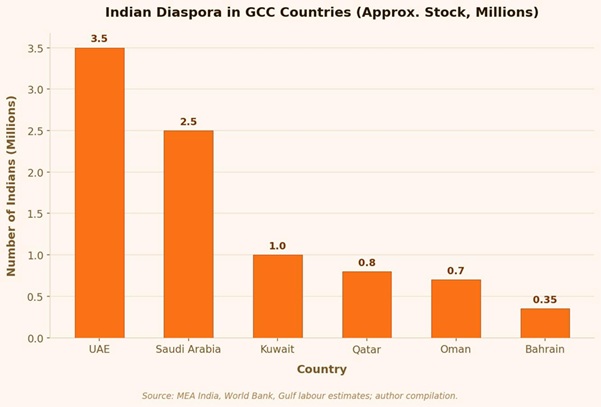
Indian Diaspora Gulf Representation

The scale of this “labour export” is enormous. As of early 2026, approximately 9.5 to 10 million Indians live and work across the GCC (Gulf Cooperation Council) countries. To put that in perspective, that is nearly the entire population of a country like the UAE, made up solely of Indian expats.

A Remittance Driven Economy

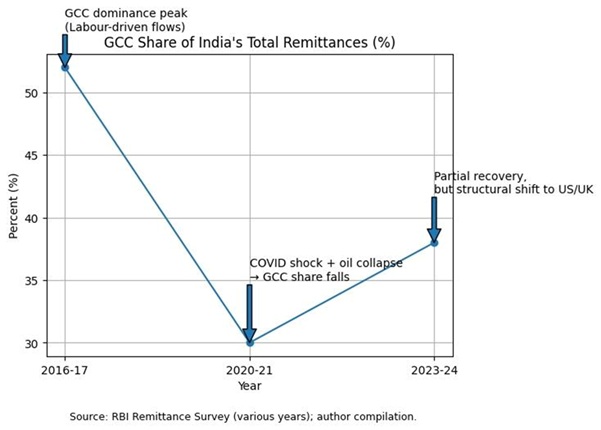
As per Government data sources, India remains the world’s top remittance recipient, with total inflows hitting a record $135.4 billion in the last fiscal year. And despite a rise in high-skilled migration to the US and UK, the GCC remains a juggernaut, contributing roughly 38% of India’s total remittances.

For states like Tamil Nadu, Kerala, and Maharashtra, which receive nearly 50% of these total inflows, it is a macroeconomic stabilizer that funds the current account deficit and keeps the Rupee from a freefall.

India’s Labour Market Paradox

But here is the real question, if people return to India due to the crisis in the Middle East, are there any “good quality” jobs waiting for them in India? The honest answer is no.

Youth unemployment remains elevated, particularly among graduates. Engineers in mechanical and construction fields face limited opportunities. Outside IT, and to some extent automobiles, there are not enough stable, high-paying jobs.

So people adjust. You will find postgraduates working in delivery jobs and informal sectors. I have personally spoken to Amazon delivery workers who told me they hold M.A degrees, or that they had worked in Dubai or Singapore before Covid and are now trying to leave again. This is becoming norm nowadays.

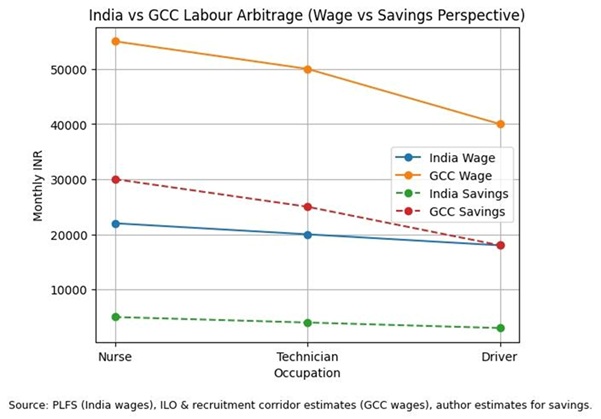
Indian National Wages and Savings Compared to Expat GCC Averages

In many towns in India, migration itself has become an economic model. People move to Singapore, Malaysia, or the Gulf, and the money they send back drives real estate, consumption, and local business activity. In many such regions, the labour market feels tight, not because jobs are available, but because the workforce has already left.

The wage gap explains everything. A nurse or lab technician in India may earn ₹15,000–₹20,000 per month. The same person can earn close to ₹80,000 in the Gulf. A private school teacher in Villupuram city in Tamil Nadu state earns around ₹8,000.

While nominal wages are  2–2.5x higher in GCC, the true driver of migration is savings arbitrage , which can be 5–6x higher.

This reflects structural differences in labour productivity and capital intensity.

India has a large pool of educated labour. But instead of becoming an advantage, it has turned into a wage suppressing force. There is always someone willing to work for less. As a result, wages remain low and bargaining power stays weak.

Percent of India’s Remittances From The GCC

At the same time, we are told growth is strong. Yes, the labour force participation is rising, but inequality is also increasing. A large share of employment remains informal and unstable. Inflation continues to erode purchasing power, and disposable incomes remain under pressure.

Right now, for many Indians, prosperous conditions are easier to find outside the country. Yes, the Gulf has risks. However, geopolitical tensions will come and go, and these are short-term disruptions.

Structurally, GCC economies will stabilize and grow again, and when they do, the flow of Indian labour will continue to pursue these opportunities. Because until India creates enough high-quality jobs at scale, migration will not slow down.

Copy and paste the text from AMT that you want to share

Outflows 20250220a

India Insider: Macro Stress a Capital Flow Problem, Not a Trade One

India Insider: Macro Stress a Capital Flow Problem, Not a Trade One

Editor’s note: This article was originally written in January 2026. It has been updated to incorporate developments through February 2026, including the U.S – India interim trade agreement and subsequent capital flow data.

India is currently experiencing what can best be described as macro stress. By macro stress, we mean pressure across the broader economy that shows up simultaneously in the currency, financial markets, and capital flows, rather than a problem limited to one sector or company. In India’s case, this stress is visible in a weak rupee, persistent foreign investor outflows, and rising concerns about equity valuations.

This stress is often misinterpreted as a trade or export problem. In reality, the pressure on the Rupee and the growing fragility in equity markets stem primarily from the capital account, not from collapsing exports or remittances. Even as the U.S Dollar softens – helped by Federal Reserve rate cuts and renewed trade tensions under U.S President Donald Trump, India continues to struggle to attract foreign capital, exposing a deeper structural imbalance.

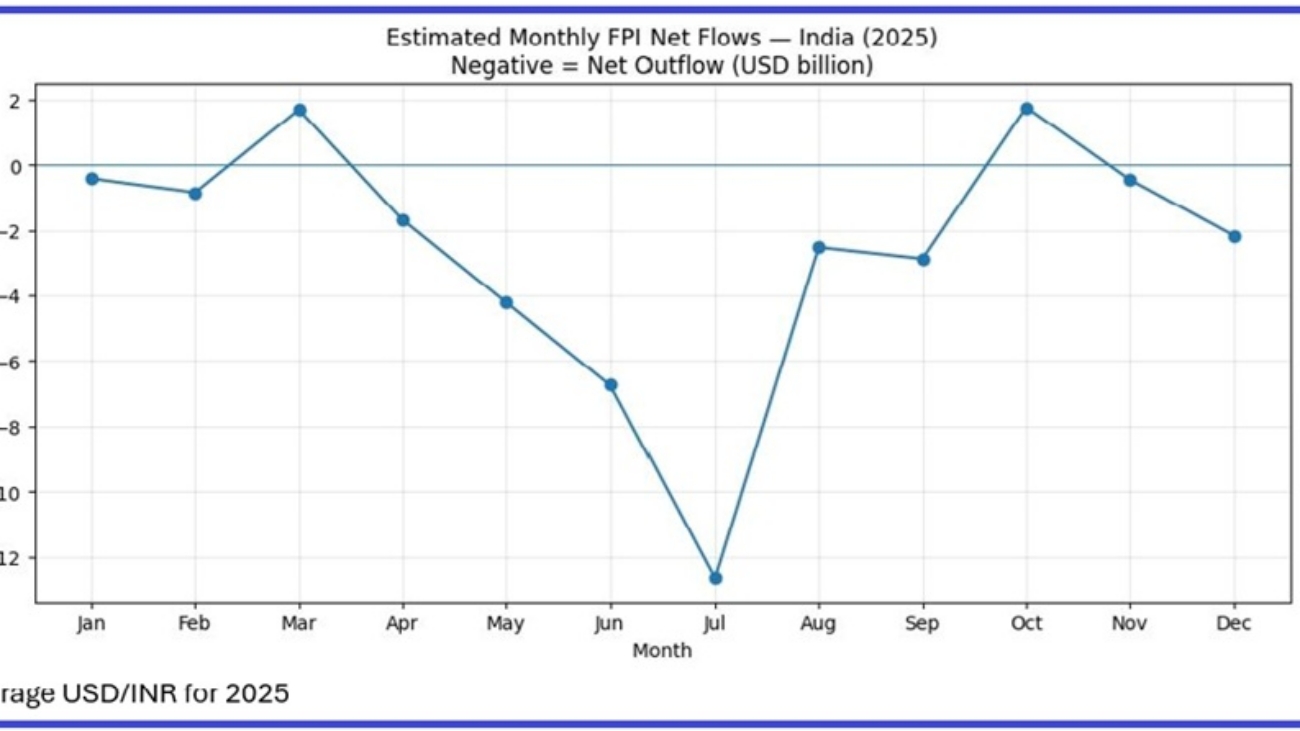
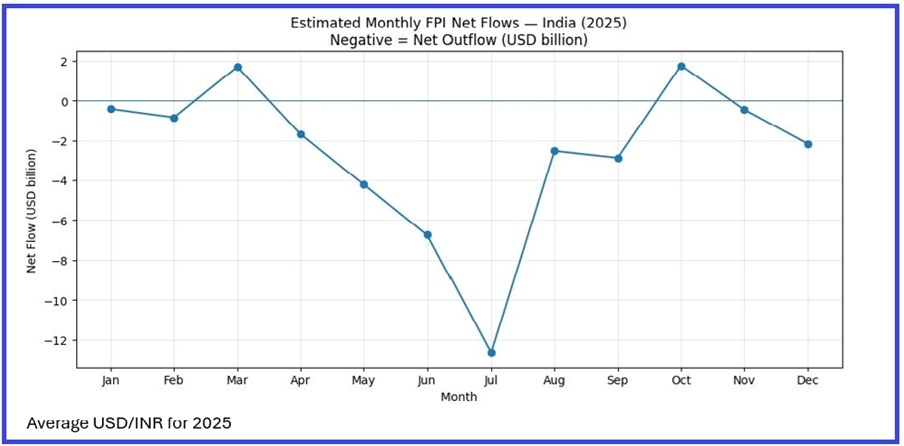
Source: NSDL (FPI Equity Flows): Reuters and author’s calculations.

Recent weakness in the USD would normally support emerging market currencies and risk assets. This time, however, the response across emerging markets has been uneven. Capital has flowed toward economies linked to artificial intelligence, semiconductors, and commodities, as well as toward markets where valuations have already adjusted. South Korea, Hong Kong, Chile, and South Africa have all benefited from this rotation. India has not.

The Rupee’s weakness reflects this divergence. USD/INR continues to trade around ₹91.5–91.6 despite the absence of a sharp deterioration in India’s trade fundamentals. Services exports, particularly IT services, remain resilient, and remittances continue to provide a steady source of foreign exchange. This brings us to the current account.

The current account represents a country’s net trade balance with the rest of the world, including goods, services, and remittances. India runs a current account deficit, meaning it imports more than it exports. While this deficit persists, it is manageable at present, supported by stable services exports and remittance inflows.

The real problem lies in the capital account, which tracks investment flows such as foreign investors buying or selling Indian equities and bonds. When foreign capital flows into the country, it helps finance the current account deficit. When it flows out, pressure builds quickly on the currency and financial markets.

Foreign capital is neither entering India in sufficient scale, nor remaining invested. Portfolio outflows have become persistent, and this has emerged as the dominant driver of currency pressure. In calendar year 2025, foreign portfolio investors sold approximately USD 19–20 billion worth of Indian equities, marking one of the largest annual equity outflow episodes in recent years. Importantly, this selling has been sustained rather than episodic, pointing to a structural reassessment of India’s growth outlook and valuation premium rather than a temporary risk off shock.

Crucially, this capital flight is not the result of a collapse in exports to the United States. Despite tariff concerns, the U.S remains India’s largest export destination. Between April and December 2025, Indian exports to the U.S rose to roughly $65–68 billion, compared with $60–63 billion during the same period last year. Trade flows, for now, are holding up better than sentiment suggests.

The effects of capital account stress are most visible in financial markets. Indian equities are failing to attract foreign inflows as growth momentum weakens. Market leadership has narrowed, with headline indices supported by a small group of large-cap stocks, while consumption-sensitive sectors such as FMCG remain under pressure.

This dynamic fits squarely within the balance of payments framework described by Professor Michael Pettis. He described, “a country cannot sustainably run a current account deficit without stable capital inflows. When capital inflows weaken, the adjustment shows up through a weaker currency, tighter financial conditions, and pressure on asset prices.”

Indian equities now trade at some of the highest valuation multiples globally, supported largely by domestic retail and mutual fund flows. However, domestic capital is structurally constrained, while global investors can freely reallocate. As Bloomberg’s Andy Mukherjee recently noted, Indian cement stocks now trade at higher valuations than Hong Kong Tech stocks showing the exuberance of Domestic equity capital chasing local themes.

At a deeper level, India’s vulnerability reflects a structural imbalance between savings and investment. Domestic savings are insufficient relative to the economy’s long term investment needs, and the financial system lacks the institutional capacity to consistently channel savings into productivity enhancing investment. As a result, growth has become increasingly dependent on mobile foreign capital – capital that is cyclical, return sensitive, and easily reversible. It is this dependence, more than any near term trade shock, that leaves the Indian rupee vulnerable when global capital flows turn cautious.

Update: The US–India Interim Trade Agreement (February 2026)

Since this article was first written, a significant development has reshaped the near-term outlook. In early February 2026, the United States and India reached an interim trade agreement. As part of the deal, the US lowered its reciprocal tariff on Indian goods from 25% to 18%. President Trump also signed a separate executive order removing an additional punitive 25% tariff that had been imposed as a penalty for India’s purchases of Russian oil, meaning the effective tariff burden on Indian exports had, at its peak, approached 50% before being brought down to 18%.

The announcement acted as an immediate sentiment catalyst. The rupee, which had been trading in the ₹91.5–92 range under stress conditions, strengthened on the news, touching ₹90.30 before settling near ₹90.70. Foreign portfolio investors, who had spent most of 2025 as relentless net sellers, turned net buyers in the first week of February 2026, purchasing approximately $897 million worth of Indian equities.

These are meaningful moves. After 18 months of persistent underperformance relative to other emerging markets, India’s excessive valuation premium has moderated toward historical averages, which may create better entry points for global capital going forward.

Copy and paste the text from AMT that you want to share